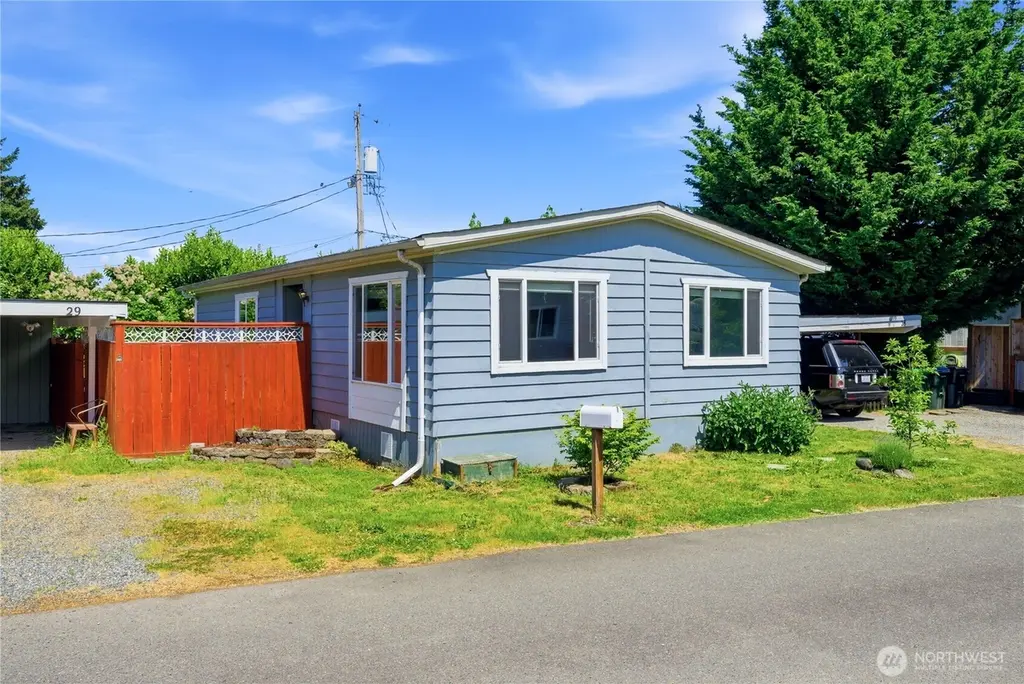
10900 Kuhlman Rd SE #29 · Nisqually Indian Community, WA
Flood risk 7/10 · Major
- FEMA flood zone
- AE
- Chance of flooding over 30 yrs
- 0.76%
- Est. flood insurance / yr
- $1,737 – $8,500
Fire risk 4/10 · Minor
- Est. fire insurance / yr
- $604 – $1,122
Heat risk 3/10 · Minor
- Hot days now (above 87°F)
- 7 days/yr
- Hot days in 30 yrs
- 15 days/yr
Wind risk 1/10 · Minimal
- Chance of severe wind over 30 yrs
- —
Air-quality risk 6/10 · Moderate
- Unhealthy air days now
- 7 days/yr
- Unhealthy air days in 30 yrs
- 8 days/yr
Risk factors via First Street. Map © Google.
Why this score? — see what drove the B grade
The composite is a weighted blend of 9 inputs, each scored 0–100. Each bar is that input's sub-score; the figure is the points it added to the 100-point composite (weight × sub-score).
- Cash flow +30.0/30.0
- 1% rule +10.0/10.0
- DSCR +10.0/10.0
- ARV discount +8.2/15.0
- Schools +5.1/10.0
- Rent growth +3.4/5.0
- Livability +2.9/5.0
- Condition / age +2.5/5.0
- Appreciation +0.0/10.0
$67,500
🖨 Deal sheet 📄 Offer letter ✓ Due diligence
Listing remarks
Well-maintained 1978 double-wide manufactured home located in a welcoming all-ages community! This 2-bedroom, 1.75-bath home features a spacious living room, dedicated dining area, and convenient laundry room complete with washer and dryer. The kitchen includes an electric range, dishwasher, and garbage disposal. Enjoy the generously sized fenced lot with front and back gate access, a covered carport, storage garage, and a peaceful backyard fish pond. Pride of ownership shines throughout, offering a great opportunity for comfortable and affordable living. The community features a recently updated clubhouse complete with an exercise room. Conveniently located near I-5, Nisqually Wildlife Ref
Key facts
- Electric range
- Storage garage
- Covered carport
Tags
Property features AI
Finance
- Other: Buyer to verify schools
- Financial info: Listing terms: Cash or Conventional
- HOA & community: Land lease: $708/month; Park approved for sale; About 100 homes in the park; Park name: Claudia's Mobile Park Estates
Exterior
- Parking: Carport
- Utilities: Electric service (PSE); Community water (City of Olympia); Power: Electric
- Home design: Manufactured double-wide home; One story
- Construction: Composition roof; Manufactured after 6/15/1976
- Exterior features: Community has clubhouse, common area, exercise room, laundry and RV parking; Has view
Interior
- Kitchen: Dishwasher; Refrigerator; Stove/Range
- Bedrooms: 2 bedrooms
- Flooring: Laminate
- Bathrooms: 1 full bath; 1 three-quarter bath
- Heating & cooling: Forced air heating; Window air conditioning unit(s)
- Interior features: Fireplace (electric)
- Laundry & utility: Washer; Dryer
Neighborhood map
What this means for you Summary
Snapshot
- This is a 2-bed/2.0-bath manufactured listed at $68k.
Deal economics
- At list price, monthly cash flow is $695 ($8k/yr) — positive.
- The deal already cash-flows at list — no discount required.
- Meets the 1% rule at list price ($2k rent vs $68k).
- Recommended offer: $66k (1.5% below list) — sets the bar for market timing.
- Cap rate 26.2% vs local median 2.2% in Nisqually Indian Community — top-decile yield for the area; either an underpriced asset or a hidden risk that comps aren't pricing in. Stress-test before assuming the spread holds.
Location & tenants
- Location reads 57/100 on livability (#533 in WA) — a working-class tenant base; expect higher turnover. Strengths: housing A+, cost of living B; Watch: health & safety C-, employment D, schools F.
- North Thurston Public Schools (suburban): math 51% / reading 62% proficiency, ranked #80 of 291 in WA (top 28%) — acceptable for families but not a draw, mixed tenant base, ~2y average lease.
- Market conditions: Rents rising (+3.4%/yr); 307 active listings in the ZIP; 3 comparable units currently listed for rent nearby; rentals at typical pace (median 15d on market — plan ~3-4 weeks tenant-placement turnaround); high-income renter base; 1,222 units permitted in Thurston County in 2024 (508 in 5+ unit buildings).
Forward outlook
- Local home prices are declining (-3.0%/yr); year-one equity from $467 of loan paydown is wiped out by about $2k of value loss. Plan a longer hold.
- Thurston County population projected at +27% by 2050 — long-run rental-demand tailwind backs the buy-and-hold thesis.
- At projected returns (-3.0% appreciation + 3.4% rent growth), your $19k cash investment doubles in ~3 years — after that, you're playing with house money.
Negotiation context
- It's been on market 22 days — a 2% lower offer ($66k) is reasonable based on typical stale-listing flexibility.
Risks & watch-outs
- Watch-outs: flood insurance adds $427/mo.
- Climate carrying-cost: in FEMA flood zone AE (mandatory federal flood insurance) — expect insurance premiums to compound above CPI over the hold.
Questions for the listing agent
- Built in 1978 — when were the roof, HVAC, electrical panel, plumbing, and water heater last replaced?
- What's the actual annual flood-insurance premium (NFIP or private), and is the property in a SFHA with mandatory coverage?
- Is there a deadline driving the sale (1031 exchange, divorce, estate, relocation)? That informs how much negotiation room exists.
- Schools are F-rated, which usually means shorter tenancies and higher turnover. Who's the typical renter profile here, and what's been the actual vacancy rate?
- Crime grade is D in this area — have there been break-ins, vandalism, or insurance claims at this property in the last 3 years? What carrier currently insures it and at what premium?
- What's the average days-on-market for RENTAL listings here right now (not sales)? A rising rental-DOM trend means longer vacancies and softer asking-rent achievability than the comps imply.
- What's the recent tenant-quality profile in this submarket — average credit score on applications, eviction rate, late-payment / NSF rate, and stable-employment percentage? A property-management company in the area should have these aggregated.
- How much new for-sale + rental construction is in the pipeline within 1–3 miles? Heavy new supply typically softens prices + rents 12–24 months out; constrained supply supports both.
Investment metrics
- 1% rule
- 2.87% ✓
- Cap rate
- 26.23%
- Cash-on-cash
- 71.21%
- DSCR
- 4.17
- GRM
- 2.9
CMA / ARV
- ARV (on-the-fly)
- $68,640
- Comps found
- 9
Show comp detail 9 sales within ~0.75 mi
| Address | Dist | Beds/Ba | Sqft | Sold | Price | $/sf | Match |
|---|---|---|---|---|---|---|---|
| 10900 Kuhlman Rd SE #88 | 0.14mi | 3/2.0 (+1) | 1,016 (-4%) | 6mo | $40,000 | $39 | 77 |
| 10900 Kuhlman Rd SE #98 | 0.15mi | 3/2.0 (+1) | 980 (-7%) | 4mo | $43,700 | $45 | 73 |
| 10900 Kuhlman Rd SE #54 | 0.10mi | 3/2.0 (+1) | 950 (-10%) | 3mo | $74,000 | $78 | 71 |
| 10900 Kuhlman Rd SE #55 | 0.09mi | 2/2.0 | 924 (-12%) | 8mo | $57,000 | $62 | 68 |
| 10900 Kuhlman Rd SE #89 | 0.15mi | 2/2.0 | 924 (-12%) | 9mo | $60,000 | $65 | 65 |
| 10900 Kuhlman Rd SE #59 | 0.08mi | 3/1.5 (+1) | 924 (-12%) | 6mo | $56,500 | $61 | 63 |
| 10900 Kuhlman Rd SE #72 | 0.14mi | 3/2.0 (+1) | 1,188 (+12%) | 16mo | $99,000 | $83 | 55 |
| 612 Nisqually Park Dr SE | 0.48mi | 2/2.0 | 1,080 (+2%) | 23mo | $319,700 | $296 | 55 |
| 11403 Gardner Ct SE | 0.51mi | 3/2.0 (+1) | 1,036 (-2%) | 18mo | $310,000 | $299 | 53 |
Match score weights: distance 35% · size 25% · config 20% · recency 20%. Top-matched comps best support the ARV.
Projected returns pro-forma
-3.0% appreciation · 3.43% rent growth · sell at horizon
- IRR
- 41.9%
- Equity multiple
- 2.82×
- Total profit
- $34,425
- Equity at exit
- $10,064
- IRR
- 48.4%
- Equity multiple
- 5.84×
- Total profit
- $91,502
- Equity at exit
- $5,836
Cash invested: $18,900 (down + closing). Projections, not guarantees.
Landlord ↔ Tenant lean methodology
- Overall (STATE)
- 28 Tenant-Leaning
- State Washington
- 28 Tenant-Leaning · D+8
- County
- — inherits STATE
- City
- — inherits STATE
ZIP-level market 98513
- Rents YoY
- 3.4%
- Active inventory
- 307
- Price-to-rent
- 2.9×
Monthly cashflow live
- Estimated rent
- $1,938 medium interval (Pro) →
- Mortgage (P&I)
- −$354
- Tax from tax record
- −$28 /mo · $331/yr
- Insurance
- −$28
- Flood insurance flood zone
- −$427 /mo · $5,118/yr
- HOA
- −$0
- Vacancy / Maint / Mgmt
- −$407
- Net cashflow
- $695
Break-even live
UW: 25.0% down · 7.5% · 30yr · 1.5% tax · 5.0% vac · 8.0% maint · 8.0% mgmt
Financing live
Cash to close
- Down payment
- $16,875
- Closing costs
- $2,025
- Reserves months
- —
- Total cash needed
- —
Loan-product check · same deal, 3 products live
Conventional
25% down · 7.5% · 30yr
- Down + closing
- —
- Monthly P&I
- —
- Monthly cashflow
- —
- DSCR
- —
- Eligible?
- —
Personal DTI + credit; lowest rate.
DSCR
20% down · 8.5% · 30yr
- Down + closing
- —
- Monthly P&I
- —
- Monthly cashflow
- —
- DSCR
- —
- Eligible?
- —
No personal income docs; deal must DSCR.
Hard money
10% down · 12.0% · 12mo
- Down + closing
- —
- Monthly P&I
- —
- Monthly cashflow
- —
- DSCR
- —
- Eligible?
- —
Short-term bridge; refi at stabilization.
Rent comps 3 comps
| Address | Beds | Baths | Sqft | Rent | $/sqft | DOM | Units | Dist |
|---|---|---|---|---|---|---|---|---|
| 509 Old Pacific Hwy SE Olympia, WA | 1.0–3.0 | 1.0–1.5 | 860 | $1,833 | $2.13 | 18d | 1 | 0.55mi |
| 509 Old Pacific Hwy SE Olympia, WA | 1.0–3.0 | 1.0–1.5 | 860 | $1,838 | $2.14 | 13d | 3 | 0.55mi |
| 509 Old Pacific Hwy SE Unit A5 Olympia, WA | 2.0 | 1.0 | 888 | $1,737 | $1.96 | 15d | 1 | 0.55mi |
Listing history 11 events
-
2026-06-13status $67,500 Pending 22 DOM
-
2026-06-10days on market $67,500 Active 22 DOM
-
2026-06-09days on market $67,500 Active 21 DOM
-
2026-06-08days on market $67,500 Active 20 DOM
-
2026-06-07days on market $67,500 Active 19 DOM
-
2026-06-03days on market $67,500 Active 15 DOM
-
2026-06-02days on market $67,500 Active 14 DOM
-
2026-06-01days on market $67,500 Active 13 DOM
-
2026-05-31days on market $67,500 Active 12 DOM
-
2026-05-30days on market $67,500 Active 11 DOM
-
2026-05-19$67,500 Active
ⓘ Source: listings_history table (triggers on properties + properties_extension) + one-shot
backfill from property_details.listing_events for pre-trigger history.
Tax reassessment forecast WA · Resets to sale price
- Current annual tax
- $331 · $28/mo
- Projected year-2 tax
- $662 · $55/mo
- Expected delta
- +$330/yr (+$28/mo · 99.6%)
ⓘ Screening estimate from a state-policy table — verify with the county assessor before closing.
Climate risk First Street
- Flood 7/10 Severe FEMA zone AE · 76% chance over 30 yrs
- Wildfire 4/10 Moderate
- Heat 3/10 Moderate 7 d/yr ≥87°F today · 15 d/yr by 30 yrs out
- Wind 1/10 Low
- Air quality 6/10 Major 7 unhealthy d/yr today · 8 by 30 yrs out
Nearby sold comps map
Loading sold comps map…
Walkable amenities ~0.75 mi
Loading nearby amenities…
Taxation est. · year 1
- Rental income
- $23,259
- − Mortgage interest
- −$3,781
- − Property taxes
- −$331
- − Insurance
- −$5,456
- − Repairs & maintenance
- −$1,861
- − Management
- −$1,861
- − Depreciation
- −$1,964
- Taxable income
- $8,006
- Est. tax owed @ 24.0%
- −$1,921
- After-tax cash flow
- $6,418/yr
For passive investors: Depreciation is non-cash, so a rental often shows a tax loss while cash-flowing — sheltering income. Rental losses are passive: they offset passive income freely, and up to $25,000/yr can offset ordinary (W-2) income if you actively participate and your MAGI is under $100k (phasing out to $0 by $150k); unused losses carry forward. On sale, claimed depreciation is recaptured at up to 25%, and gains may owe capital-gains tax (a 1031 exchange can defer both). Figures are a year-1 estimate at your 24.0% rate — not tax advice; consult a CPA.
Schools (NCES district)
- District
- North Thurston Public Schools
- NCES district ID
- 5305850
- Math proficiency
- 51% ▬ 0.00%
- Reading proficiency
- 62% ▬ 0.00%
- Median HH income
- $62,338
- Composite
- 51.09/100
- National rank
- #3798
- State rank
- #80 of 291 in WA
Livability — Nisqually Indian Community
- Score
- 57/100
- State rank
- #533
- US rank
- #22170
Category grades
Schools grade is shown separately in the Schools card above.
Census & demographics
- County
- Thurston County · 269,345 people
- Metro
- Olympia-Lacey-Tumwater, WA
- Population (ZIP)
- 38,017
- Household income
- $113,053
- Rent vs Own
- Severe rent burden
- 566.0
Population outlook (Thurston County) Hauer SSP2
- Today (2025)
- 308,239 people
- By 2030
- 326,483 · +5.9%
- By 2040
- 359,890 · +16.8%
- By 2050
- 391,800 · +27.1%
- By 2075
- 468,024 · +51.8%
- By 2100
- 519,890 · +68.7%
Race, ethnicity, and origin ACS 2023
- Neighborhood character
- Diverse neighborhood (Simpson 0.59)
- Race & ethnicity
- White 62% Two or more races 14% Hispanic / Latino 12% Asian 8% Black 5% Native American 2% Pacific Islander 2%
- Hispanic origin (detail)
- Mexican 8% Puerto Rican 2%
- Common ancestry
- Portuguese 4% Lithuanian 3% Italian 3%
- Foreign-born
- 11% · Canada, Vietnam, South Korea
- Languages at home
- 86% English-only · Spanish 5% Other Asian/Pacific 3% Vietnamese 2%
Political lean MEDSL · Thurston
- 2024 margin
- Strong D (+20.4) · D 58.5% · R 38.1% · Other 3.5%
- 2008→2024 swing
- -1.3pp toward R · 2008: 21.7pp · 2024: 20.4pp
- All cycles
- 2024: D+20.4 2020: D+18.6 2016: D+15.4 2012: D+19.0 2008: D+21.7
Not yet ingested
- Civics
- —
Market trends
- HPI YoY
- ▼ -377.44%
- Current HPI
- 337.436
- Rent YoY
- ▲ 3.43%
- Metro
- Olympia-Lacey-Tumwater, WA
- State GDP YoY
- ▲ 4.65%
- F500 in state
- 22
Industry mix (Fortune 500 HQ in WA)
| Industry | F500 HQs | Revenue |
|---|---|---|
| Retail | 2 | $269B |
|
||
| Technology / Retail | 1 | $638B |
|
||
| Technology | 1 | $245B |
|
||
| Telecommunications | 1 | $38B |
|
||
| Food / Beverage | 1 | $36B |
|
||
| Automotive / Trucks | 1 | $34B |
|
||
Price history
1 event — show timeline
- 2026-05-19 Listed $67,500 NWMLS as Distributed by MLS Grid
Property tax history
+4.3%/yrLatest (2026): $331 · -34.8% YoY. Source: county tax records.
Cash-flow waterfall
monthlySold comps — $/sqft
last 12 mo · ≤1 miLoading sold comps…