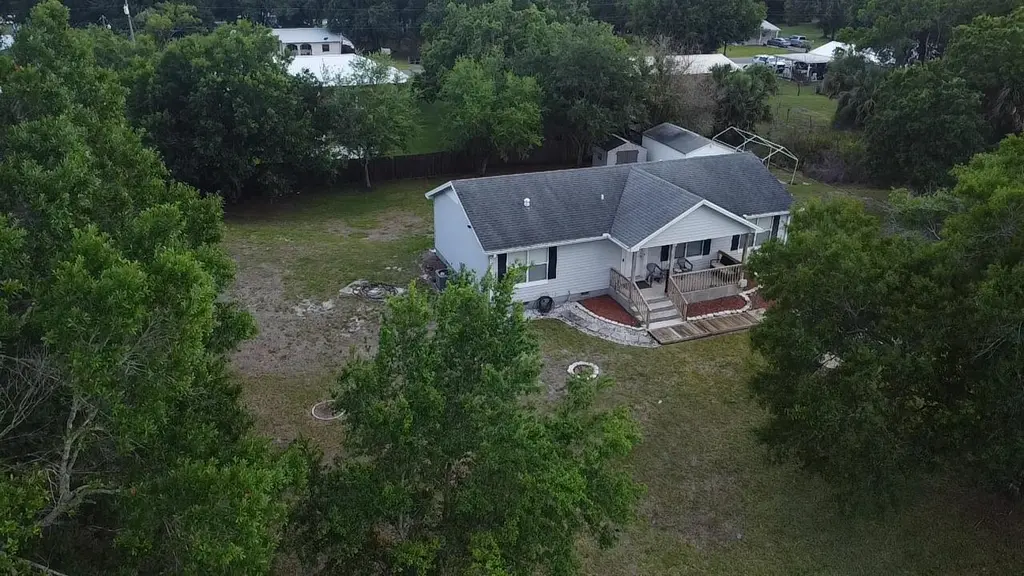
7718 NW 82nd Ct · Okeechobee, FL
Flood risk No data
- FEMA flood zone
- —
- Chance of flooding over 30 yrs
- —
- Est. flood insurance / yr
- —
Fire risk No data
- Est. fire insurance / yr
- —
Heat risk No data
- Hot days now (above threshold)
- —
- Hot days in 30 yrs
- —
Wind risk No data
- Chance of severe wind over 30 yrs
- —
Air-quality risk No data
- Unhealthy air days now
- —
- Unhealthy air days in 30 yrs
- —
Risk factors via First Street. Map © Google.
Why this score? — see what drove the C+ grade
The composite is a weighted blend of 9 inputs, each scored 0–100. Each bar is that input's sub-score; the figure is the points it added to the 100-point composite (weight × sub-score).
- Cash flow +22.3/30.0
- ARV discount +12.2/15.0
- DSCR +7.2/10.0
- 1% rule +4.7/10.0
- Livability +3.9/5.0
- Schools +3.6/10.0
- Rent growth +2.5/5.0
- Condition / age +2.5/5.0
- Appreciation +2.0/10.0
$215,000
🖨 Deal sheet 📄 Offer letter ✓ Due diligence
Listing remarks MLS
Peaceful country living in this adorable 3 bedroom, 2 bath home with vaulted ceilings, split floor plan and loads of light. JUST INSTALLED ( 1/2014) NEW ROOF, NEW A/C, NEW HARDWOOD FLOORING. Large master with en suite bath, large laundry room, large front porch and big back yard! Property is a double lot and close to an acre with a variety of mature trees. Come have a look! Seller will install refrigerator.
Key facts
- 0.72 acre lot
- 2 parking spots
- Built 2000
Tags
Property features AI
Finance
- Other: Pets allowed with no restrictions
Exterior
- Parking: Unpaved parking; 2 parking spaces
- Utilities: Well water; Septic tank; Electricity connected; Cable available
- Home design: Single family residence; One-story; Faces north; Resale property; Rural road frontage
- Construction: Pre-fab construction; Shingle roof; Concrete perimeter foundation; Built area approximately 1,224 (public records)
- Exterior features: Many trees on the lot; Paved road frontage; Not waterfront
Interior
- Bedrooms: 3 bedrooms on the main level
- Flooring: Carpet; Vinyl
- Bathrooms: 2 full bathrooms on the main level
- Heating & cooling: Central heating; Central air conditioning
- Interior features: Split bedroom layout
- Laundry & utility: Dedicated laundry room
Neighborhood map
What this means for you Summary
Snapshot
- This is a 3-bed/2.0-bath single-family listed at $215k.
Deal economics
- At list price, monthly cash flow is $356 ($4k/yr) — positive.
- The deal already cash-flows at list — no discount required.
- To meet the 1% rule (rent ≥ 1% of price), the offer needs to be $208k (3.3% below list).
- Recommended offer: $208k (3.3% below list) — sets the bar for 1% rule.
- Cap rate 8.3% vs local median 4.3% in Okeechobee — top-decile yield for the area; either an underpriced asset or a hidden risk that comps aren't pricing in. Stress-test before assuming the spread holds.
Location & tenants
- Location reads 77/100 on livability (#210 in FL, #3,234 nationally) — a middle-class / working-renter tenant base. Strengths: cost of living A+, housing A+, health & safety A+; Watch: employment C-, amenities F, commute F.
- Okeechobee (town): math 44% / reading 42% proficiency, ranked #58 of 73 in FL (top 80%) — families likely to look elsewhere, expect single-tenant / working-renter base with shorter leases; 72% free/reduced lunch — lower-income household profile, screen leases tightly.
- Zoned schools: Seminole Elementary School (math 57% / reading 54%, grade C, #855 of 2,144 statewide, top 41%, 502 students, 75% FRL); Yearling Middle School (math 45% / reading 32%, grade F, #384 of 571 statewide, top 68%, 668 students, 70% FRL); Okeechobee High School (math 30% / reading 42%, grade F, #359 of 667 statewide, top 55%, 1,692 students, 62% FRL) — zoned schools at 69% FRL track the district average.
- Market conditions: 644 active listings in the ZIP; 18 units permitted in Okeechobee County in 2024 (0 in 5+ unit buildings).
Forward outlook
- Local home prices are declining (-3.0%/yr); year-one equity from $1k of loan paydown is wiped out by about $6k of value loss. Plan a longer hold.
- Okeechobee County population projected at -21% by 2050 — secular population decline; favor cash flow + early exit over multi-decade hold.
Negotiation context
- It's been on market 21 days — a 2% lower offer ($212k) is reasonable based on typical stale-listing flexibility.
- 6 sale attempts since 20y ago with the ask held roughly flat each time — persistent listings suggest the price (not the market) is what's stuck; bring a comps-based counter.
- Current owner paid $72k; list at $215k implies a 201% gain — meaningful room to come down on a strong offer.
Questions for the listing agent
- Is there a deadline driving the sale (1031 exchange, divorce, estate, relocation)? That informs how much negotiation room exists.
- What's the average days-on-market for RENTAL listings here right now (not sales)? A rising rental-DOM trend means longer vacancies and softer asking-rent achievability than the comps imply.
- What's the recent tenant-quality profile in this submarket — average credit score on applications, eviction rate, late-payment / NSF rate, and stable-employment percentage? A property-management company in the area should have these aggregated.
- How much new for-sale + rental construction is in the pipeline within 1–3 miles? Heavy new supply typically softens prices + rents 12–24 months out; constrained supply supports both.
Investment metrics
- 1% rule
- 0.97% ✗
- Cap rate
- 8.28%
- Cash-on-cash
- 7.09%
- DSCR
- 1.32
- GRM
- 8.6
CMA / ARV
- ARV (on-the-fly)
- $240,000
- Comps found
- 3
Show comp detail 3 sales within ~0.75 mi
| Address | Dist | Beds/Ba | Sqft | Sold | Price | $/sf | Match |
|---|---|---|---|---|---|---|---|
| 8132 NW 80th Ave | 0.14mi | 3/1.0 | 1,248 (+4%) | 21mo | $250,000 | $200 | 65 |
| 7619 NW 87th Ct | 0.34mi | 3/2.0 | 1,200 (0%) | 24mo | $240,000 | $200 | 64 |
| 7634 NW 82nd Ct | 0.05mi | 3/2.0 | 1,372 (+14%) | 14mo | $264,400 | $193 | 62 |
Match score weights: distance 35% · size 25% · config 20% · recency 20%. Top-matched comps best support the ARV.
Projected returns pro-forma
-3.0% appreciation · 3.0% rent growth · sell at horizon
- IRR
- -5.5%
- Equity multiple
- 0.80×
- Total profit
- $-12,262
- Equity at exit
- $32,057
- IRR
- 4.1%
- Equity multiple
- 1.30×
- Total profit
- $18,140
- Equity at exit
- $18,589
Cash invested: $60,200 (down + closing). Projections, not guarantees.
Landlord ↔ Tenant lean methodology
- Overall (STATE)
- 87 Strongly Landlord-Friendly
- State Florida
- 87 Strongly Landlord-Friendly · R+3
- County
- — inherits STATE
- City
- — inherits STATE
ZIP-level market 34972
- Home prices YoY
- -1.5%
- Active inventory
- 644
- Price-to-rent
- 8.6×
Monthly cashflow live
- Estimated rent
- $2,079 medium interval (Pro) →
- Mortgage (P&I)
- −$1,127
- Tax from tax record
- −$69 /mo · $830/yr
- Insurance
- −$90
- HOA
- −$0
- Vacancy / Maint / Mgmt
- −$437
- Net cashflow
- $356
Break-even live
UW: 25.0% down · 7.5% · 30yr · 1.5% tax · 5.0% vac · 8.0% maint · 8.0% mgmt
Financing live
Cash to close
- Down payment
- $53,750
- Closing costs
- $6,450
- Reserves months
- —
- Total cash needed
- —
Loan-product check · same deal, 3 products live
Conventional
25% down · 7.5% · 30yr
- Down + closing
- —
- Monthly P&I
- —
- Monthly cashflow
- —
- DSCR
- —
- Eligible?
- —
Personal DTI + credit; lowest rate.
DSCR
20% down · 8.5% · 30yr
- Down + closing
- —
- Monthly P&I
- —
- Monthly cashflow
- —
- DSCR
- —
- Eligible?
- —
No personal income docs; deal must DSCR.
Hard money
10% down · 12.0% · 12mo
- Down + closing
- —
- Monthly P&I
- —
- Monthly cashflow
- —
- DSCR
- —
- Eligible?
- —
Short-term bridge; refi at stabilization.
Listing history 14 events
-
2026-05-04status Pending
-
2026-04-12$215,000 Active
-
2014-09-04soldstatus $71,500
-
2014-08-29soldstatus $71,500 410-char remark
Show marketing remark (410 chars)
Peaceful country living in this adorable 3 bedroom, 2 bath home with vaulted ceilings, split floor plan and loads of light. JUST INSTALLED ( 1/2014) NEW ROOF, NEW A/C, NEW HARDWOOD FLOORING. Large master with en suite bath, large laundry room, large front porch and big back yard! Property is a double lot and close to an acre with a variety of mature trees. Come have a look! Seller will install refrigerator.
-
2014-01-23$74,500 410-char remark
Show marketing remark (410 chars)
Peaceful country living in this adorable 3 bedroom, 2 bath home with vaulted ceilings, split floor plan and loads of light. JUST INSTALLED ( 1/2014) NEW ROOF, NEW A/C, NEW HARDWOOD FLOORING. Large master with en suite bath, large laundry room, large front porch and big back yard! Property is a double lot and close to an acre with a variety of mature trees. Come have a look! Seller will install refrigerator.
-
2013-12-29historical
-
2013-03-08$62,000
-
2008-03-31soldstatus $98,000
-
2008-01-15$100,900
-
2007-08-07historical
-
2007-02-13$179,900
-
2006-07-20soldstatus $175,000
-
2006-07-14soldstatus $175,000
-
2006-05-13$177,000
ⓘ Source: listings_history table (triggers on properties + properties_extension) + one-shot
backfill from property_details.listing_events for pre-trigger history.
Tax reassessment forecast FL · Resets to sale price
- Current annual tax
- $830 · $69/mo
- Projected year-2 tax
- $1,784 · $149/mo
- Expected delta
- +$955/yr (+$80/mo · 115.1%)
ⓘ Screening estimate from a state-policy table — verify with the county assessor before closing.
Nearby sold comps map
Loading sold comps map…
Walkable amenities ~0.75 mi
Loading nearby amenities…
Taxation est. · year 1
- Rental income
- $24,943
- − Mortgage interest
- −$12,043
- − Property taxes
- −$830
- − Insurance
- −$1,075
- − Repairs & maintenance
- −$1,995
- − Management
- −$1,995
- − Depreciation
- −$6,255
- Taxable income
- $750
- Est. tax owed @ 24.0%
- −$180
- After-tax cash flow
- $4,091/yr
For passive investors: Depreciation is non-cash, so a rental often shows a tax loss while cash-flowing — sheltering income. Rental losses are passive: they offset passive income freely, and up to $25,000/yr can offset ordinary (W-2) income if you actively participate and your MAGI is under $100k (phasing out to $0 by $150k); unused losses carry forward. On sale, claimed depreciation is recaptured at up to 25%, and gains may owe capital-gains tax (a 1031 exchange can defer both). Figures are a year-1 estimate at your 24.0% rate — not tax advice; consult a CPA.
Schools (NCES district)
- District
- Okeechobee
- NCES district ID
- 1201410
- Math proficiency
- 44% ▼ -12.00%
- Reading proficiency
- 42% ▼ -4.00%
- Median HH income
- $36,710
- Composite
- 35.73/100
- National rank
- #4855
- State rank
- #58 of 73 in FL
Livability — Okeechobee
- Score
- 77/100
- State rank
- #210
- US rank
- #3234
Category grades
Schools grade is shown separately in the Schools card above.
Census & demographics
- City population
- 23,975
- Population (ZIP)
- 19,185
Population outlook (Okeechobee County) Hauer SSP2
- Today (2025)
- 37,273 people
- By 2030
- 35,885 · -3.7%
- By 2040
- 32,931 · -11.6%
- By 2050
- 29,433 · -21.0%
- By 2075
- 19,607 · -47.4%
- By 2100
- 11,814 · -68.3%
Race, ethnicity, and origin ACS 2023
- Neighborhood character
- Diverse neighborhood (Simpson 0.62)
- Race & ethnicity
- White 52% Hispanic / Latino 30% Black 14% Two or more races 14%
- Hispanic origin (detail)
- Mexican 24% Puerto Rican 1% Cuban 1%
- Common ancestry
- Lithuanian 3% Slovak 1% Romanian 1%
- Foreign-born
- 12% · Canada, Dominican Republic
- Languages at home
- 77% English-only · Spanish 22% Other Indo-European 0%
Political lean MEDSL · Okeechobee
- 2024 margin
- Solid R (+53.8) · D 22.9% · R 76.7%
- 2008→2024 swing
- -34.6pp toward R · 2008: -19.2pp · 2024: -53.8pp
- All cycles
- 2024: R+53.8 2020: R+44.4 2016: R+39.5 2012: R+20.0 2008: R+19.2
Not yet ingested
- Civics
- —
Market trends
- HPI YoY
- ▼ -5.94%
- Current HPI
- 389.1156
- Rent YoY
- —
- Metro
- —
- State GDP YoY
- ▲ 3.28%
- F500 in state
- 36
Industry mix (Fortune 500 HQ in FL)
| Industry | F500 HQs | Revenue |
|---|---|---|
| Industrial Technology | 2 | $29B |
|
||
| Insurance | 2 | $17B |
|
||
| Retail | 1 | $60B |
|
||
| Technology Distribution | 1 | $58B |
|
||
| Homebuilding | 1 | $35B |
|
||
| Technology Manufacturing | 1 | $35B |
|
||
Price history
+21.5% since first listed14 events — show timeline
- 2026-05-04 Pending — Beaches MLS
- 2026-04-12 Listed $215,000 Beaches MLS
- 2014-09-04 Sold (Public Records) $71,500 Public Records
- 2014-08-29 Sold (MLS) $71,500 Stellar MLS as Distributed by MLS Grid
- 2014-01-23 Listed $74,500 Stellar MLS as Distributed by MLS Grid
- 2013-12-29 Listing Removed — Stellar MLS as Distributed by MLS Grid
- 2013-03-08 Listed $62,000 Stellar MLS as Distributed by MLS Grid
- 2008-03-31 Sold (MLS) $98,000 Stellar MLS as Distributed by MLS Grid
- 2008-01-15 Listed $100,900 Stellar MLS as Distributed by MLS Grid
- 2007-08-07 Listing Removed — Stellar MLS as Distributed by MLS Grid
- 2007-02-13 Listed $179,900 Stellar MLS as Distributed by MLS Grid
- 2006-07-20 Sold (Public Records) $175,000 Public Records
- 2006-07-14 Sold (MLS) $175,000 Stellar MLS as Distributed by MLS Grid
- 2006-05-13 Listed $177,000 Stellar MLS as Distributed by MLS Grid
Property tax history
-5.8%/yrLatest (2020): $830 · +3.7% YoY. Source: county tax records.
Cash-flow waterfall
monthlySold comps — $/sqft
last 12 mo · ≤1 miLoading sold comps…