393 Rowlee Rd · Fulton, NY
Flood risk 1/10 · Minimal
- FEMA flood zone
- X (unshaded)
- Chance of flooding over 30 yrs
- 0.0%
- Est. flood insurance / yr
- $507 – $1,088
Fire risk 3/10 · Minor
- Est. fire insurance / yr
- $691 – $1,283
Heat risk 2/10 · Minimal
- Hot days now (above 94°F)
- 7 days/yr
- Hot days in 30 yrs
- 16 days/yr
Wind risk 1/10 · Minimal
- Chance of severe wind over 30 yrs
- 0.0%
Air-quality risk 2/10 · Minimal
- Unhealthy air days now
- 1 days/yr
- Unhealthy air days in 30 yrs
- 1 days/yr
Risk factors via First Street. Map © Google.
Why this score? — see what drove the B+ grade
The composite is a weighted blend of 9 inputs, each scored 0–100. Each bar is that input's sub-score; the figure is the points it added to the 100-point composite (weight × sub-score).
- Cash flow +30.0/30.0
- 1% rule +10.0/10.0
- DSCR +10.0/10.0
- Appreciation +8.4/10.0
- ARV discount +7.5/15.0
- Livability +3.1/5.0
- Schools +3.0/10.0
- Rent growth +2.5/5.0
- Condition / age +2.5/5.0
$39,900
🖨 Deal sheet 📄 Offer letter ✓ Due diligence
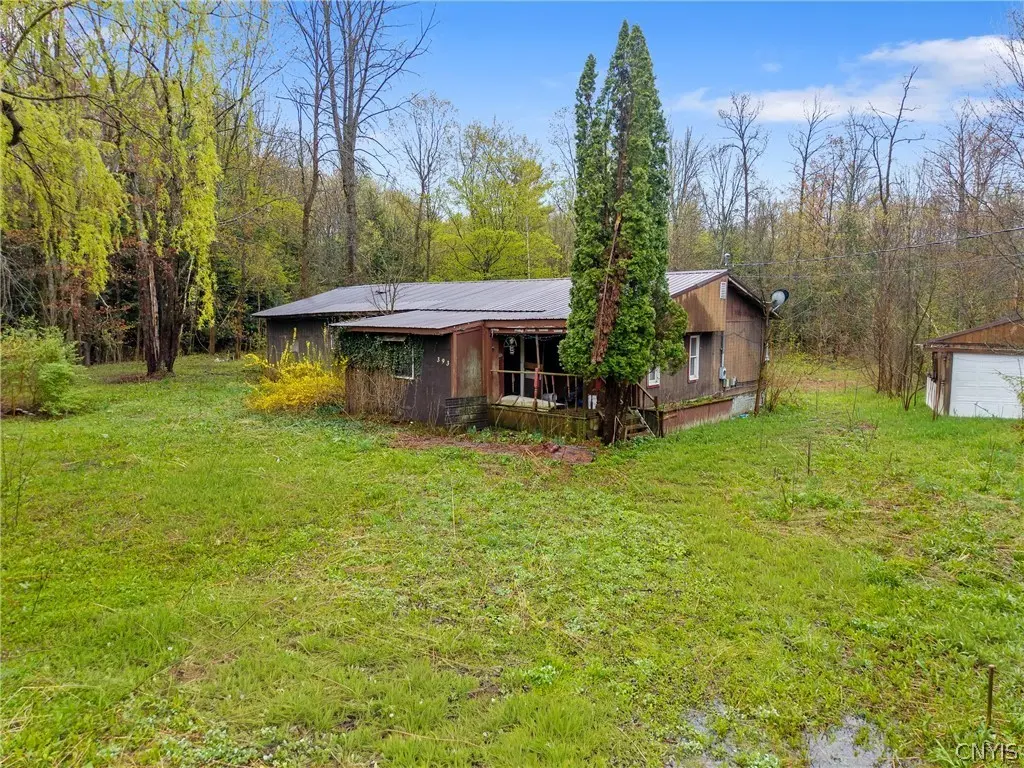
Listing remarks
Opportunity awaits on this 5.18-acre parcel in Volney, New York! This property is being sold as-is and offers a great chance for investors, builders or buyers looking to create their own space from the ground up! With over 5 acres, you'll find plenty of space for a new build, recreational use or a private getaway setting. Enjoy the peace and privacy of a rural location while still being just a short drive to shopping, dining and everyday convenience. Bring your vision and unlock the potential this property has to offer!
Key facts
- 5.18-acre parcel
- 5.18 acre lot
- 2 garage spots
Tags
Property features AI
Exterior
- Parking: Detached 2-car garage
- Utilities: Well water; Septic tank
- Home design: Single-story home; Existing construction; Wood siding
- Construction: Block foundation
- Exterior features: Dirt driveway; Wooded lot; Rectangular lot
Interior
- Kitchen: Electric water heater
- Bedrooms: Three main-level bedrooms
- Flooring: Tile; Varies
- Bathrooms: One full bathroom (main level)
- Heating & cooling: Electric heating; Gas heating; Baseboard heating
- Interior features: Eat-in kitchen; Family room; Crawl space basement
- Laundry & utility: Electric water heater
Neighborhood map
What this means for you Summary
Snapshot
- This is a 3-bed/1.0-bath manufactured listed at $40k.
Deal economics
- At list price, monthly cash flow is $943 ($11k/yr) — positive.
- The deal already cash-flows at list — no discount required.
- Meets the 1% rule at list price ($2k rent vs $40k).
- Cap rate 34.6% vs local median 6.9% in Fulton — top-decile yield for the area; either an underpriced asset or a hidden risk that comps aren't pricing in. Stress-test before assuming the spread holds.
Location & tenants
- Location reads 61/100 on livability (#907 in NY) — a middle-class / working-renter tenant base. Strengths: cost of living A+, housing A+; Watch: employment D, schools D-, crime F.
- Fulton City School District (town): math 29% / reading 43% proficiency, ranked #554 of 590 in NY (top 94%) — families likely to look elsewhere, expect single-tenant / working-renter base with shorter leases.
- Market conditions: 115 active listings in the ZIP; 172 units permitted in Oswego County in 2024 (27 in 5+ unit buildings).
Forward outlook
- In year one you build about $3k of equity ($276 loan paydown + $3k appreciation (6.8% local appreciation)).
- Oswego County population projected at -23% by 2050 — secular population decline; favor cash flow + early exit over multi-decade hold.
- At projected returns (6.8% appreciation + 3.0% rent growth), your $11k cash investment doubles in ~1 year — after that, you're playing with house money.
- By year 10, paydown + projected appreciation supports a ~$32k cash-out refi (75% LTV) — recoverable capital for the next deal without selling this one.
Negotiation context
- Only 5 days on market — expect competitive offers; lowballing is unlikely to land.
Risks & watch-outs
- Watch-outs: property tax is 3.6% of price.
Questions for the listing agent
- Built in 1975 — when were the roof, HVAC, electrical panel, plumbing, and water heater last replaced?
- Property tax is high relative to price — has the assessment been appealed recently, and will the sale trigger a re-assessment?
- Is there a deadline driving the sale (1031 exchange, divorce, estate, relocation)? That informs how much negotiation room exists.
- Schools are D-rated, which usually means shorter tenancies and higher turnover. Who's the typical renter profile here, and what's been the actual vacancy rate?
- Crime grade is F in this area — have there been break-ins, vandalism, or insurance claims at this property in the last 3 years? What carrier currently insures it and at what premium?
- What's the average days-on-market for RENTAL listings here right now (not sales)? A rising rental-DOM trend means longer vacancies and softer asking-rent achievability than the comps imply.
- What's the recent tenant-quality profile in this submarket — average credit score on applications, eviction rate, late-payment / NSF rate, and stable-employment percentage? A property-management company in the area should have these aggregated.
- How much new for-sale + rental construction is in the pipeline within 1–3 miles? Heavy new supply typically softens prices + rents 12–24 months out; constrained supply supports both.
Investment metrics
- 1% rule
- 4.09% ✓
- Cap rate
- 34.64%
- Cash-on-cash
- 101.25%
- DSCR
- 5.51
- GRM
- 2.0
CMA / ARV
No comps found within radius.
Projected returns pro-forma
6.75% appreciation · 3.0% rent growth · sell at horizon
- IRR
- —
- Equity multiple
- 7.57×
- Total profit
- $73,420
- Equity at exit
- $26,990
- IRR
- —
- Equity multiple
- 16.10×
- Total profit
- $168,696
- Equity at exit
- $50,681
Cash invested: $11,172 (down + closing). Projections, not guarantees.
Landlord ↔ Tenant lean methodology
- Overall (STATE)
- 15 Strongly Tenant-Friendly
- State New York
- 15 Strongly Tenant-Friendly · D+10
- County
- — inherits STATE
- City
- — inherits STATE
ZIP-level market 13069
- Home prices YoY
- 2.3%
- Active inventory
- 115
- Price-to-rent
- 2.0×
Monthly cashflow live
- Estimated rent
- $1,632 medium interval (Pro) →
- Mortgage (P&I)
- −$209
- Tax from tax record
- −$121 /mo · $1,452/yr
- Insurance
- −$17
- HOA
- −$0
- Vacancy / Maint / Mgmt
- −$343
- Net cashflow
- $943
Break-even live
UW: 25.0% down · 7.5% · 30yr · 1.5% tax · 5.0% vac · 8.0% maint · 8.0% mgmt
Financing live
Cash to close
- Down payment
- $9,975
- Closing costs
- $1,197
- Reserves months
- —
- Total cash needed
- —
Loan-product check · same deal, 3 products live
Conventional
25% down · 7.5% · 30yr
- Down + closing
- —
- Monthly P&I
- —
- Monthly cashflow
- —
- DSCR
- —
- Eligible?
- —
Personal DTI + credit; lowest rate.
DSCR
20% down · 8.5% · 30yr
- Down + closing
- —
- Monthly P&I
- —
- Monthly cashflow
- —
- DSCR
- —
- Eligible?
- —
No personal income docs; deal must DSCR.
Hard money
10% down · 12.0% · 12mo
- Down + closing
- —
- Monthly P&I
- —
- Monthly cashflow
- —
- DSCR
- —
- Eligible?
- —
Short-term bridge; refi at stabilization.
Listing history 3 events
-
2026-05-06status Pending 525-char remark
-
2026-05-01$39,900 Active 525-char remark
-
2005-09-12soldstatus $62,000
ⓘ Source: listings_history table (triggers on properties + properties_extension) + one-shot
backfill from property_details.listing_events for pre-trigger history.
Tax reassessment forecast NY · Partial reset (capped growth)
- Current annual tax
- $1,452 · $121/mo
- Projected year-2 tax
- $1,452 · $121/mo
- Expected delta
- $0/yr ($0/mo · 0.0%)
ⓘ Screening estimate from a state-policy table — verify with the county assessor before closing.
Climate risk First Street
- Flood 1/10 Low FEMA zone X (unshaded) · 0% chance over 30 yrs
- Wildfire 3/10 Moderate
- Heat 2/10 Low 7 d/yr ≥94°F today · 16 d/yr by 30 yrs out
- Wind 1/10 Low 0% chance of damaging wind over 30 yrs
- Air quality 2/10 Low 1 unhealthy d/yr today · 1 by 30 yrs out
Nearby sold comps map
Loading sold comps map…
Walkable amenities ~0.75 mi
Loading nearby amenities…
Taxation est. · year 1
- Rental income
- $19,587
- − Mortgage interest
- −$2,235
- − Property taxes
- −$1,452
- − Insurance
- −$200
- − Repairs & maintenance
- −$1,567
- − Management
- −$1,567
- − Depreciation
- −$1,161
- Taxable income
- $11,407
- Est. tax owed @ 24.0%
- −$2,738
- After-tax cash flow
- $8,575/yr
For passive investors: Depreciation is non-cash, so a rental often shows a tax loss while cash-flowing — sheltering income. Rental losses are passive: they offset passive income freely, and up to $25,000/yr can offset ordinary (W-2) income if you actively participate and your MAGI is under $100k (phasing out to $0 by $150k); unused losses carry forward. On sale, claimed depreciation is recaptured at up to 25%, and gains may owe capital-gains tax (a 1031 exchange can defer both). Figures are a year-1 estimate at your 24.0% rate — not tax advice; consult a CPA.
Schools (NCES district)
- District
- Fulton City School District
- NCES district ID
- 3611700
- Math proficiency
- 29% ▼ -11.00%
- Reading proficiency
- 43% ▲ 5.00%
- Median HH income
- $43,337
- Composite
- 30.49/100
- National rank
- #6220
- State rank
- #554 of 590 in NY
Livability — Fulton
- Score
- 61/100
- State rank
- #907
- US rank
- #17723
Category grades
Schools grade is shown separately in the Schools card above.
Census & demographics
- Population (ZIP)
- 23,176
Population outlook (Oswego County) Hauer SSP2
- Today (2025)
- 114,465 people
- By 2030
- 109,968 · -3.9%
- By 2040
- 99,205 · -13.3%
- By 2050
- 87,979 · -23.1%
- By 2075
- 65,100 · -43.1%
- By 2100
- 47,117 · -58.8%
Race, ethnicity, and origin ACS 2023
- Neighborhood character
- Predominantly White (93%)
- Race & ethnicity
- White 93% Hispanic / Latino 4% Two or more races 3%
- Common ancestry
- Lithuanian 6% Romanian 6% Iranian 2%
- Foreign-born
- 2% · Canada
- Languages at home
- 96% English-only · Spanish 2% German/W. Germanic 1%
Political lean MEDSL · Oswego
- 2024 margin
- Strong R (+24.2) · D 37.9% · R 62.1%
- 2008→2024 swing
- -26.6pp toward R · 2008: 2.5pp · 2024: -24.2pp
- All cycles
- 2024: R+24.2 2020: R+20.2 2016: R+23.2 2012: D+7.9 2008: D+2.5
Not yet ingested
- Civics
- —
Market trends
- HPI YoY
- ▲ 6.75%
- Current HPI
- 304.443
- Rent YoY
- —
- Metro
- —
- State GDP YoY
- ▲ 2.60%
- F500 in state
- 92
Industry mix (Fortune 500 HQ in NY)
| Industry | F500 HQs | Revenue |
|---|---|---|
| Financial Services | 10 | $950B |
|
||
| Consumer Goods | 9 | $162B |
|
||
| Insurance | 4 | $225B |
|
||
| Telecommunications | 2 | $144B |
|
||
| Pharmaceuticals | 2 | $112B |
|
||
| Media / Entertainment | 2 | $69B |
|
||
Price history
-43.5% since first listed4 events — show timeline
- 2026-06-12 Sold (MLS) $35,000 CNYIS
- 2026-05-06 Pending — CNYIS
- 2026-05-01 Listed $39,900 CNYIS
- 2005-09-12 Sold (Public Records) $62,000 Public Records
Property tax history
-5.1%/yrLatest (2025): $1,452 · -0.7% YoY. Source: county tax records.
Cash-flow waterfall
monthlySold comps — $/sqft
last 12 mo · ≤1 miLoading sold comps…