533 NW Avon Ave · Port St. Lucie, FL
Flood risk 1/10 · Minimal
- FEMA flood zone
- X (unshaded)
- Chance of flooding over 30 yrs
- 0.0%
- Est. flood insurance / yr
- $507 – $1,088
Fire risk 1/10 · Minimal
- Est. fire insurance / yr
- $947 – $1,759
Heat risk 10/10 · Severe
- Hot days now (above 106°F)
- 7 days/yr
- Hot days in 30 yrs
- 23 days/yr
Wind risk 10/10 · Severe
- Chance of severe wind over 30 yrs
- 99.0%
Air-quality risk 1/10 · Minimal
- Unhealthy air days now
- 0 days/yr
- Unhealthy air days in 30 yrs
- 0 days/yr
Risk factors via First Street. Map © Google.
Why this score? — see what drove the C grade
The composite is a weighted blend of 9 inputs, each scored 0–100. Each bar is that input's sub-score; the figure is the points it added to the 100-point composite (weight × sub-score).
- Cash flow +19.5/30.0
- ARV discount +15.0/15.0
- DSCR +6.2/10.0
- 1% rule +5.1/10.0
- Schools +3.7/10.0
- Rent growth +2.9/5.0
- Livability +2.5/5.0
- Condition / age +2.5/5.0
- Appreciation +0.0/10.0
$259,000
🖨 Deal sheet 📄 Offer letter ✓ Due diligence
Listing remarks MLS
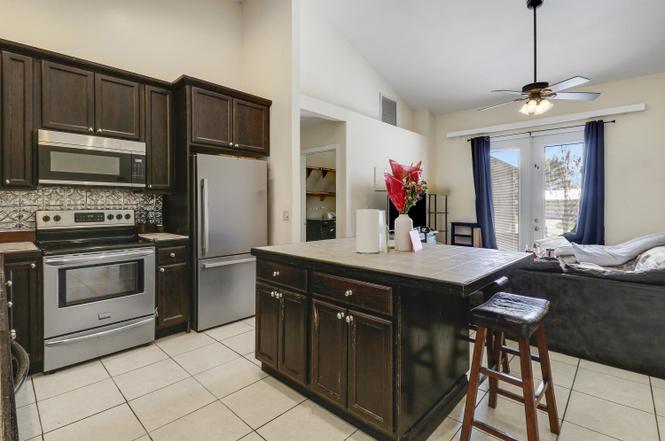
''Old World Feel'' in this warm, inviting 3 bedroom, 2 bath, 2 car garage home in a quiet neighborhood. Has a rich-looking kitchen with tall cabinets, recessed lights and newer stainless appliances. The master bath has a unique, luxurious antique tub. Tile and wood laminate flooring and a well manicured private backyard oasis which can accommodate your own pool. Large back patio.
Key facts
- 2 garage spots
- Built 1993
- Listed 45 days
Neighborhood map
What this means for you Summary
Snapshot
- This is a 3-bed/2.0-bath single-family listed at $259k.
Deal economics
- At list price, monthly cash flow is $296 ($4k/yr) — positive.
- The deal already cash-flows at list — no discount required.
- Meets the 1% rule at list price ($3k rent vs $259k).
- Recommended offer: $251k (3.0% below list) — sets the bar for market timing.
- Cap rate 7.7% vs local median 3.9% in Port St. Lucie — top-decile yield for the area; either an underpriced asset or a hidden risk that comps aren't pricing in. Stress-test before assuming the spread holds.
Location & tenants
- Location reads: area grade C — affects rentability + tenant quality, not the cash-flow math above.
- St. Lucie (urban): math 40% / reading 48% proficiency, ranked #51 of 73 in FL (top 70%) — families likely to look elsewhere, expect single-tenant / working-renter base with shorter leases.
- Market conditions: Rents rising (+1.5%/yr); 358 active listings in the ZIP; 33 comparable units currently listed for rent nearby; rentals at typical pace (median 21d on market — plan ~3-4 weeks tenant-placement turnaround); solid renter incomes; 4,868 units permitted in St. Lucie County in 2024 (268 in 5+ unit buildings).
- This rent runs 42% of the median local income ($75k/yr) — at the standard rent-burdened threshold; future hikes will face affordability resistance.
Forward outlook
- Local home prices are declining (-3.0%/yr); year-one equity from $2k of loan paydown is wiped out by about $8k of value loss. Plan a longer hold.
- St. Lucie County population projected at +20% by 2050 — long-run rental-demand tailwind backs the buy-and-hold thesis.
Negotiation context
- It's been on market 45 days — a 3% lower offer ($251k) is reasonable based on typical stale-listing flexibility.
- 4 sale attempts since 15y ago with the ask held roughly flat each time — persistent listings suggest the price (not the market) is what's stuck; bring a comps-based counter.
- Current owner paid $200k; 30% above their basis — modest negotiation headroom, anchor on the comps not their cost.
Risks & watch-outs
- Climate carrying-cost: severe wind risk, 99% chance of damaging wind over 30y; extreme-heat days projected 7→23/yr by 2055 (HVAC capex compounding) — expect insurance premiums to compound above CPI over the hold.
Questions for the listing agent
- It's been on market 45 days. Have you received any prior offers? Is the seller open to a 3% concession, seller financing, or rate buy-down credit?
- Is there a deadline driving the sale (1031 exchange, divorce, estate, relocation)? That informs how much negotiation room exists.
- What's the average days-on-market for RENTAL listings here right now (not sales)? A rising rental-DOM trend means longer vacancies and softer asking-rent achievability than the comps imply.
- What's the recent tenant-quality profile in this submarket — average credit score on applications, eviction rate, late-payment / NSF rate, and stable-employment percentage? A property-management company in the area should have these aggregated.
- How much new for-sale + rental construction is in the pipeline within 1–3 miles? Heavy new supply typically softens prices + rents 12–24 months out; constrained supply supports both.
Investment metrics
- 1% rule
- 1.01% ✓
- Cap rate
- 7.66%
- Cash-on-cash
- 4.90%
- DSCR
- 1.22
- GRM
- 8.3
CMA / ARV
- ARV (on-the-fly)
- $313,956
- Comps found
- 12
Show comp detail 12 sales within ~0.75 mi
| Address | Dist | Beds/Ba | Sqft | Sold | Price | $/sf | Match |
|---|---|---|---|---|---|---|---|
| 533 NW Avon Ave | 0.00mi | 3/2.0 | 1,292 (0%) | 1mo | $240,000 | $186 | 99 |
| 550 SW Prima Vista Blvd | 0.30mi | 3/2.0 | 1,406 (+9%) | 1mo | $313,600 | $223 | 70 |
| 118 NW Carmelite St | 0.52mi | 3/2.0 | 1,290 (-0%) | 10mo | $350,000 | $271 | 68 |
| 385 SW Violet Ave | 0.51mi | 3/2.0 | 1,334 (+3%) | 11mo | $300,500 | $225 | 62 |
| 397 NW Biltmore St | 0.67mi | 3/2.0 | 1,244 (-4%) | 4mo | $335,000 | $269 | 59 |
| 331 NW Dearman St | 0.40mi | 3/2.0 | 1,480 (+15%) | 1mo | $359,000 | $243 | 56 |
| 626 SW Cynthia St | 0.59mi | 3/2.0 | 1,173 (-9%) | 3mo | $290,000 | $247 | 55 |
| 335 NW Marion Ave | 0.39mi | 3/2.0 | 1,416 (+10%) | 13mo | $352,500 | $249 | 54 |
| 325 NW Rebecca Ave | 0.73mi | 3/2.0 | 1,352 (+5%) | 7mo | $281,500 | $208 | 52 |
| 462 SW Peach St | 0.57mi | 3/2.0 | 1,165 (-10%) | 8mo | $278,999 | $239 | 50 |
| 401 NW Ferris Dr | 0.54mi | 2/2.0 (-1) | 1,184 (-8%) | 10mo | $280,000 | $236 | 47 |
| 726 NW Placid Ave | 0.74mi | 3/2.0 | 1,125 (-13%) | 3mo | $326,742 | $290 | 42 |
Match score weights: distance 35% · size 25% · config 20% · recency 20%. Top-matched comps best support the ARV.
Projected returns pro-forma
-3.0% appreciation · 1.53% rent growth · sell at horizon
- IRR
- -10.3%
- Equity multiple
- 0.63×
- Total profit
- $-26,901
- Equity at exit
- $38,618
- IRR
- -3.1%
- Equity multiple
- 0.80×
- Total profit
- $-14,224
- Equity at exit
- $22,394
Cash invested: $72,520 (down + closing). Projections, not guarantees.
Landlord ↔ Tenant lean methodology
- Overall (STATE)
- 87 Strongly Landlord-Friendly
- State Florida
- 87 Strongly Landlord-Friendly · R+3
- County
- — inherits STATE
- City
- — inherits STATE
ZIP-level market 34983
- Home prices YoY
- -33.9%
- Rents YoY
- 1.5%
- Active inventory
- 358
- Price-to-rent
- 8.3×
Monthly cashflow live
- Estimated rent
- $2,615 high interval (Pro) →
- Mortgage (P&I)
- −$1,358
- Tax from tax record
- −$304 /mo · $3,642/yr
- Insurance
- −$108
- HOA
- −$0
- Vacancy / Maint / Mgmt
- −$549
- Net cashflow
- $296
Break-even live
UW: 25.0% down · 7.5% · 30yr · 1.5% tax · 5.0% vac · 8.0% maint · 8.0% mgmt
Financing live
Cash to close
- Down payment
- $64,750
- Closing costs
- $7,770
- Reserves months
- —
- Total cash needed
- —
Loan-product check · same deal, 3 products live
Conventional
25% down · 7.5% · 30yr
- Down + closing
- —
- Monthly P&I
- —
- Monthly cashflow
- —
- DSCR
- —
- Eligible?
- —
Personal DTI + credit; lowest rate.
DSCR
20% down · 8.5% · 30yr
- Down + closing
- —
- Monthly P&I
- —
- Monthly cashflow
- —
- DSCR
- —
- Eligible?
- —
No personal income docs; deal must DSCR.
Hard money
10% down · 12.0% · 12mo
- Down + closing
- —
- Monthly P&I
- —
- Monthly cashflow
- —
- DSCR
- —
- Eligible?
- —
Short-term bridge; refi at stabilization.
Rent comps 33 comps
| Address | Beds | Baths | Sqft | Rent | $/sqft | DOM | Units | Dist |
|---|---|---|---|---|---|---|---|---|
| 507 NW Billiar Ave Port St Lucie, FL | 3.0 | 2.0 | 1249 | $2,350 | $1.88 | 21d | 1 | 0.16mi |
| 532 SW Buswell Ave Port Saint Lucie, FL | 4.0 | 2.5 | 1629 | $2,750 | $1.69 | 23d | 1 | 0.30mi |
| 365 NW Hibiscus St Port Saint Lucie, FL | 4.0 | 2.0 | 1714 | $4,000 | $2.33 | 23d | 1 | 0.31mi |
| 385 NW Broadview St Port Saint Lucie, FL | 2.0 | 2.0 | 1500 | $2,300 | $1.53 | 23d | 1 | 0.37mi |
| 351 SW Buswell Ave Port Saint Lucie, FL | 2.0 | 2.0 | 1234 | $2,200 | $1.78 | 14d | 1 | 0.37mi |
| 134 NW Peach St Port Saint Lucie, FL | 3.0 | 2.0 | 1862 | $2,050 | $1.10 | 14d | 1 | 0.43mi |
| 367 NW Aurora St Port Saint Lucie, FL | 2.0 | 1.0 | 940 | $2,050 | $2.18 | 14d | 1 | 0.44mi |
| 632 SW Granadeer St Port Saint Lucie, FL | 3.0 | 2.0 | 1618 | $2,495 | $1.54 | 14d | 1 | 0.56mi |
| 325 NW Ferris Dr Port Saint Lucie, FL | 2.0 | 2.0 | 1100 | $1,900 | $1.73 | 14d | 1 | 0.66mi |
| 581 NW Cornell Ave Port Saint Lucie, FL | 3.0 | 2.0 | 1035 | $2,600 | $2.51 | 23d | 1 | 0.77mi |
| 456 SW Prado Ave Port Saint Lucie, FL | 3.0 | 2.0 | 1376 | $2,100 | $1.53 | 14d | 1 | 0.85mi |
| 216 NE Mainsail St Port Saint Lucie, FL | 3.0 | 2.0 | 1516 | $2,550 | $1.68 | 21d | 1 | 0.87mi |
| 642 SW Bolin Ct Port Saint Lucie, FL | 3.0 | 2.0 | 1166 | $2,150 | $1.84 | 21d | 1 | 0.88mi |
| 554 SW Lakehurst Dr Port Saint Lucie, FL | 3.0 | 2.0 | 1054 | $2,100 | $1.99 | 14d | 1 | 0.90mi |
| 574 NW Bayshore Blvd Port Saint Lucie, FL | 4.0 | 2.0 | 1806 | $2,850 | $1.58 | 23d | 1 | 0.91mi |
| 116 Prima Vista Blvd Unit A Port St. Lucie, FL | 3.0 | 1.0 | 1314 | $2,600 | $1.98 | 23d | 1 | 0.94mi |
| 738 SW Ravenswood Ln Port St Lucie, FL | 2.0 | 2.0 | 894 | $2,100 | $2.35 | 21d | 1 | 0.95mi |
| 160 NE Bracken Rd Port Saint Lucie, FL | 3.0 | 2.0 | 1166 | $2,200 | $1.89 | 21d | 1 | 1.04mi |
| 160 NE Bracken Rd Port Saint Lucie, FL | 3.0 | 2.0 | 1166 | $2,200 | $1.89 | 23d | 1 | 1.04mi |
| 151 SE Castana Ct Port Saint Lucie, FL | 3.0 | 2.0 | 1382 | $2,500 | $1.81 | 23d | 1 | 1.05mi |
| 702 NW Orchid St Port Saint Lucie, FL | 3.0 | 2.0 | 1499 | $3,500 | $2.33 | 23d | 1 | 1.09mi |
| 185 NW Willow Grove Ave Port Saint Lucie, FL | 2.0 | 2.0 | 1539 | $2,600 | $1.69 | 23d | 1 | 1.09mi |
| 628 NW Venetto Ct Port Saint Lucie, FL | 2.0 | 2.0 | 1819 | $2,650 | $1.46 | 23d | 1 | 1.15mi |
| 628 NW Venetto Ct Port Saint Lucie, FL | 2.0 | 2.0 | 1819 | $2,550 | $1.40 | 14d | 1 | 1.15mi |
| 107 SE Lucero Dr Port Saint Lucie, FL | 3.0 | 2.0 | 1326 | $2,150 | $1.62 | 21d | 1 | 1.19mi |
| 213 NE Prima Vista Blvd Port Saint Lucie, FL | 2.0 | 1.0 | 1012 | $2,000 | $1.98 | 23d | 1 | 1.19mi |
| 201 NE Midfield Ln Port Saint Lucie, FL | 2.0 | 2.0 | 1389 | $2,500 | $1.80 | 23d | 1 | 1.21mi |
| 1189 SW Broadview St Port Saint Lucie, FL | 2.0 | 2.0 | 988 | $2,200 | $2.23 | 14d | 1 | 1.22mi |
| 154 SE Selva Ct Port Saint Lucie, FL | 3.0 | 2.0 | 1503 | $3,000 | $2.00 | 23d | 1 | 1.27mi |
| 6956 NW Jorgensen Rd Port Saint Lucie, FL | 3.0 | 2.0 | 1358 | $2,500 | $1.84 | 14d | 1 | 1.31mi |
| 160 SE Duxbury Ave Port Saint Lucie, FL | 2.0 | 2.5 | 1521 | $2,700 | $1.78 | 23d | 1 | 1.40mi |
| 121 SE Juper Ave Port Saint Lucie, FL | 2.0 | 2.0 | 1450 | $2,500 | $1.72 | 23d | 1 | 1.42mi |
| 336 SE Tranquilla Ave Port Saint Lucie, FL | 3.0 | 3.0 | 1412 | $2,700 | $1.91 | 14d | 1 | 1.49mi |
Listing history 17 events
-
2026-04-27status Pending
-
2026-03-24price $259,000
-
2026-03-13$269,000 Active
-
2019-12-03soldstatus $199,500
-
2019-11-22soldstatus $199,500 Closed 382-char remark
Show marketing remark (382 chars)
''Old World Feel'' in this warm, inviting 3 bedroom, 2 bath, 2 car garage home in a quiet neighborhood. Has a rich-looking kitchen with tall cabinets, recessed lights and newer stainless appliances. The master bath has a unique, luxurious antique tub. Tile and wood laminate flooring and a well manicured private backyard oasis which can accommodate your own pool. Large back patio.
-
2019-10-25status Pending 382-char remark
Show marketing remark (382 chars)
''Old World Feel'' in this warm, inviting 3 bedroom, 2 bath, 2 car garage home in a quiet neighborhood. Has a rich-looking kitchen with tall cabinets, recessed lights and newer stainless appliances. The master bath has a unique, luxurious antique tub. Tile and wood laminate flooring and a well manicured private backyard oasis which can accommodate your own pool. Large back patio.
-
2019-10-06historical Contingent 382-char remark
Show marketing remark (382 chars)
''Old World Feel'' in this warm, inviting 3 bedroom, 2 bath, 2 car garage home in a quiet neighborhood. Has a rich-looking kitchen with tall cabinets, recessed lights and newer stainless appliances. The master bath has a unique, luxurious antique tub. Tile and wood laminate flooring and a well manicured private backyard oasis which can accommodate your own pool. Large back patio.
-
2019-09-30$199,500 Active 382-char remark
Show marketing remark (382 chars)
''Old World Feel'' in this warm, inviting 3 bedroom, 2 bath, 2 car garage home in a quiet neighborhood. Has a rich-looking kitchen with tall cabinets, recessed lights and newer stainless appliances. The master bath has a unique, luxurious antique tub. Tile and wood laminate flooring and a well manicured private backyard oasis which can accommodate your own pool. Large back patio.
-
2012-05-24soldstatus $84,500
-
2012-05-21soldstatus $84,500 106-char remark
Show marketing remark (106 chars)
Nice 3/2/2 in quiet neighborhood. Newly painted and landscaped. Must see! Not a short sale or foreclosure.
-
2012-05-07historical 106-char remark
Show marketing remark (106 chars)
Nice 3/2/2 in quiet neighborhood. Newly painted and landscaped. Must see! Not a short sale or foreclosure.
-
2012-05-03$89,000 106-char remark
Show marketing remark (106 chars)
Nice 3/2/2 in quiet neighborhood. Newly painted and landscaped. Must see! Not a short sale or foreclosure.
-
2012-04-19soldstatus $60,000
-
2012-04-17soldstatus $60,000
-
2012-02-12historical
-
2011-04-11$65,137
-
1994-01-03soldstatus $64,800
ⓘ Source: listings_history table (triggers on properties + properties_extension) + one-shot
backfill from property_details.listing_events for pre-trigger history.
Tax reassessment forecast FL · Resets to sale price
- Current annual tax
- $3,642 · $304/mo
- Projected year-2 tax
- $3,642 · $304/mo
- Expected delta
- $0/yr ($0/mo · 0.0%)
ⓘ Screening estimate from a state-policy table — verify with the county assessor before closing.
Climate risk First Street
- Flood 1/10 Low FEMA zone X (unshaded) · 0% chance over 30 yrs
- Wildfire 1/10 Low
- Heat 10/10 Extreme 7 d/yr ≥106°F today · 23 d/yr by 30 yrs out
- Wind 10/10 Extreme 99% chance of damaging wind over 30 yrs
- Air quality 1/10 Low 0 unhealthy d/yr today · 0 by 30 yrs out
Nearby sold comps map
Loading sold comps map…
Walkable amenities ~0.75 mi
Loading nearby amenities…
Taxation est. · year 1
- Rental income
- $31,377
- − Mortgage interest
- −$14,508
- − Property taxes
- −$3,642
- − Insurance
- −$1,295
- − Repairs & maintenance
- −$2,510
- − Management
- −$2,510
- − Depreciation
- −$7,535
- Taxable loss
- −$623
- Est. tax savings @ 24.0%
- +$149
- After-tax cash flow
- $3,702/yr
For passive investors: Depreciation is non-cash, so a rental often shows a tax loss while cash-flowing — sheltering income. Rental losses are passive: they offset passive income freely, and up to $25,000/yr can offset ordinary (W-2) income if you actively participate and your MAGI is under $100k (phasing out to $0 by $150k); unused losses carry forward. On sale, claimed depreciation is recaptured at up to 25%, and gains may owe capital-gains tax (a 1031 exchange can defer both). Figures are a year-1 estimate at your 24.0% rate — not tax advice; consult a CPA.
Schools (NCES district)
- District
- St. Lucie
- NCES district ID
- 1201770
- Math proficiency
- 40% ▼ -11.00%
- Reading proficiency
- 48% ▼ -4.00%
- Median HH income
- $44,737
- Composite
- 37.28/100
- National rank
- #4449
- State rank
- #51 of 73 in FL
Livability — Port St. Lucie
No livability data for this city. (Only ~50 U.S. cities are tracked.)
Census & demographics
- Census place
- Port St. Lucie, FL
- County
- Saint Lucie County · 337,150 people
- City population
- 221,051
- Metro
- Port St. Lucie, FL
- Population (ZIP)
- 49,001
- Household income
- $75,489
- Rent vs Own
- Severe rent burden
- 843.0
Population outlook (St. Lucie County) Hauer SSP2
- Today (2025)
- 338,016 people
- By 2030
- 355,687 · +5.2%
- By 2040
- 385,521 · +14.1%
- By 2050
- 406,106 · +20.1%
- By 2075
- 441,054 · +30.5%
- By 2100
- 436,885 · +29.2%
Race, ethnicity, and origin ACS 2023
- Neighborhood character
- Diverse neighborhood (Simpson 0.65)
- Race & ethnicity
- White 51% Hispanic / Latino 23% Black 18% Two or more races 13% Asian 3%
- Hispanic origin (detail)
- Mexican 3% Puerto Rican 9% Cuban 3%
- Common ancestry
- Hispanic 3% Romanian 2% Italian 1%
- Foreign-born
- 19% · Canada, Guatemala, Jamaica
- Languages at home
- 74% English-only · Spanish 15% French/Haitian/Cajun 4% Other Indo-European 2%
Political lean MEDSL · St. Lucie
- 2024 margin
- Lean R (+9.1) · D 45.1% · R 54.2%
- 2008→2024 swing
- -21.2pp toward R · 2008: 12.1pp · 2024: -9.1pp
- All cycles
- 2024: R+9.1 2020: R+1.6 2016: R+2.5 2012: D+7.9 2008: D+12.1
Not yet ingested
- Civics
- —
Market trends
- HPI YoY
- ▼ -209.28%
- Current HPI
- 407.6341
- Rent YoY
- ▲ 1.53%
- Metro
- Port St. Lucie, FL
- State GDP YoY
- ▲ 3.28%
- F500 in state
- 36
Industry mix (Fortune 500 HQ in FL)
| Industry | F500 HQs | Revenue |
|---|---|---|
| Industrial Technology | 2 | $29B |
|
||
| Insurance | 2 | $17B |
|
||
| Retail | 1 | $60B |
|
||
| Technology Distribution | 1 | $58B |
|
||
| Homebuilding | 1 | $35B |
|
||
| Technology Manufacturing | 1 | $35B |
|
||
Price history
+299.7% since first listed17 events — show timeline
- 2026-04-27 Pending — Beaches MLS
- 2026-03-24 Price Changed $259,000 Beaches MLS
- 2026-03-13 Listed $269,000 Beaches MLS
- 2019-12-03 Sold (Public Records) $199,500 Public Records
- 2019-11-22 Sold (MLS) $199,500 Beaches MLS
- 2019-10-25 Pending — Beaches MLS
- 2019-10-06 Contingent — Beaches MLS
- 2019-09-30 Listed $199,500 Beaches MLS
- 2012-05-24 Sold (Public Records) $84,500 Public Records
- 2012-05-21 Sold (MLS) $84,500 Beaches MLS
- 2012-05-07 Listing Removed — Beaches MLS
- 2012-05-03 Listed $89,000 Beaches MLS
- 2012-04-19 Sold (Public Records) $60,000 Public Records
- 2012-04-17 Sold (MLS) $60,000 Beaches MLS
- 2012-02-12 Listing Removed — Beaches MLS
- 2011-04-11 Listed $65,137 Beaches MLS
- 1994-01-03 Sold (Public Records) $64,800 Public Records
Property tax history
+13.1%/yrLatest (2025): $3,642 · +3.5% YoY. Source: county tax records.
Cash-flow waterfall
monthlySold comps — $/sqft
last 12 mo · ≤1 miLoading sold comps…