2221 Grass Lake # 160 & 161 Rd Unit 160 & 161 · Freeman, MI
Flood risk No data
- FEMA flood zone
- —
- Chance of flooding over 30 yrs
- —
- Est. flood insurance / yr
- —
Fire risk No data
- Est. fire insurance / yr
- —
Heat risk No data
- Hot days now (above threshold)
- —
- Hot days in 30 yrs
- —
Wind risk No data
- Chance of severe wind over 30 yrs
- —
Air-quality risk No data
- Unhealthy air days now
- —
- Unhealthy air days in 30 yrs
- —
Risk factors via First Street. Map © Google.
Why this score? — see what drove the C- grade
The composite is a weighted blend of 9 inputs, each scored 0–100. Each bar is that input's sub-score; the figure is the points it added to the 100-point composite (weight × sub-score).
- Cash flow +22.0/30.0
- ARV discount +7.5/15.0
- DSCR +7.0/10.0
- 1% rule +6.8/10.0
- Rent growth +2.5/5.0
- Livability +2.5/5.0
- Schools +2.4/10.0
- Condition / age +2.2/5.0
- Appreciation +0.0/10.0
$65,900
🖨 Deal sheet (PDF) 📄 Offer letter ✓ Due diligence
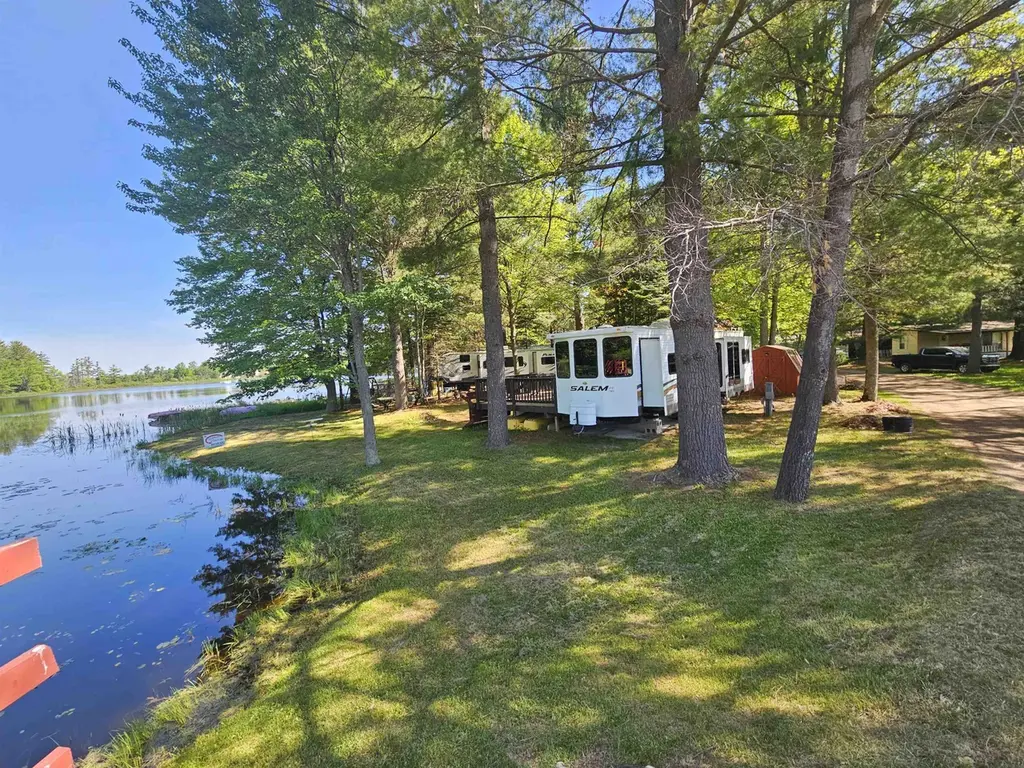
Listing remarks
Great Location on Grass Lake in Sandy Shores Resort. 2 waterfront lots, 87+ feet on the water with electric, water and holding tank. 2009 Forest River Salem camper with 3 slides , 2 flat screen tvs, fireplace, reverse osmosis system, full size refrigerator, range with oven. 26x13 deck with railing for the kids or pets, pop-out canopy for shade too. Enjoy the eagles fishing out front or the loons singing in evening. Sale includes all furnishings including picnic tables, pontoon paddle boat, kayak , lawn care equipment . Truly a turn key offering! Bath house nearby for guests to shower. Boat over to the park and build sand castles, fish or use play ground equipment . Priced to sell!
Key facts
- Pop-out canopy
- Waterfront lots
- 26x13 deck
Tags
Property features AI
Finance
- Other: Acreage: 0.06; Frontage: 87'
- HOA & community: Sandy Shores association with yearly fee; Association fee: $675 per year; Association covers lawn maintenance and water/sewer; Community amenities: grounds maintenance, park, playground, beach area
Exterior
- Parking: Gravel road access; private road with association
- Utilities: Electric: Circuit breakers; Heat fuel: Electric and LP/Propane; Water: Community well; Sewer: Holding tank
- Home design: Single-wide manufactured home (1 story) built in 2009; Units/addresses: #160 & 161
- Construction: Slab foundation
- Exterior features: Aluminum exterior; Deck; Shed; Treed site; Lake view / waterfront on Grass Lake; Subdivision / platted
Interior
- Kitchen: Range/oven; Refrigerator; Kitchen approx. 10 x 10
- Bedrooms: Two bedrooms on the main level (approx. 10 x 6 and 10 x 9)
- Bathrooms: One full bathroom on the main level (approx. 4 x 4)
- Heating & cooling: Forced air heating; Cooling: Other
- Interior features: Furnished; Gas fireplace
- Laundry & utility: Water heater: Gas
Neighborhood map
What this means for you Summary
Snapshot
- This is a 2-bed/1.0-bath condo listed at $66k. Condition is rated fair.
Deal economics
- At list price, monthly cash flow is $105 ($1k/yr) — positive.
- The deal already cash-flows at list — no discount required.
- Meets the 1% rule at list price ($780 rent vs $66k).
- Recommended offer: $65k (1.5% below list) — sets the bar for market timing.
Location & tenants
- Location reads: area grade C — affects rentability + tenant quality, not the cash-flow math above.
- Farwell Area Schools (town): math 24% / reading 34% proficiency, ranked #388 of 540 in MI (top 72%) — low school quality limits family demand, transient renter base, plan for 1-2y turnover; 62% free/reduced lunch — lower-income household profile, screen leases tightly.
- Market conditions: 246 active listings in the ZIP; 77 units permitted in Clare County in 2024 (0 in 5+ unit buildings).
Forward outlook
- Local home prices are declining (-3.0%/yr); year-one equity from $456 of loan paydown is wiped out by about $2k of value loss. Plan a longer hold.
- Clare County population projected at -20% by 2050 — secular population decline; favor cash flow + early exit over multi-decade hold.
Negotiation context
- It's been on market 16 days — a 2% lower offer ($65k) is reasonable based on typical stale-listing flexibility.
- 2 sale attempts with the ask held roughly flat each time — persistent listings suggest the price (not the market) is what's stuck; bring a comps-based counter.
Questions for the listing agent
- Have any recent inspections been done? Can we get a copy of the seller's disclosures and any deferred-maintenance estimates?
- What does the HOA fee cover, when was the last increase, and are there any pending special assessments or reserve-fund shortfalls?
- Any open or pending special assessments — roof, HVAC, plumbing, elevator, façade? What's the per-unit balance and payoff schedule, and is the seller paying it off at close or rolling it to the buyer?
- Is there a deadline driving the sale (1031 exchange, divorce, estate, relocation)? That informs how much negotiation room exists.
- What's the average days-on-market for RENTAL listings here right now (not sales)? A rising rental-DOM trend means longer vacancies and softer asking-rent achievability than the comps imply.
- What's the recent tenant-quality profile in this submarket — average credit score on applications, eviction rate, late-payment / NSF rate, and stable-employment percentage? A property-management company in the area should have these aggregated.
- How much new apartment / multifamily construction is in the pipeline within 1–3 miles? Heavy new supply (>2% of stock underway) typically softens rents 12–24 months out; light construction supports rent growth.
Investment metrics
- 1% rule
- 1.18% ✓
- Cap rate
- 8.21%
- Cash-on-cash
- 6.84%
- DSCR
- 1.30
- GRM
- 7.0
CMA / ARV
No comps found within radius.
Projected returns pro-forma
-3.0% appreciation · 3.0% rent growth · sell at horizon
- IRR
- -5.7%
- Equity multiple
- 0.79×
- Total profit
- $-3,937
- Equity at exit
- $9,826
- IRR
- 4.0%
- Equity multiple
- 1.29×
- Total profit
- $5,381
- Equity at exit
- $5,698
Cash invested: $18,452 (down + closing). Projections, not guarantees.
Landlord ↔ Tenant lean methodology
- Overall (STATE)
- 62 Landlord-Friendly
- State Michigan
- 62 Landlord-Friendly · EVEN
- County
- — inherits STATE
- City
- — inherits STATE
ZIP-level market 48625
- Home prices YoY
- -25.5%
- Active inventory
- 246
- Price-to-rent
- 7.0×
Monthly cashflow live
- Estimated rent
- $780 medium interval (Pro) →
- Mortgage (P&I)
- −$346
- Tax est. 1.5%
- −$82 /mo · $988/yr
- Insurance
- −$27
- HOA
- −$56
- Vacancy / Maint / Mgmt
- −$164
- Net cashflow
- $105
Break-even live
Sensitivity live
| Price | -10% $151 | -5% $128 | +0% $105 | +5% $82 | +10% $60 |
|---|---|---|---|---|---|
| Rent | -10% $43 | -5% $74 | +0% $105 | +5% $136 | +10% $167 |
| Rate | -1.0pp $138 | -0.5pp $122 | base $105 | +0.5pp $88 | +1.0pp $71 |
UW: 25.0% down · 7.5% · 30yr · 1.5% tax · 5.0% vac · 8.0% maint · 8.0% mgmt
Financing live
Cash to close
- Down payment
- $16,475
- Closing costs
- $1,977
- Reserves months
- —
- Total cash needed
- —
Loan-product check · same deal, 3 products live
Conventional
25% down · 7.5% · 30yr
- Down + closing
- —
- Monthly P&I
- —
- Monthly cashflow
- —
- DSCR
- —
- Eligible?
- —
Personal DTI + credit; lowest rate.
DSCR
20% down · 8.5% · 30yr
- Down + closing
- —
- Monthly P&I
- —
- Monthly cashflow
- —
- DSCR
- —
- Eligible?
- —
No personal income docs; deal must DSCR.
Hard money
10% down · 12.0% · 12mo
- Down + closing
- —
- Monthly P&I
- —
- Monthly cashflow
- —
- DSCR
- —
- Eligible?
- —
Short-term bridge; refi at stabilization.
HOA detail condo
- Monthly dues
- $56 · $672/yr
- Likely covers
- waterelectriclandscaping
- Assessments
- None detected in remarks — confirm with the listing agent.
Listing history 12 events
-
2026-06-21days on market $65,900 Active 16 DOM
-
2026-06-18days on market $65,900 Active 14 DOM
-
2026-06-17days on market $65,900 Active 13 DOM
-
2026-06-16days on market $65,900 Active 12 DOM
-
2026-06-15days on market $65,900 Active 11 DOM
-
2026-06-13days on market $65,900 Active 9 DOM
-
2026-06-12days on market $65,900 Active 8 DOM
-
2026-06-09days on market $65,900 Active 5 DOM
-
2026-06-08days on market $65,900 Active 4 DOM
-
2026-06-07days on market $65,900 Active 3 DOM
-
2026-06-07remarks 692-char remark
-
2026-06-07$65,900 Active 2 DOM
ⓘ Source: listings_history table (triggers on properties + properties_extension) + one-shot
backfill from property_details.listing_events for pre-trigger history.
Nearby sold comps map
Loading sold comps map…
Walkable amenities ~0.75 mi
Loading nearby amenities…
Taxation est. · year 1
- Rental income
- $9,365
- − Mortgage interest
- −$3,691
- − Property taxes
- −$988
- − Insurance
- −$330
- − Repairs & maintenance
- −$749
- − Management
- −$749
- − HOA
- −$672
- − Depreciation
- −$1,917
- Taxable income
- $268
- Est. tax owed @ 24.0%
- −$64
- After-tax cash flow
- $1,197/yr
For passive investors: Depreciation is non-cash, so a rental often shows a tax loss while cash-flowing — sheltering income. Rental losses are passive: they offset passive income freely, and up to $25,000/yr can offset ordinary (W-2) income if you actively participate and your MAGI is under $100k (phasing out to $0 by $150k); unused losses carry forward. On sale, claimed depreciation is recaptured at up to 25%, and gains may owe capital-gains tax (a 1031 exchange can defer both). Figures are a year-1 estimate at your 24.0% rate — not tax advice; consult a CPA.
Condition & rehab AI · 12 photos
This 2009 Forest River Salem camper is in fair condition with cosmetic repairs needed. It offers a great location on Grass Lake with waterfront access and amenities. Paint and minor repairs would significantly enhance its curb appeal and value.
Repairs flagged
- Minor deck railings — Worn and slightly damaged
- Minor deck boards — Worn and slightly damaged
- Minor canopy — Worn and slightly damaged
Value-add opportunities
- Both Paint exterior — Enhances curb appeal and resale value
- Both Replace deck railings — Improves safety and enhances curb appeal
- Both Replace deck boards — Improves safety and enhances curb appeal
- Both Replace canopy — Improves safety and enhances curb appeal
Renovation cost estimate screening
| Repair item | Severity | Est. cost |
|---|---|---|
| deck railings · Worn and slightly damaged | Minor | $500–3,000 |
| deck boards · Worn and slightly damaged | Minor | $500–3,000 |
| canopy · Worn and slightly damaged | Minor | $500–3,000 |
| Total estimated repair cost · 3 items | $1,500–9,000 |
Value-add ROI direction
- Both Paint exterior — Enhances curb appeal and resale value ↑
- Both Replace deck railings — Improves safety and enhances curb appeal ↑
- Both Replace deck boards — Improves safety and enhances curb appeal ↑
- Both Replace canopy — Improves safety and enhances curb appeal ↑
ⓘ Cost ranges are severity-bucket heuristics (US national rule-of-thumb). Get contractor quotes + a written scope before underwriting a rehab budget.
Schools (NCES district)
- District
- Farwell Area Schools
- NCES district ID
- 2614100
- Math proficiency
- 24% ▼ -8.00%
- Reading proficiency
- 34% ▼ -8.00%
- Median HH income
- $36,696
- Composite
- 24.07/100
- National rank
- #7760
- State rank
- #388 of 540 in MI
Livability — Freeman
No livability data for this city. (Only ~50 U.S. cities are tracked.)
Census & demographics
- Population (ZIP)
- 12,939
Population outlook (Clare County) Hauer SSP2
- Today (2025)
- 29,283 people
- By 2030
- 28,199 · -3.7%
- By 2040
- 25,722 · -12.2%
- By 2050
- 23,372 · -20.2%
- By 2075
- 18,569 · -36.6%
- By 2100
- 14,320 · -51.1%
Race, ethnicity, and origin ACS 2023
- Neighborhood character
- Predominantly White (93%)
- Race & ethnicity
- White 93% Two or more races 4% Hispanic / Latino 3%
- Common ancestry
- Romanian 6% Lithuanian 4% Scotch-Irish 2%
- Foreign-born
- 0%
- Languages at home
- 99% English-only · Spanish 1% German/W. Germanic 1%
Political lean MEDSL · Clare
- 2024 margin
- Solid R (+37.6) · D 30.5% · R 68.1% · Other 1.4%
- 2008→2024 swing
- -42.4pp toward R · 2008: 4.8pp · 2024: -37.6pp
- All cycles
- 2024: R+37.6 2020: R+34.8 2016: R+31.8 2012: R+4.8 2008: D+4.8
Not yet ingested
- Civics
- —
Market trends
- HPI YoY
- ▼ -80.38%
- Current HPI
- 234.9586
- Rent YoY
- —
- Metro
- —
- State GDP YoY
- ▲ 1.37%
- F500 in state
- 28
Industry mix (Fortune 500 HQ in MI)
| Industry | F500 HQs | Revenue |
|---|---|---|
| Automotive Parts | 3 | $48B |
|
||
| Automotive | 2 | $372B |
|
||
| Chemicals | 1 | $45B |
|
||
| Automotive Retail | 1 | $29B |
|
||
| Healthcare / Medical Devices | 1 | $23B |
|
||
| Automotive Technology | 1 | $20B |
|
||
Price history
-20.1% since first listed4 events — show timeline
- 2026-06-04 Listed $65,900 MiRealSource-MiMLS
- 2025-10-30 Listing Removed — MiRealSource-MiMLS
- 2025-07-01 Price Changed $75,000 MiRealSource-MiMLS
- 2025-04-29 Listed $82,500 MiRealSource-MiMLS
Cash-flow waterfall
monthlySold comps — $/sqft
last 12 mo · ≤1 miLoading sold comps…