 5-Plex
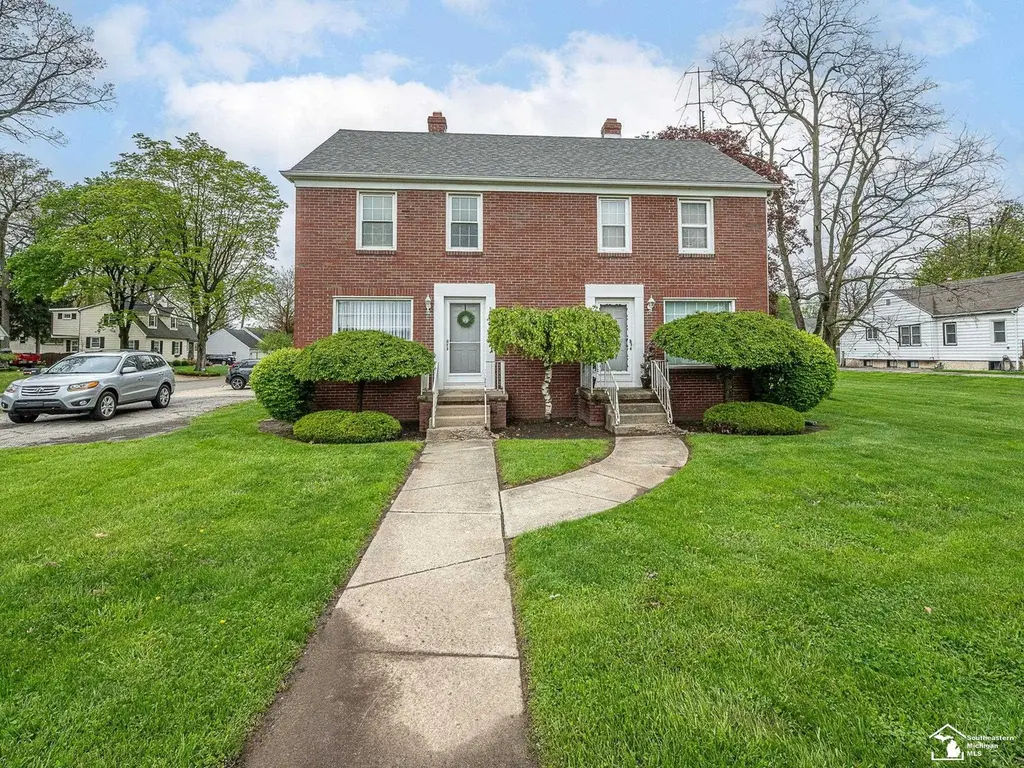
1049/1057 N Monroe St · Monroe, MI
Flood risk 1/10 · Minimal
- FEMA flood zone
- X (unshaded)
- Chance of flooding over 30 yrs
- 0.0%
- Est. flood insurance / yr
- $473 – $860
Fire risk 1/10 · Minimal
- Est. fire insurance / yr
- $784 – $1,456
Heat risk 3/10 · Minor
- Hot days now (above 101°F)
- 7 days/yr
- Hot days in 30 yrs
- 15 days/yr
Wind risk 2/10 · Minimal
- Chance of severe wind over 30 yrs
- —
Air-quality risk 4/10 · Minor
- Unhealthy air days now
- 3 days/yr
- Unhealthy air days in 30 yrs
- 6 days/yr
Risk factors via First Street. Map © Google.
Why this score? — see what drove the C+ grade
The composite is a weighted blend of 9 inputs, each scored 0–100. Each bar is that input's sub-score; the figure is the points it added to the 100-point composite (weight × sub-score).
- Cash flow +30.0/30.0
- 1% rule +10.0/10.0
- DSCR +10.0/10.0
- Livability +4.2/5.0
- Schools +3.0/10.0
- Rent growth +2.5/5.0
- Condition / age +2.5/5.0
- ARV discount +0.0/15.0
- Appreciation +0.0/10.0
$249,900
🖨 Deal sheet (PDF) 📄 Offer letter ✓ Due diligence
Multi-family units
County records classify this as Multi-Family (2-4 Unit). Listing-text estimate: 5 units. estimate disagrees with records
Listing remarks MLS
Well-maintained side-by-side full brick duplex . Maintenance-free exterior with a beautiful yard and plenty of parking. Conveniently location, close to amenities. A great investment or owner-occupant opportunity! Each unit is approx. 912 sq ft. 2 bedrooms, 1 full bath. Each unit has its own full basement with laundry hook up. Convenient location, nice spacious corner lot. Each unit has its own utilities hook up. City certs up to date and current. 1049 has a new furnace installed 2/2026 Some interior pics have been virtually staged.
Key facts
- 3,485 sq ft lot
- Built 1943
- Listed 10 days
Property features AI
Finance
- Other: Publicly maintained road; Zoned residential; Lot approximately 80 x 51 (0.08 acres); Subdivision: ST MARYS MANOR; Cross street: N. Monroe St / Stockton
- Financial info: Two units each reporting $800 actual rent
Exterior
- Parking: Assigned parking
- Utilities: Public water; Public sewer
- Home design: Residential income property; Multifamily; Two levels; Facing information not provided; Entry level not provided
- Construction: Block foundation
- Exterior features: Front porch; Shed(s)
Interior
- Kitchen: Oven; Refrigerator; Range
- Bathrooms: 2 full bathrooms
- Heating & cooling: Central air conditioning; Forced air heating (natural gas); Separate meters
- Interior features: Gas water heater; Oven; Refrigerator; Range; Block basement
Neighborhood map
What this means for you Summary
Snapshot
- This is a 5 × 2-bed/1.0-bath units multifamily listed at $250k.
Deal economics
- At list price, monthly cash flow is $2k ($29k/yr) — positive. Per door: $487/mo.
- The deal already cash-flows at list — no discount required.
- Meets the 1% rule at list price ($5k rent vs $250k).
- Cap rate 18.0% vs local median 4.0% in Monroe — top-decile yield for the area; either an underpriced asset or a hidden risk that comps aren't pricing in. Stress-test before assuming the spread holds.
Location & tenants
- Location reads 83/100 on livability (#51 in MI, #1,034 nationally) — a professional / high-income tenant draw. Strengths: commute A+, cost of living A+, housing A+; Watch: employment C-, crime D+, amenities D+.
- Monroe Public Schools (suburban): math 24% / reading 47% proficiency, ranked #278 of 540 in MI (top 52%) — families likely to look elsewhere, expect single-tenant / working-renter base with shorter leases.
- Market conditions: 123 active listings in the ZIP; 2 comparable units currently listed for rent nearby; 264 units permitted in Monroe County in 2024 (40 in 5+ unit buildings).
- At $5,082/mo this rent would consume 90% of the median local household income ($68k/yr) (locally 828% of renters already pay >50% of income on rent) — very limited rent-growth headroom before tenants either downsize or default.
Forward outlook
- Local home prices are declining (-3.0%/yr); year-one equity from $2k of loan paydown is wiped out by about $7k of value loss. Plan a longer hold.
- Monroe County population projected at -20% by 2050 — secular population decline; favor cash flow + early exit over multi-decade hold.
- At projected returns (-3.0% appreciation + 3.0% rent growth), your $70k cash investment doubles in ~3 years — after that, you're playing with house money.
Negotiation context
- Only 10 days on market — expect competitive offers; lowballing is unlikely to land.
- 3 sale attempts since 19y ago with the ask held roughly flat each time — persistent listings suggest the price (not the market) is what's stuck; bring a comps-based counter.
- Current owner paid $217k; 15% above their basis — modest negotiation headroom, anchor on the comps not their cost.
Risks & watch-outs
- Watch-outs: built in 1943 — expect roof / HVAC / electrical / plumbing capex.
Questions for the listing agent
- Can we see the unit-by-unit rent roll, current vacancy, and any below-market leases? What's the average tenancy length?
- What capital expenditures (roof, boiler, parking lot, exteriors) have been made in the last 5 years, and what's planned in the next 2?
- Built in 1943 — when were the roof, HVAC, electrical panel, plumbing, and water heater last replaced?
- Is there a deadline driving the sale (1031 exchange, divorce, estate, relocation)? That informs how much negotiation room exists.
- Schools are D-rated, which usually means shorter tenancies and higher turnover. Who's the typical renter profile here, and what's been the actual vacancy rate?
- Crime grade is D in this area — have there been break-ins, vandalism, or insurance claims at this property in the last 3 years? What carrier currently insures it and at what premium?
- What's the average days-on-market for RENTAL listings here right now (not sales)? A rising rental-DOM trend means longer vacancies and softer asking-rent achievability than the comps imply.
- What's the recent tenant-quality profile in this submarket — average credit score on applications, eviction rate, late-payment / NSF rate, and stable-employment percentage? A property-management company in the area should have these aggregated.
- How much new apartment / multifamily construction is in the pipeline within 1–3 miles? Heavy new supply (>2% of stock underway) typically softens rents 12–24 months out; light construction supports rent growth.
Investment metrics
- 1% rule
- 2.03% ✓
- Cap rate
- 17.98%
- Cash-on-cash
- 41.75%
- DSCR
- 2.86
- GRM
- 4.1
CMA / ARV
- ARV (median comp)
- $183,451
- List price
- $249,900
- Delta
- 36.22%
- Verdict
- OVERPRICED
- Comps
- 13 within 1.0 mi
Show comp detail 1 sale within ~0.75 mi
| Address | Dist | Beds/Ba | Sqft | Sold | Price | $/sf | Match |
|---|---|---|---|---|---|---|---|
| 919 Michigan Ave | 0.60mi | 3/3.0 (+1) | 1,560 (-14%) | 18mo | $177,500 | $114 | 20 |
Match score weights: distance 35% · size 25% · config 20% · recency 20%. Top-matched comps best support the ARV.
Projected returns pro-forma
-3.0% appreciation · 3.0% rent growth · sell at horizon
- IRR
- 38.4%
- Equity multiple
- 2.64×
- Total profit
- $114,557
- Equity at exit
- $37,261
- IRR
- 44.9%
- Equity multiple
- 5.28×
- Total profit
- $299,370
- Equity at exit
- $21,607
Cash invested: $69,972 (down + closing). Projections, not guarantees.
Landlord ↔ Tenant lean methodology
- Overall (STATE)
- 62 Landlord-Friendly
- State Michigan
- 62 Landlord-Friendly · EVEN
- County
- — inherits STATE
- City
- — inherits STATE
ZIP-level market 48162
- Active inventory
- 123
- Price-to-rent
- 20.5×
Monthly cashflow live
- Estimated rent
- $5,082 medium interval (Pro) →
- Mortgage (P&I)
- −$1,311
- Tax from tax record
- −$165 /mo · $1,986/yr
- Insurance
- −$104
- HOA
- −$0
- Vacancy / Maint / Mgmt
- −$1,067
- Net cashflow
- $2,435
Break-even live
Sensitivity live
| Price | -10% $2,576 | -5% $2,505 | +0% $2,435 | +5% $2,364 | +10% $2,293 |
|---|---|---|---|---|---|
| Rent | -10% $2,033 | -5% $2,234 | +0% $2,435 | +5% $2,635 | +10% $2,836 |
| Rate | -1.0pp $2,561 | -0.5pp $2,498 | base $2,435 | +0.5pp $2,370 | +1.0pp $2,304 |
5-unit breakdown (identical units grouped — click to expand)
| Units | Beds | Baths | Est. rent |
|---|---|---|---|
| 5× units | 2 | 1 | $5,080 |
| #1 | 2 | 1 | $1,016 |
| #2 | 2 | 1 | $1,016 |
| #3 | 2 | 1 | $1,016 |
| #4 | 2 | 1 | $1,016 |
| #5 | 2 | 1 | $1,016 |
| Total (5 units) | $5,082 | ||
UW: 25.0% down · 7.5% · 30yr · 1.5% tax · 5.0% vac · 8.0% maint · 8.0% mgmt
Financing live
Cash to close
- Down payment
- $62,475
- Closing costs
- $7,497
- Reserves months
- —
- Total cash needed
- —
Loan-product check · same deal, 3 products live
Conventional
25% down · 7.5% · 30yr
- Down + closing
- —
- Monthly P&I
- —
- Monthly cashflow
- —
- DSCR
- —
- Eligible?
- —
Personal DTI + credit; lowest rate.
DSCR
20% down · 8.5% · 30yr
- Down + closing
- —
- Monthly P&I
- —
- Monthly cashflow
- —
- DSCR
- —
- Eligible?
- —
No personal income docs; deal must DSCR.
Hard money
10% down · 12.0% · 12mo
- Down + closing
- —
- Monthly P&I
- —
- Monthly cashflow
- —
- DSCR
- —
- Eligible?
- —
Short-term bridge; refi at stabilization.
Rent comps 2 comps
| Address | Beds | Baths | Sqft | Rent | $/sqft | DOM | Units | Dist |
|---|---|---|---|---|---|---|---|---|
| 1267 Huber Dr Monroe, MI | 2.0 | 2.0 | 1830 | $1,900 | $1.04 | 44d | 1 | 0.96mi |
| 1318 Frank Dr Monroe, MI | 3.0 | 1.0–2.5 | 1300 | $1,645 | $1.27 | 5d | 6 | 1.28mi |
Listing history 6 events
-
2026-05-15status Pending 538-char remark
Show marketing remark (538 chars)
Well-maintained side-by-side full brick duplex . Maintenance-free exterior with a beautiful yard and plenty of parking. Conveniently location, close to amenities. A great investment or owner-occupant opportunity! Each unit is approx. 912 sq ft. 2 bedrooms, 1 full bath. Each unit has its own full basement with laundry hook up. Convenient location, nice spacious corner lot. Each unit has its own utilities hook up. City certs up to date and current. 1049 has a new furnace installed 2/2026 Some interior pics have been virtually staged.
-
2026-05-05$249,900 Active 538-char remark
Show marketing remark (538 chars)
Well-maintained side-by-side full brick duplex . Maintenance-free exterior with a beautiful yard and plenty of parking. Conveniently location, close to amenities. A great investment or owner-occupant opportunity! Each unit is approx. 912 sq ft. 2 bedrooms, 1 full bath. Each unit has its own full basement with laundry hook up. Convenient location, nice spacious corner lot. Each unit has its own utilities hook up. City certs up to date and current. 1049 has a new furnace installed 2/2026 Some interior pics have been virtually staged.
-
2009-07-23historical
-
2007-11-19$775
ⓘ Source: listings_history table (triggers on properties + properties_extension) + one-shot
backfill from property_details.listing_events for pre-trigger history.
Tax reassessment forecast MI · Partial reset (capped growth)
- Current annual tax
- $1,986 · $165/mo
- Projected year-2 tax
- $2,917 · $243/mo
- Expected delta
- +$931/yr (+$78/mo · 46.9%)
ⓘ Screening estimate from a state-policy table — verify with the county assessor before closing.
Climate risk First Street
- Flood 1/10 Low FEMA zone X (unshaded) · 0% chance over 30 yrs
- Wildfire 1/10 Low
- Heat 3/10 Moderate 7 d/yr ≥101°F today · 15 d/yr by 30 yrs out
- Wind 2/10 Low
- Air quality 4/10 Moderate 3 unhealthy d/yr today · 6 by 30 yrs out
Nearby sold comps map
Loading sold comps map…
Walkable amenities ~0.75 mi
Loading nearby amenities…
Taxation est. · year 1
- Rental income
- $60,984
- − Mortgage interest
- −$13,998
- − Property taxes
- −$1,986
- − Insurance
- −$1,250
- − Repairs & maintenance
- −$4,879
- − Management
- −$4,879
- − Depreciation
- −$7,270
- Taxable income
- $26,723
- Est. tax owed @ 24.0%
- −$6,414
- After-tax cash flow
- $22,802/yr
For passive investors: Depreciation is non-cash, so a rental often shows a tax loss while cash-flowing — sheltering income. Rental losses are passive: they offset passive income freely, and up to $25,000/yr can offset ordinary (W-2) income if you actively participate and your MAGI is under $100k (phasing out to $0 by $150k); unused losses carry forward. On sale, claimed depreciation is recaptured at up to 25%, and gains may owe capital-gains tax (a 1031 exchange can defer both). Figures are a year-1 estimate at your 24.0% rate — not tax advice; consult a CPA.
Schools (NCES district)
- District
- Monroe Public Schools
- NCES district ID
- 2624150
- Math proficiency
- 24% ▲ 3.00%
- Reading proficiency
- 47% ▲ 12.00%
- Median HH income
- $46,437
- Composite
- 30.33/100
- National rank
- #6269
- State rank
- #278 of 540 in MI
Livability — Monroe
- Score
- 83/100
- State rank
- #51
- US rank
- #1034
Category grades
Schools grade is shown separately in the Schools card above.
Census & demographics
- Census place
- Monroe, MI
- County
- Monroe County · 54,460 people
- City population
- 54,460
- Metro
- Monroe, MI
- Population (ZIP)
- 28,156
- Household income
- $67,876
- Rent vs Own
- Severe rent burden
- 828.0
Population outlook (Monroe County) Hauer SSP2
- Today (2025)
- 144,439 people
- By 2030
- 140,033 · -3.1%
- By 2040
- 128,408 · -11.1%
- By 2050
- 115,024 · -20.4%
- By 2075
- 87,273 · -39.6%
- By 2100
- 63,110 · -56.3%
Race, ethnicity, and origin ACS 2023
- Neighborhood character
- Predominantly White (90%)
- Race & ethnicity
- White 90% Two or more races 4% Black 3% Hispanic / Latino 3%
- Common ancestry
- Lithuanian 7% Romanian 6% Slovak 2%
- Foreign-born
- 2% · Canada
- Languages at home
- 96% English-only · Spanish 1% Other Indo-European 1%
Political lean MEDSL · Monroe
- 2024 margin
- Strong R (+27.1) · D 35.7% · R 62.9% · Other 1.4%
- 2008→2024 swing
- -31.5pp toward R · 2008: 4.3pp · 2024: -27.1pp
- All cycles
- 2024: R+27.1 2020: R+22.6 2016: R+22.1 2012: D+1.0 2008: D+4.3
Not yet ingested
- Civics
- —
Market trends
- HPI YoY
- ▼ -171.11%
- Current HPI
- 138.1795
- Rent YoY
- —
- Metro
- Monroe, MI
- State GDP YoY
- ▲ 1.37%
- F500 in state
- 28
Industry mix (Fortune 500 HQ in MI)
| Industry | F500 HQs | Revenue |
|---|---|---|
| Automotive Parts | 3 | $48B |
|
||
| Automotive | 2 | $372B |
|
||
| Chemicals | 1 | $45B |
|
||
| Automotive Retail | 1 | $29B |
|
||
| Healthcare / Medical Devices | 1 | $23B |
|
||
| Automotive Technology | 1 | $20B |
|
||
Price history
-13.2% since first listed8 events — show timeline
- 2026-06-15 Sold (MLS) $217,000 MiRealSource-MiMLS
- 2026-06-15 Sold (MLS) $217,000 REALCOMP
- 2026-05-15 Pending — REALCOMP
- 2026-05-15 Pending — MiRealSource-MiMLS
- 2026-05-05 Listed $249,900 MiRealSource-MiMLS
- 2026-05-05 Listed $249,900 REALCOMP
- 2009-07-23 Listing Removed — MiRealSource-MiMLS
- 2007-11-19 Listed $775 MiRealSource-MiMLS
Property tax history
-2.7%/yrLatest (2025): $1,986 · -45.1% YoY. Source: county tax records.
Cash-flow waterfall
monthlySold comps — $/sqft
last 12 mo · ≤1 miLoading sold comps…