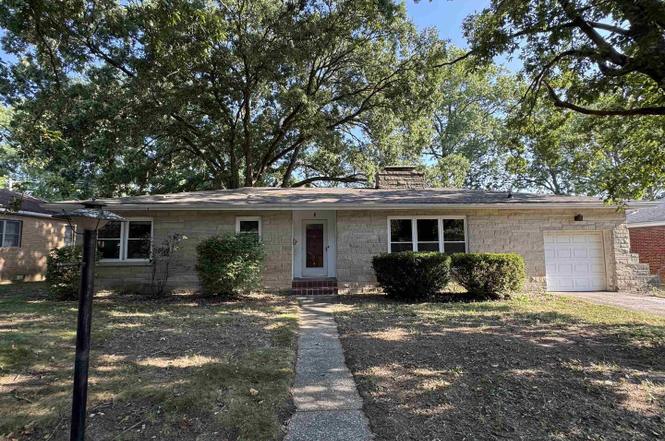
8 Northbrook Dr · Mount Vernon, IL
Flood risk 1/10 · Minimal
- FEMA flood zone
- X (unshaded)
- Chance of flooding over 30 yrs
- 0.0%
- Est. flood insurance / yr
- $473 – $860
Fire risk 1/10 · Minimal
- Est. fire insurance / yr
- $804 – $1,492
Heat risk 4/10 · Minor
- Hot days now (above 105°F)
- 7 days/yr
- Hot days in 30 yrs
- 20 days/yr
Wind risk 2/10 · Minimal
- Chance of severe wind over 30 yrs
- 2.0%
Air-quality risk 2/10 · Minimal
- Unhealthy air days now
- 0 days/yr
- Unhealthy air days in 30 yrs
- 1 days/yr
Risk factors via First Street. Map © Google.
Why this score? — see what drove the B- grade
The composite is a weighted blend of 9 inputs, each scored 0–100. Each bar is that input's sub-score; the figure is the points it added to the 100-point composite (weight × sub-score).
- Cash flow +30.0/30.0
- 1% rule +10.0/10.0
- DSCR +10.0/10.0
- ARV discount +8.3/15.0
- Livability +3.5/5.0
- Rent growth +2.5/5.0
- Condition / age +2.5/5.0
- Schools +1.2/10.0
- Appreciation +0.0/10.0
$140,000
🖨 Deal sheet 📄 Offer letter ✓ Due diligence
Listing remarks
Welcome to 8 Northbrook Drive in Mt. Vernon! This charming 3-bedroom, 1.5-bath home offers 1,425 sq. ft. of living space and is nestled in a quiet neighborhood. Built in 1950, the home combines classic character with modern updates, including a roof that's only a year old and a newer water heater (approx. 3 years). Inside, you'll find a spacious living room with laminate flooring and a cozy gas fireplace (never used) and a tile-floor kitchen with all appliances staying. The large laundry room also includes a washer & dryer for added convenience. The home offers three bedrooms, 1.5 baths, and an attached one-car garage with opener.
Key facts
- 9,375 sq ft lot
- Garage
- Built 1950
Property features AI
Exterior
- Parking: Attached garage (1 space); parking lot access; total 1 parking space
- Utilities: Public water; Public sewer; 100-amp electric service
- Home design: Detached single-family home; One-story
- Construction: Built 71–80 years ago (built before 1978); Vinyl siding over frame construction; Block foundation
- Exterior features: Wooded lot; Lot smaller than 0.25 acre
Interior
- Kitchen: Kitchen on main level
- Bedrooms: 3 bedrooms (all on main level)
- Flooring: Laminate flooring in bedrooms, dining room, kitchen, living room; Carpet in laundry room
- Bathrooms: 1 full bathroom; 1 half bathroom; Master bedroom has a private bath
- Heating & cooling: Electric and natural gas heating; Central air conditioning
- Interior features: Crawl space basement with egress window; Gas water heater
- Laundry & utility: Main-level laundry room
Neighborhood map
What this means for you Summary
Snapshot
- This is a 3-bed/1.5-bath single-family listed at $140k.
Deal economics
- At list price, monthly cash flow is $619 ($7k/yr) — positive.
- The deal already cash-flows at list — no discount required.
- Meets the 1% rule at list price ($2k rent vs $140k).
- Recommended offer: $138k (1.5% below list) — sets the bar for market timing.
- Cap rate 11.6% vs local median 5.3% in Mount Vernon — top-decile yield for the area; either an underpriced asset or a hidden risk that comps aren't pricing in. Stress-test before assuming the spread holds.
Location & tenants
- Location reads 69/100 on livability (#413 in IL) — a middle-class / working-renter tenant base. Strengths: cost of living A+, housing A+, health & safety A+; Watch: schools F, amenities F, commute F.
- Mt Vernon Twp Hsd 201 (town): math 13% / reading 16% proficiency, ranked #532 of 620 in IL (top 86%) — low school quality limits family demand, transient renter base, plan for 1-2y turnover.
- Market conditions: 186 active listings in the ZIP; 1 comparable units currently listed for rent nearby; 6 units permitted in Jefferson County in 2024 (0 in 5+ unit buildings).
Forward outlook
- Local home prices are declining (-3.0%/yr); year-one equity from $968 of loan paydown is wiped out by about $4k of value loss. Plan a longer hold.
- Jefferson County population projected at -14% by 2050 — secular population decline; favor cash flow + early exit over multi-decade hold.
- At projected returns (-3.0% appreciation + 3.0% rent growth), your $39k cash investment doubles in ~7 years — after that, you're playing with house money.
Negotiation context
- It's been on market 25 days — a 2% lower offer ($138k) is reasonable based on typical stale-listing flexibility.
- 7 sale attempts since 24y ago; this cycle's ask is 67% above the opening price — seller raised mid-cycle; expect resistance to lowballs.
- Current owner paid $75k; list at $140k implies a 87% gain — meaningful room to come down on a strong offer.
Risks & watch-outs
- Watch-outs: built in 1950 — expect roof / HVAC / electrical / plumbing capex.
Questions for the listing agent
- Built in 1950 — when were the roof, HVAC, electrical panel, plumbing, and water heater last replaced?
- Is there a deadline driving the sale (1031 exchange, divorce, estate, relocation)? That informs how much negotiation room exists.
- Schools are F-rated, which usually means shorter tenancies and higher turnover. Who's the typical renter profile here, and what's been the actual vacancy rate?
- What's the average days-on-market for RENTAL listings here right now (not sales)? A rising rental-DOM trend means longer vacancies and softer asking-rent achievability than the comps imply.
- What's the recent tenant-quality profile in this submarket — average credit score on applications, eviction rate, late-payment / NSF rate, and stable-employment percentage? A property-management company in the area should have these aggregated.
- How much new for-sale + rental construction is in the pipeline within 1–3 miles? Heavy new supply typically softens prices + rents 12–24 months out; constrained supply supports both.
Investment metrics
- 1% rule
- 1.50% ✓
- Cap rate
- 11.60%
- Cash-on-cash
- 18.95%
- DSCR
- 1.84
- GRM
- 5.5
CMA / ARV
- ARV (on-the-fly)
- $142,500
- Comps found
- 12
Show comp detail 12 sales within ~0.75 mi
| Address | Dist | Beds/Ba | Sqft | Sold | Price | $/sf | Match |
|---|---|---|---|---|---|---|---|
| 2 Lincoln Dr | 0.11mi | 4/2.0 (+1) | 1,600 (+12%) | 0mo | $212,000 | $133 | 67 |
| 1901 E Richview Rd | 0.24mi | 3/1.0 | 1,228 (-14%) | 1mo | $90,000 | $73 | 63 |
| 9 Homestead Dr | 0.68mi | 3/1.5 | 1,432 (+0%) | 8mo | $124,500 | $87 | 61 |
| 625 N 12th St | 0.51mi | 3/2.0 | 1,300 (-9%) | 2mo | $119,900 | $92 | 58 |
| 1126 Oakland Ave | 0.54mi | 3/1.0 | 1,296 (-9%) | 2mo | $135,000 | $104 | 56 |
| 702 Magnolia Ave | 0.37mi | 3/1.0 | 1,248 (-12%) | 11mo | $165,000 | $132 | 51 |
| 700 N 12th St | 0.50mi | 2/0.5 (-1) | 1,344 (-6%) | 12mo | $118,000 | $88 | 48 |
| 9087 N Taft Ln | 0.73mi | 3/2.0 | 1,456 (+2%) | 16mo | $150,000 | $103 | 47 |
| 5 Edgewood Rd | 0.74mi | 3/1.5 | 1,280 (-10%) | 9mo | $139,900 | $109 | 41 |
| 1018 Pace Ave | 0.71mi | 3/2.0 | 1,538 (+8%) | 13mo | $154,500 | $100 | 41 |
| 623 N 12th St | 0.52mi | 2/1.0 (-1) | 1,296 (-9%) | 16mo | $129,000 | $100 | 40 |
| 823 N 10th St | 0.72mi | 3/1.0 | 1,216 (-15%) | 0mo | $90,500 | $74 | 40 |
Match score weights: distance 35% · size 25% · config 20% · recency 20%. Top-matched comps best support the ARV.
Projected returns pro-forma
-3.0% appreciation · 3.0% rent growth · sell at horizon
- IRR
- 10.8%
- Equity multiple
- 1.43×
- Total profit
- $16,823
- Equity at exit
- $20,874
- IRR
- 19.9%
- Equity multiple
- 2.68×
- Total profit
- $65,744
- Equity at exit
- $12,105
Cash invested: $39,200 (down + closing). Projections, not guarantees.
Landlord ↔ Tenant lean methodology
- Overall (STATE)
- 43 Moderately Tenant-Leaning
- State Illinois
- 43 Moderately Tenant-Leaning · D+7
- County
- — inherits STATE
- City
- — inherits STATE
ZIP-level market 62864
- Active inventory
- 186
- Price-to-rent
- 5.5×
Monthly cashflow live
- Estimated rent
- $2,107 medium interval (Pro) →
- Mortgage (P&I)
- −$734
- Tax from tax record
- −$253 /mo · $3,035/yr
- Insurance
- −$58
- HOA
- −$0
- Vacancy / Maint / Mgmt
- −$442
- Net cashflow
- $619
Break-even live
UW: 25.0% down · 7.5% · 30yr · 1.5% tax · 5.0% vac · 8.0% maint · 8.0% mgmt
Financing live
Cash to close
- Down payment
- $35,000
- Closing costs
- $4,200
- Reserves months
- —
- Total cash needed
- —
Loan-product check · same deal, 3 products live
Conventional
25% down · 7.5% · 30yr
- Down + closing
- —
- Monthly P&I
- —
- Monthly cashflow
- —
- DSCR
- —
- Eligible?
- —
Personal DTI + credit; lowest rate.
DSCR
20% down · 8.5% · 30yr
- Down + closing
- —
- Monthly P&I
- —
- Monthly cashflow
- —
- DSCR
- —
- Eligible?
- —
No personal income docs; deal must DSCR.
Hard money
10% down · 12.0% · 12mo
- Down + closing
- —
- Monthly P&I
- —
- Monthly cashflow
- —
- DSCR
- —
- Eligible?
- —
Short-term bridge; refi at stabilization.
Rent comps 1 comps
| Address | Beds | Baths | Sqft | Rent | $/sqft | DOM | Units | Dist |
|---|---|---|---|---|---|---|---|---|
| 4201 Valley Forge Rd Mt Vernon, IL | 2.0 | 1.0 | 720 | $2,107 | $2.93 | 43d | 9 | 1.47mi |
Listing history 46 events
-
2026-06-18days on market $140,000 Active 25 DOM
-
2026-06-17days on market $140,000 Active 24 DOM
-
2026-06-16days on market $140,000 Active 23 DOM
-
2026-06-15days on market $140,000 Active 22 DOM
-
2026-06-13days on market $140,000 Active 20 DOM
-
2026-06-12days on market $140,000 Active 19 DOM
-
2026-06-09days on market $140,000 Active 16 DOM
-
2026-06-08days on market $140,000 Active 15 DOM
-
2026-06-07days on market $140,000 Active 14 DOM
-
2026-06-07days on market $140,000 Active 13 DOM
-
2026-06-04days on market $140,000 Active 10 DOM
-
2026-06-02days on market $140,000 Active 9 DOM
-
2026-06-01days on market $140,000 Active 8 DOM
-
2026-05-31days on market $140,000 Active 7 DOM
-
2026-05-31days on market $140,000 Active 6 DOM
-
2026-05-23historical
-
2026-05-23status Active
-
2026-02-22price
-
2026-02-22status Active
-
2026-02-20historical
-
2026-01-06historical
-
2025-12-17historical
-
2025-11-21Active
-
2025-11-18historical
-
2025-11-16historical
-
2025-10-09price
-
2025-08-20Active
-
2021-08-06historical
-
2021-08-06historical
-
2021-08-06historical
-
2021-08-06historical
-
2021-08-06historical
-
2021-08-06historical
-
2021-08-06historical
-
2017-04-07soldstatus $75,000
-
2017-04-07soldstatus $75,000
-
2017-04-07soldstatus $75,000
-
2017-02-15$83,700
-
2017-02-15$83,700
-
2009-12-22historical
-
2009-06-19historical
-
2002-09-06soldstatus $67,500
-
2002-07-19$70,000
-
2002-07-11historical
-
2002-04-09historical
-
2001-12-30historical
ⓘ Source: listings_history table (triggers on properties + properties_extension) + one-shot
backfill from property_details.listing_events for pre-trigger history.
Tax reassessment forecast IL · Partial reset (capped growth)
- Current annual tax
- $3,035 · $253/mo
- Projected year-2 tax
- $3,107 · $259/mo
- Expected delta
- +$71/yr (+$6/mo · 2.3%)
ⓘ Screening estimate from a state-policy table — verify with the county assessor before closing.
Climate risk First Street
- Flood 1/10 Low FEMA zone X (unshaded) · 0% chance over 30 yrs
- Wildfire 1/10 Low
- Heat 4/10 Moderate 7 d/yr ≥105°F today · 20 d/yr by 30 yrs out
- Wind 2/10 Low 2% chance of damaging wind over 30 yrs
- Air quality 2/10 Low 0 unhealthy d/yr today · 1 by 30 yrs out
Nearby sold comps map
Loading sold comps map…
Walkable amenities ~0.75 mi
Loading nearby amenities…
Taxation est. · year 1
- Rental income
- $25,284
- − Mortgage interest
- −$7,842
- − Property taxes
- −$3,035
- − Insurance
- −$700
- − Repairs & maintenance
- −$2,023
- − Management
- −$2,023
- − Depreciation
- −$4,073
- Taxable income
- $5,588
- Est. tax owed @ 24.0%
- −$1,341
- After-tax cash flow
- $6,088/yr
For passive investors: Depreciation is non-cash, so a rental often shows a tax loss while cash-flowing — sheltering income. Rental losses are passive: they offset passive income freely, and up to $25,000/yr can offset ordinary (W-2) income if you actively participate and your MAGI is under $100k (phasing out to $0 by $150k); unused losses carry forward. On sale, claimed depreciation is recaptured at up to 25%, and gains may owe capital-gains tax (a 1031 exchange can defer both). Figures are a year-1 estimate at your 24.0% rate — not tax advice; consult a CPA.
Schools (NCES district)
- District
- Mt Vernon Twp Hsd 201
- NCES district ID
- 1727360
- Math proficiency
- 13% ▼ -8.00%
- Reading proficiency
- 16% ▼ -8.00%
- Median HH income
- $38,188
- Composite
- 12.22/100
- National rank
- #9648
- State rank
- #532 of 620 in IL
Livability — Mount Vernon
- Score
- 69/100
- State rank
- #413
- US rank
- #8520
Category grades
Schools grade is shown separately in the Schools card above.
Census & demographics
- Census place
- Mount Vernon, IL
- Population (ZIP)
- 23,061
Population outlook (Jefferson County) Hauer SSP2
- Today (2025)
- 36,818 people
- By 2030
- 35,764 · -2.9%
- By 2040
- 33,649 · -8.6%
- By 2050
- 31,557 · -14.3%
- By 2075
- 26,055 · -29.2%
- By 2100
- 19,237 · -47.8%
Race, ethnicity, and origin ACS 2023
- Neighborhood character
- Predominantly White (83%)
- Race & ethnicity
- White 83% Black 8% Two or more races 6% Hispanic / Latino 3% Asian 1%
- Common ancestry
- Romanian 2% Slovak 2% Serbian 2%
- Foreign-born
- 2% · Canada
- Languages at home
- 97% English-only · Spanish 1% Tagalog/Filipino 1%
Political lean MEDSL · Jefferson
- 2024 margin
- Solid R (+47.8) · D 25.5% · R 73.3% · Other 1.3%
- 2008→2024 swing
- -37.0pp toward R · 2008: -10.7pp · 2024: -47.8pp
- All cycles
- 2024: R+47.8 2020: R+45.1 2016: R+43.2 2012: R+22.9 2008: R+10.7
Not yet ingested
- Civics
- —
Market trends
- HPI YoY
- ▼ -83.64%
- Current HPI
- 134.2669
- Rent YoY
- —
- Metro
- —
- State GDP YoY
- ▲ 1.59%
- F500 in state
- 60
Industry mix (Fortune 500 HQ in IL)
| Industry | F500 HQs | Revenue |
|---|---|---|
| Insurance | 4 | $201B |
|
||
| Consumer Goods | 4 | $87B |
|
||
| Industrial Machinery | 3 | $64B |
|
||
| Healthcare | 2 | $55B |
|
||
| Retail / Pharmacy | 1 | $148B |
|
||
| Agriculture / Food | 1 | $86B |
|
||
Price history
+7.1% since first listed31 events — show timeline
- 2026-05-23 Listing Removed — MRED as Distributed by MLS Grid
- 2026-05-23 Relisted — MRED as Distributed by MLS Grid
- 2026-02-22 Price Changed — MRED as Distributed by MLS Grid
- 2026-02-22 Relisted — MRED as Distributed by MLS Grid
- 2026-02-20 Listing Removed — MRED as Distributed by MLS Grid
- 2026-01-06 Listing Removed — RMLSA as Distributed by MLS Grid
- 2025-12-17 Listing Removed — MRED as Distributed by MLS Grid
- 2025-11-21 Listed — RMLSA as Distributed by MLS Grid
- 2025-11-18 Listing Removed — RMLSA as Distributed by MLS Grid
- 2025-11-16 Listing Removed — MRED as Distributed by MLS Grid
- 2025-10-09 Price Changed — RMLSA as Distributed by MLS Grid
- 2025-08-20 Listed — RMLSA as Distributed by MLS Grid
- 2021-08-06 Listing Removed — RMLSA as Distributed by MLS Grid
- 2021-08-06 Listing Removed — RMLSA as Distributed by MLS Grid
- 2021-08-06 Listing Removed — RMLSA as Distributed by MLS Grid
- 2021-08-06 Listing Removed — RMLSA as Distributed by MLS Grid
- 2021-08-06 Listing Removed — RMLSA as Distributed by MLS Grid
- 2021-08-06 Listing Removed — RMLSA as Distributed by MLS Grid
- 2021-08-06 Listing Removed — RMLSA as Distributed by MLS Grid
- 2017-04-07 Sold (Public Records) $75,000 Public Records
- 2017-04-07 Sold (MLS) $75,000 MRED as Distributed by MLS Grid
- 2017-04-07 Sold (MLS) $75,000 RMLSA as Distributed by MLS Grid
- 2017-02-15 Listed $83,700 MRED as Distributed by MLS Grid
- 2017-02-15 Listed $83,700 RMLSA as Distributed by MLS Grid
- 2009-12-22 Listing Removed — MRED as Distributed by MLS Grid
- 2009-06-19 Listing Removed — MRED as Distributed by MLS Grid
- 2002-09-06 Sold (MLS) $67,500 RMLSA as Distributed by MLS Grid
- 2002-07-19 Listed $70,000 RMLSA as Distributed by MLS Grid
- 2002-07-11 Listing Removed — MRED as Distributed by MLS Grid
- 2002-04-09 Listing Removed — MRED as Distributed by MLS Grid
- 2001-12-30 Listing Removed — MRED as Distributed by MLS Grid
Property tax history
+2.1%/yrLatest (2024): $3,035 · +9.5% YoY. Source: county tax records.
Cash-flow waterfall
monthlySold comps — $/sqft
last 12 mo · ≤1 miLoading sold comps…