 Multi-family
🌊 Lakefront
Multi-family
🌊 Lakefront
4556 Van Winkle Rd SW · Roanoke, VA
Flood risk 1/10 · Minimal
- FEMA flood zone
- X (unshaded)
- Chance of flooding over 30 yrs
- 0.0%
- Est. flood insurance / yr
- $473 – $860
Fire risk 1/10 · Minimal
- Est. fire insurance / yr
- $666 – $1,236
Heat risk 5/10 · Moderate
- Hot days now (above 101°F)
- 7 days/yr
- Hot days in 30 yrs
- 19 days/yr
Wind risk 2/10 · Minimal
- Chance of severe wind over 30 yrs
- 1.0%
Air-quality risk 1/10 · Minimal
- Unhealthy air days now
- 0 days/yr
- Unhealthy air days in 30 yrs
- 0 days/yr
Risk factors via First Street. Map © Google.
Why this score? — see what drove the B grade
The composite is a weighted blend of 9 inputs, each scored 0–100. Each bar is that input's sub-score; the figure is the points it added to the 100-point composite (weight × sub-score).
- Cash flow +30.0/30.0
- 1% rule +10.0/10.0
- DSCR +10.0/10.0
- ARV discount +7.5/15.0
- Rent growth +4.7/5.0
- Schools +4.1/10.0
- Condition / age +3.8/5.0
- Livability +3.7/5.0
- Appreciation +0.0/10.0
$59,950
🖨 Deal sheet 📄 Offer letter ✓ Due diligence
Multi-family units
County records classify this as Multi-Family (2-4 Unit). Listing-text estimate: 1 unit. estimate disagrees with records
Listing remarks MLS
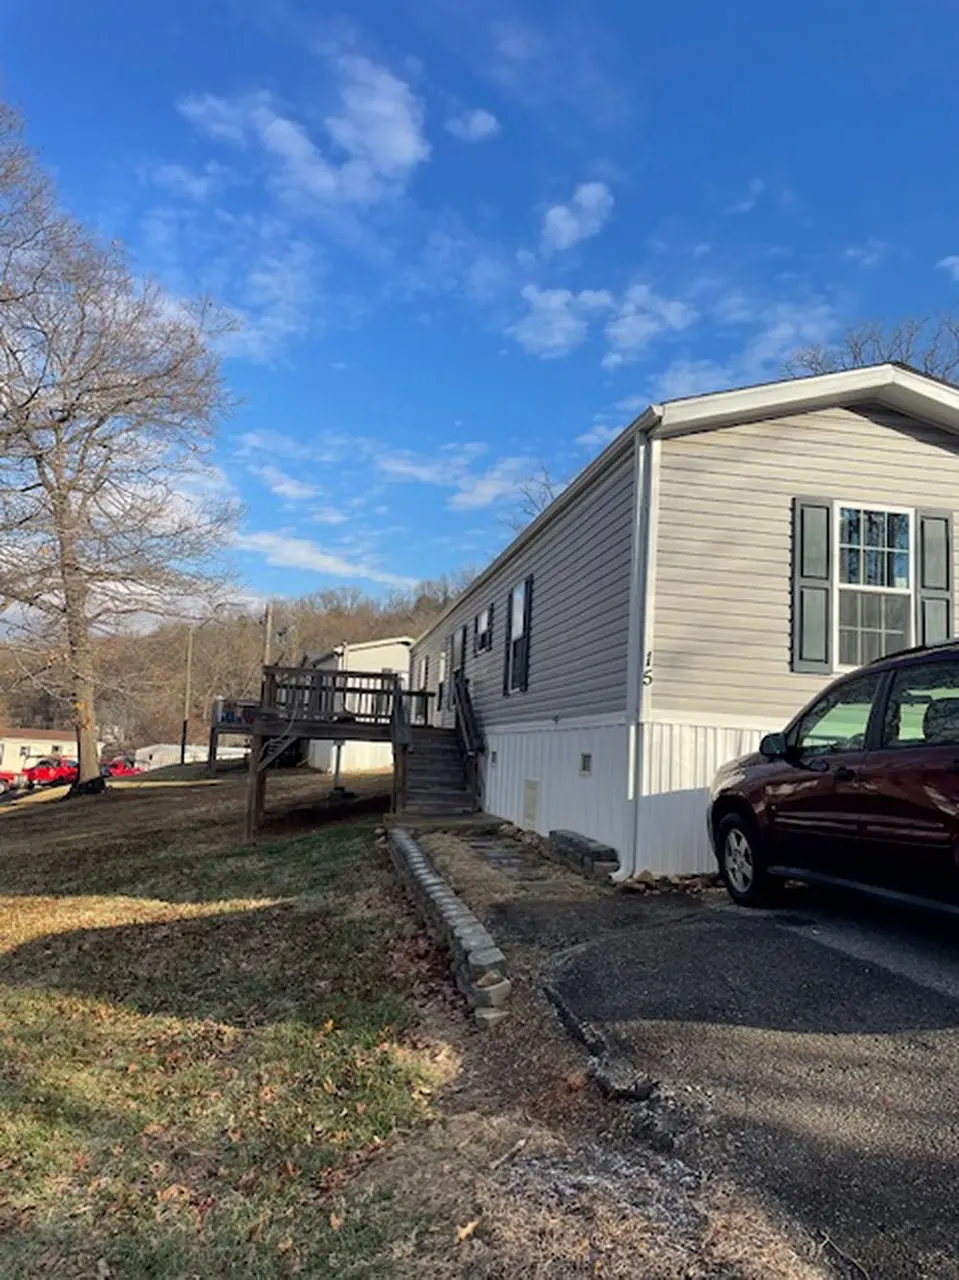
Mobile Home manufactured in 2021 located in South view village mobile home park. 3 bedroom and 2 baths with a seperate laundry room Home is 66 ft length by 14 ft wide! Large deck on the front and smaller one on back. Home is in great condition and the asking price is just for the home. There is $600 a month rent owed on the Lot monthly, the trailer can be moved if buyer choses that.
Key facts
- Large deck
- Great condition
- 11.13 acre lot
Tags
Neighborhood map
What this means for you Summary
Snapshot
- This is a multifamily listed at $60k. Condition is rated good.
Deal economics
- At list price, monthly cash flow is $528 ($6k/yr) — positive.
- The deal already cash-flows at list — no discount required.
- Meets the 1% rule at list price ($1k rent vs $60k).
- Recommended offer: $53k (12.0% below list) — sets the bar for market timing.
- Cap rate 16.9% vs local median 4.2% in Roanoke — top-decile yield for the area; either an underpriced asset or a hidden risk that comps aren't pricing in. Stress-test before assuming the spread holds.
Location & tenants
- Location reads 73/100 on livability (#163 in VA) — a middle-class / working-renter tenant base. Strengths: cost of living A+, health & safety A+, housing A; Watch: amenities C-, employment D, crime F.
- Roanoke City Public School District (urban): math 40% / reading 58% proficiency, ranked #102 of 131 in VA (top 78%) — families likely to look elsewhere, expect single-tenant / working-renter base with shorter leases; 67% free/reduced lunch — lower-income household profile, screen leases tightly.
- Market conditions: Rents rising fast (+8.8%/yr); 155 active listings in the ZIP; 40 comparable units currently listed for rent nearby; rentals lingering (median 44d on market — plan ~5-8 weeks vacancy on turnover, expect pricing pressure); 62% of comp listings sitting > 30 days — soft ceiling on asking rent; 113 units permitted in Roanoke city in 2024 (0 in 5+ unit buildings).
Forward outlook
- Local home prices are declining (-3.0%/yr); year-one equity from $414 of loan paydown is wiped out by about $2k of value loss. Plan a longer hold.
- Roanoke County population projected at +11% by 2050 — modest demand growth; plan on rents tracking national, not racing it.
- At projected returns (-3.0% appreciation + 8.0% rent growth), your $17k cash investment doubles in ~3 years — after that, you're playing with house money.
Negotiation context
- It's been on market 128 days — a 12% lower offer ($53k) is reasonable based on typical stale-listing flexibility.
- 2 sale attempts since 12y ago with the ask held roughly flat each time — persistent listings suggest the price (not the market) is what's stuck; bring a comps-based counter.
Risks & watch-outs
- Climate carrying-cost: extreme-heat days projected 7→19/yr by 2055 (HVAC capex compounding) — expect insurance premiums to compound above CPI over the hold.
Questions for the listing agent
- It's been on market 128 days. Have you received any prior offers? Is the seller open to a 12% concession, seller financing, or rate buy-down credit?
- Why hasn't it sold? Are there any deal-killer items the seller is aware of (foundation, flood, title, zoning, code violations)?
- Is there a deadline driving the sale (1031 exchange, divorce, estate, relocation)? That informs how much negotiation room exists.
- Schools are A-rated — typically a magnet for longer-tenancy family renters. What's the average tenant stay here, and is there a school-zone premium baked into asking?
- Crime grade is F in this area — have there been break-ins, vandalism, or insurance claims at this property in the last 3 years? What carrier currently insures it and at what premium?
- This sits on a lake — are riparian / water-frontage rights deeded with the parcel? Any dock permits, shoreline easements, or HOA water-use restrictions?
- What's the documented flood / surge / shoreline-erosion history here (FEMA AND non-FEMA — e.g., storm surge, creek backup, septic-field saturation)?
- Any water-quality or seasonal algae-bloom issues that affect tenant satisfaction or short-term-rental demand?
- What's the average days-on-market for RENTAL listings here right now (not sales)? A rising rental-DOM trend means longer vacancies and softer asking-rent achievability than the comps imply.
- What's the recent tenant-quality profile in this submarket — average credit score on applications, eviction rate, late-payment / NSF rate, and stable-employment percentage? A property-management company in the area should have these aggregated.
- How much new apartment / multifamily construction is in the pipeline within 1–3 miles? Heavy new supply (>2% of stock underway) typically softens rents 12–24 months out; light construction supports rent growth.
Investment metrics
- 1% rule
- 1.99% ✓
- Cap rate
- 16.87%
- Cash-on-cash
- 37.78%
- DSCR
- 2.68
- GRM
- 4.2
CMA / ARV
- ARV (median comp)
- $212,070
- List price
- $59,950
- Delta
- -71.73%
- Verdict
- UNDERPRICED
- Comps
- 3 within 2.0 mi
Show comp detail 12 sales within ~0.75 mi
| Address | Dist | Beds/Ba | Sqft | Sold | Price | $/sf | Match |
|---|---|---|---|---|---|---|---|
| 1622 Roanoke Ave SW | 0.14mi | —/— | — | 2mo | $635,000 | — | 79 |
| 1517 Lexington Ave SW | 0.13mi | —/— | — | 4mo | $680,000 | — | 79 |
| 1825 Cambridge Ave SW | 0.27mi | —/— | — | 1mo | $350,000 | — | 74 |
| 1138 Wasena Ave SW | 0.38mi | —/— | — | 4mo | $310,000 | — | 66 |
| 1629 Chapman Ave SW | 0.36mi | —/— | — | 7mo | $85,000 | — | 64 |
| 1811 Windsor Ave SW | 0.50mi | —/— | — | 0mo | $300,000 | — | 64 |
| 1110 Campbell Ave SW | 0.49mi | —/— | — | 1mo | $140,000 | — | 64 |
| 1802 Patterson Ave SW | 0.44mi | —/— | — | 5mo | $339,950 | — | 63 |
| 2046 Westover Ave SW | 0.59mi | —/— | — | 8mo | $300,000 | — | 54 |
| 1327 Main St SW | 0.64mi | —/— | — | 5mo | $191,000 | — | 53 |
| 1410 Main St SW | 0.63mi | —/— | — | 6mo | $130,000 | — | 53 |
| 832 Patterson Ave SW | 0.71mi | —/— | — | 8mo | $140,000 | — | 48 |
Match score weights: distance 35% · size 25% · config 20% · recency 20%. Top-matched comps best support the ARV.
Projected returns pro-forma
-3.0% appreciation · 8.0% rent growth · sell at horizon
- IRR
- 39.4%
- Equity multiple
- 2.80×
- Total profit
- $30,266
- Equity at exit
- $8,939
- IRR
- 48.2%
- Equity multiple
- 6.87×
- Total profit
- $98,469
- Equity at exit
- $5,183
Cash invested: $16,786 (down + closing). Projections, not guarantees.
Landlord ↔ Tenant lean methodology
- Overall (STATE)
- 55 Moderately Landlord-Leaning
- State Virginia
- 55 Moderately Landlord-Leaning · D+2
- County
- — inherits STATE
- City
- — inherits STATE
ZIP-level market 24014
- Rents YoY
- 8.8%
- Active inventory
- 155
- Price-to-rent
- 4.2×
Monthly cashflow live
- Estimated rent
- $1,193 high interval (Pro) →
- Mortgage (P&I)
- −$314
- Tax est. 1.5%
- −$75 /mo · $899/yr
- Insurance
- −$25
- HOA
- −$0
- Vacancy / Maint / Mgmt
- −$251
- Net cashflow
- $528
Break-even live
UW: 25.0% down · 7.5% · 30yr · 1.5% tax · 5.0% vac · 8.0% maint · 8.0% mgmt
Financing live
Cash to close
- Down payment
- $14,988
- Closing costs
- $1,798
- Reserves months
- —
- Total cash needed
- —
Loan-product check · same deal, 3 products live
Conventional
25% down · 7.5% · 30yr
- Down + closing
- —
- Monthly P&I
- —
- Monthly cashflow
- —
- DSCR
- —
- Eligible?
- —
Personal DTI + credit; lowest rate.
DSCR
20% down · 8.5% · 30yr
- Down + closing
- —
- Monthly P&I
- —
- Monthly cashflow
- —
- DSCR
- —
- Eligible?
- —
No personal income docs; deal must DSCR.
Hard money
10% down · 12.0% · 12mo
- Down + closing
- —
- Monthly P&I
- —
- Monthly cashflow
- —
- DSCR
- —
- Eligible?
- —
Short-term bridge; refi at stabilization.
Rent comps 40 comps
| Address | Beds | Baths | Sqft | Rent | $/sqft | DOM | Units | Dist |
|---|---|---|---|---|---|---|---|---|
| 1517 Lexington Ave SW Unit 1 Roanoke, VA | 2.0 | 1.0 | 813 | $1,050 | $1.29 | 43d | 1 | 0.14mi |
| 1517 Lexington Ave SW Unit 3 Roanoke, VA | 2.0 | 1.0 | 813 | $1,025 | $1.26 | 43d | 1 | 0.14mi |
| 1601 Memorial Ave SW Unit A5 Roanoke, VA | 2.0 | 1.0 | — | $1,050 | — | 43d | 1 | 0.14mi |
| 1602 Memorial Ave SW Roanoke, VA | 1.0 | 1.0 | 1250 | $1,800 | $1.44 | 43d | 1 | 0.16mi |
| 1813 Oxford Ave SW Roanoke, VA | 2.0 | 1.0 | 800 | $1,200 | $1.50 | 43d | 1 | 0.22mi |
| 1701 Westover Ave SW Roanoke, VA | 1.0–2.0 | 1.0 | 876 | $1,045 | $1.19 | 43d | 4 | 0.29mi |
| 1430 Chapman Ave SW Unit 2 Roanoke, VA | 2.0 | 1.0 | — | $1,150 | — | 13d | 1 | 0.30mi |
| 1624 Chapman Ave SW Unit A6 Roanoke, VA | 1.0 | 1.0 | 650 | $799 | $1.23 | 21d | 1 | 0.30mi |
| 1334 Chapman Ave SW Apt 4 Roanoke, VA | 2.0 | 1.0 | — | $1,075 | — | 43d | 1 | 0.32mi |
| 1405 Chapman Ave SW Roanoke, VA | 1.0 | 1.0 | — | $815 | — | 43d | 1 | 0.34mi |
| 1717 Chapman Ave SW Roanoke, VA | 2.0 | 1.0 | — | $1,195 | — | 13d | 1 | 0.36mi |
| 1422 Patterson Ave SW Unit 1 Roanoke, VA | 2.0 | 1.0 | — | $1,125 | — | 13d | 1 | 0.36mi |
| 1630 Patterson Ave SW Unit B Roanoke, VA | 3.0 | 1.0 | 1200 | $1,395 | $1.16 | 43d | 1 | 0.37mi |
| 1131 Wasena Ave SW Roanoke, VA | 1.0 | 1.0 | — | $1,150 | — | 21d | 1 | 0.39mi |
| 1219 Valley Ave SW Roanoke, VA | 2.0 | 2.0 | 840 | $1,750 | $2.08 | 21d | 1 | 0.39mi |
| 1215 Valley Ave SW Roanoke, VA | 2.0 | 2.0 | 840 | $1,650 | $1.96 | 21d | 1 | 0.39mi |
| 1106 Campbell Ave SW Roanoke, VA | 2.0 | 1.0 | 850 | $950 | $1.12 | 13d | 1 | 0.47mi |
| 1825 Patterson Ave SW Unit B Roanoke, VA | 2.0 | 1.0 | 1000 | $850 | $0.85 | 43d | 1 | 0.48mi |
| 1901 Patterson Ave SW Apt A Roanoke, VA | 3.0 | 1.0 | — | $1,200 | — | 43d | 1 | 0.50mi |
| 1933 Windsor Ave SW Unit 4 Roanoke, VA | 1.0 | 1.0 | 1000 | $1,800 | $1.80 | 43d | 1 | 0.60mi |
| 1709 Sherwood Ave SW Roanoke, VA | 2.0 | 1.0 | 1271 | $1,650 | $1.30 | 43d | 1 | 0.64mi |
| 1331 Main St SW Roanoke, VA | 2.0 | 1.0 | 877 | $1,023 | $1.17 | 21d | 1 | 0.64mi |
| 2102 Westover Ave SW Unit 3 Roanoke, VA | 1.0 | 1.0 | 600 | $899 | $1.50 | 43d | 1 | 0.66mi |
| 934 Floyd Ave SW Unit B Roanoke, VA | 2.0 | 1.0 | — | $1,095 | — | 13d | 1 | 0.66mi |
| 10 12 1/2 St SW Roanoke, VA | 3.0 | 1.5 | 999 | $1,023 | $1.02 | 43d | 1 | 0.68mi |
| 1520 Sherwood Ave SW Roanoke, VA | 2.0 | 1.0 | 900 | $1,500 | $1.67 | 13d | 1 | 0.70mi |
| 1716 Grandin Rd SW Unit 7 Roanoke, VA | 2.0 | 1.0 | 1000 | $1,025 | $1.02 | 43d | 1 | 0.70mi |
| 1732 Grandin Rd SW Unit 57 Roanoke, VA | 2.0 | 1.0 | 814 | $1,045 | $1.28 | 43d | 1 | 0.70mi |
| 1732 Grandin Rd SW Roanoke, VA | 2.0 | 1.0 | 814 | $980 | $1.20 | 21d | 1 | 0.70mi |
| 1732 Grandin Rd SW Apt 55 Roanoke, VA | 2.0 | 1.0 | 814 | $995 | $1.22 | 43d | 1 | 0.70mi |
| 1720 Grandin Rd SW Roanoke, VA | 1.0–3.0 | 1.0 | — | $1,008 | — | 43d | 3 | 0.71mi |
| 2210 Berkley Ave SW Roanoke, VA | 2.0 | 1.0 | 700 | $995 | $1.42 | 43d | 1 | 0.72mi |
| 829 Salem Ave SW Unit 3 Roanoke, VA | 1.0 | 1.0 | 443 | $1,900 | $4.29 | 13d | 1 | 0.77mi |
| 2216 Memorial Ave SW Unit 2218 Roanoke, VA | 2.0 | 1.0 | 1000 | $1,200 | $1.20 | 43d | 1 | 0.78mi |
| 802 Rorer Ave SW Apt A Roanoke, VA | 2.0 | 1.0 | 820 | $895 | $1.09 | 43d | 1 | 0.78mi |
| 2251 Mountain View Ter SW Roanoke, VA | 2.0 | 1.0 | 830 | $988 | $1.19 | 43d | 1 | 0.81mi |
| 743 Suburban Ave SW Unit Suburban 745 Roanoke, VA | 2.0 | 1.0 | 1134 | $1,100 | $0.97 | 13d | 1 | 0.81mi |
| 1818 Belleville Rd SW Roanoke, VA | 2.0 | 1.0 | — | $1,450 | — | 43d | 1 | 0.83mi |
| 1820 Belleville Rd SW Roanoke, VA | 2.0 | 1.0 | — | $1,450 | — | 43d | 1 | 0.83mi |
| 711 Suburban Ave SW Roanoke, VA | 2.0 | 1.5 | 910 | $1,050 | $1.15 | 21d | 1 | 0.84mi |
Listing history 18 events
-
2026-06-18days on market $59,950 Active 128 DOM
-
2026-06-17days on market $59,950 Active 127 DOM
-
2026-06-16days on market $59,950 Active 126 DOM
-
2026-06-15days on market $59,950 Active 125 DOM
-
2026-06-14days on market $59,950 Active 123 DOM
-
2026-06-13days on market $59,950 Active 122 DOM
-
2026-06-10days on market $59,950 Active 120 DOM
-
2026-06-09days on market $59,950 Active 119 DOM
-
2026-06-08days on market $59,950 Active 118 DOM
-
2026-06-05days on market $59,950 Active 114 DOM
-
2026-06-03days on market $59,950 Active 113 DOM
-
2026-06-02days on market $59,950 Active 112 DOM
-
2026-06-01days on market $59,950 Active 111 DOM
-
2026-05-31days on market $59,950 Active 110 DOM
-
2026-05-30days on market $59,950 Active 109 DOM
-
2026-02-10$59,950 Active 385-char remark
Show marketing remark (385 chars)
Mobile Home manufactured in 2021 located in South view village mobile home park. 3 bedroom and 2 baths with a seperate laundry room Home is 66 ft length by 14 ft wide! Large deck on the front and smaller one on back. Home is in great condition and the asking price is just for the home. There is $600 a month rent owed on the Lot monthly, the trailer can be moved if buyer choses that.
-
2014-12-31historical
-
2014-04-05$100,000
ⓘ Source: listings_history table (triggers on properties + properties_extension) + one-shot
backfill from property_details.listing_events for pre-trigger history.
Climate risk First Street
- Flood 1/10 Low FEMA zone X (unshaded) · 0% chance over 30 yrs
- Wildfire 1/10 Low
- Heat 5/10 Major 7 d/yr ≥101°F today · 19 d/yr by 30 yrs out
- Wind 2/10 Low 100% chance of damaging wind over 30 yrs
- Air quality 1/10 Low 0 unhealthy d/yr today · 0 by 30 yrs out
Nearby sold comps map
Loading sold comps map…
Walkable amenities ~0.75 mi
Loading nearby amenities…
Taxation est. · year 1
- Rental income
- $14,320
- − Mortgage interest
- −$3,358
- − Property taxes
- −$899
- − Insurance
- −$300
- − Repairs & maintenance
- −$1,146
- − Management
- −$1,146
- − Depreciation
- −$1,744
- Taxable income
- $5,728
- Est. tax owed @ 24.0%
- −$1,375
- After-tax cash flow
- $4,967/yr
For passive investors: Depreciation is non-cash, so a rental often shows a tax loss while cash-flowing — sheltering income. Rental losses are passive: they offset passive income freely, and up to $25,000/yr can offset ordinary (W-2) income if you actively participate and your MAGI is under $100k (phasing out to $0 by $150k); unused losses carry forward. On sale, claimed depreciation is recaptured at up to 25%, and gains may owe capital-gains tax (a 1031 exchange can defer both). Figures are a year-1 estimate at your 24.0% rate — not tax advice; consult a CPA.
Condition & rehab AI · 10 photos
This mobile home is in good condition with a good foundation and structure. It has a modern kitchen and bathrooms, but could benefit from some cosmetic updates such as painting and landscaping.
Repairs flagged
- Minor Deck — Deck shows some wear and tear
- Minor Landscaping — Basic landscaping could be improved
Value-add opportunities
- Both Paint exterior and interior — Fresh paint enhances curb appeal and interior aesthetics
- Both Landscaping — Improved landscaping increases curb appeal and property value
- Both Replace deck — A new deck would improve functionality and aesthetics
Renovation cost estimate screening
| Repair item | Severity | Est. cost |
|---|---|---|
| Deck · Deck shows some wear and tear | Minor | $500–3,000 |
| Landscaping · Basic landscaping could be improved | Minor | $500–3,000 |
| Total estimated repair cost · 2 items | $1,000–6,000 |
Value-add ROI direction
- Both Paint exterior and interior — Fresh paint enhances curb appeal and interior aesthetics ↑
- Both Landscaping — Improved landscaping increases curb appeal and property value ↑
- Both Replace deck — A new deck would improve functionality and aesthetics ↑
ⓘ Cost ranges are severity-bucket heuristics (US national rule-of-thumb). Get contractor quotes + a written scope before underwriting a rehab budget.
Schools (NCES district)
- District
- Roanoke City Public School District
- NCES district ID
- 5103300
- Math proficiency
- 40% ▼ -38.00%
- Reading proficiency
- 58% ▼ -12.00%
- Median HH income
- $38,592
- Composite
- 40.8/100
- National rank
- #3639
- State rank
- #102 of 131 in VA
Livability — Roanoke
- Score
- 73/100
- State rank
- #163
- US rank
- #5055
Category grades
Schools grade is shown separately in the Schools card above.
Census & demographics
- Census place
- Roanoke, VA
- County
- Roanoke City · 101,625 people
- City population
- 168,930
- Metro
- Roanoke, VA
- Population (ZIP)
- 15,300
- Household income
- $70,381
- Rent vs Own
- Severe rent burden
- 209.0
Population outlook (Roanoke County) Hauer SSP2
- Today (2025)
- 106,094 people
- By 2030
- 108,927 · +2.7%
- By 2040
- 114,104 · +7.5%
- By 2050
- 118,032 · +11.3%
- By 2075
- 123,363 · +16.3%
- By 2100
- 116,827 · +10.1%
Race, ethnicity, and origin ACS 2023
- Neighborhood character
- Predominantly White (85%)
- Race & ethnicity
- White 85% Two or more races 7% Black 5% Hispanic / Latino 5% Asian 1%
- Common ancestry
- Serbian 3% Slovak 2% Italian 2%
- Foreign-born
- 2% · Canada
- Languages at home
- 94% English-only · Spanish 3% Other Indo-European 1% French/Haitian/Cajun 1%
Political lean MEDSL · Roanoke
- 2024 margin
- Strong D (+23.6) · D 61.1% · R 37.5% · Other 1.4%
- 2008→2024 swing
- +0.2pp no change · 2008: 23.4pp · 2024: 23.6pp
- All cycles
- 2024: D+23.6 2020: D+25.8 2016: D+17.6 2012: D+21.5 2008: D+23.4
Not yet ingested
- Civics
- —
Market trends
- HPI YoY
- ▼ -344.06%
- Current HPI
- 173.6728
- Rent YoY
- ▲ 8.80%
- Metro
- Roanoke, VA
- State GDP YoY
- ▲ 2.40%
- F500 in state
- 50
Industry mix (Fortune 500 HQ in VA)
| Industry | F500 HQs | Revenue |
|---|---|---|
| Aerospace / Defense | 4 | $236B |
|
||
| Technology / Defense | 3 | $32B |
|
||
| Financial Services | 2 | $176B |
|
||
| Utilities | 2 | $27B |
|
||
| Insurance | 2 | $25B |
|
||
| Technology | 2 | $15B |
|
||
Price history
-40.1% since first listed3 events — show timeline
- 2026-02-10 Listed $59,950 ForSaleByOwner.com
- 2014-12-31 Listing Removed — CVRMLS
- 2014-04-05 Listed $100,000 CVRMLS
Cash-flow waterfall
monthlySold comps — $/sqft
last 12 mo · ≤1 miLoading sold comps…