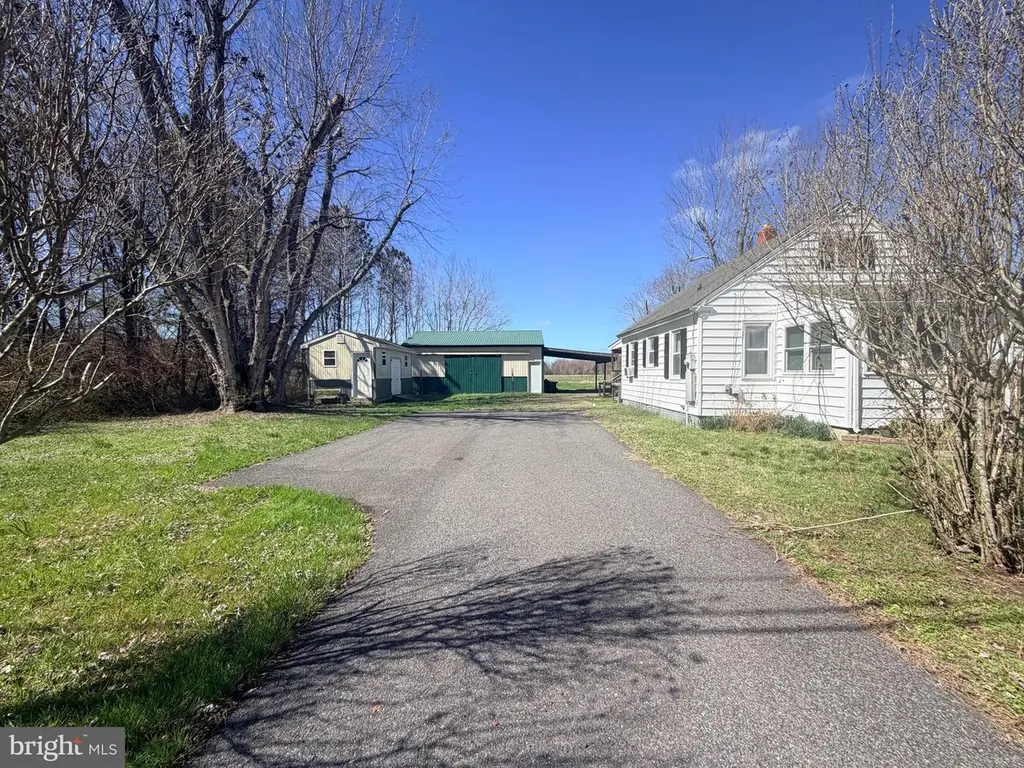
5934 Quantico Rd · Quantico, MD
Flood risk 8/10 · Major
- FEMA flood zone
- X (unshaded)
- Chance of flooding over 30 yrs
- 0.99%
- Est. flood insurance / yr
- $507 – $1,088
Fire risk 4/10 · Minor
- Est. fire insurance / yr
- $755 – $1,403
Heat risk 8/10 · Major
- Hot days now (above 106°F)
- 7 days/yr
- Hot days in 30 yrs
- 17 days/yr
Wind risk 6/10 · Moderate
- Chance of severe wind over 30 yrs
- 73.0%
Air-quality risk 2/10 · Minimal
- Unhealthy air days now
- 2 days/yr
- Unhealthy air days in 30 yrs
- 2 days/yr
Risk factors via First Street. Map © Google.
Why this score? — see what drove the B- grade
The composite is a weighted blend of 9 inputs, each scored 0–100. Each bar is that input's sub-score; the figure is the points it added to the 100-point composite (weight × sub-score).
- Cash flow +27.6/30.0
- DSCR +9.7/10.0
- Appreciation +7.6/10.0
- ARV discount +7.5/15.0
- 1% rule +6.3/10.0
- Livability +3.2/5.0
- Rent growth +2.5/5.0
- Condition / age +2.5/5.0
- Schools +1.9/10.0
$159,995
🖨 Deal sheet (PDF) 📄 Offer letter ✓ Due diligence
Listing remarks MLS
Very well kept home that is in move-in condition. Just right for a first time buyer. Property is being offered AS IS.
Key facts
- 0.76 acre lot
- 3 garage spots
- Built 1950
Tags
Property features AI
Exterior
- Parking: Detached garage with 3 garage spaces (front entry, oversized); Driveway with about 4 parking spaces; Total of 7 garage/parking spaces
- Utilities: Private water; On-site septic; Electric hot water
- Home design: Detached structure; Combination construction; Pillar/post/pier foundation
- Construction: Combination construction materials; Pillar/Post/Pier foundation; Above- and below-grade structures noted
- Exterior features: Not in a federal flood zone; Tidal water: none
Interior
- Bedrooms: 2 bedrooms on the main level
- Bathrooms: 1 full bathroom on the main level
- Heating & cooling: Forced air heating; Window cooling units (electric); Propane (leased) heating fuel; Electric hot water
- Interior features: No basement; Above-grade finished living area reported by assessor
Neighborhood map
What this means for you Summary
Snapshot
- This is a 2-bed/1.0-bath single-family listed at $160k.
Deal economics
- At list price, monthly cash flow is $409 ($5k/yr) — positive.
- The deal already cash-flows at list — no discount required.
- Meets the 1% rule at list price ($2k rent vs $160k).
- Recommended offer: $158k (1.5% below list) — sets the bar for market timing.
Location & tenants
- Location reads 65/100 on livability (#250 in MD) — a middle-class / working-renter tenant base. Strengths: employment A+, housing A+; Watch: crime D-, amenities F, commute F.
- Wicomico County Public Schools (urban): math 16% / reading 26% proficiency, ranked #19 of 24 in MD (top 79%) — low school quality limits family demand, transient renter base, plan for 1-2y turnover.
- Market conditions: 11 active listings in the ZIP; 278 units permitted in Wicomico County in 2024 (44 in 5+ unit buildings).
Forward outlook
- In year one you build about $9k of equity ($1k loan paydown + $8k appreciation (5.1% local appreciation)).
- Wicomico County population projected at +14% by 2050 — modest demand growth; plan on rents tracking national, not racing it.
- At projected returns (5.1% appreciation + 3.0% rent growth), your $45k cash investment doubles in ~3 years — after that, you're playing with house money.
- By year 4, paydown + projected appreciation supports a ~$31k cash-out refi (75% LTV) — recoverable capital for the next deal without selling this one.
Negotiation context
- It's been on market 26 days — a 2% lower offer ($158k) is reasonable based on typical stale-listing flexibility.
- 3 sale attempts since 19y ago with the ask held roughly flat each time — persistent listings suggest the price (not the market) is what's stuck; bring a comps-based counter.
- Current owner paid $75k; list at $160k implies a 113% gain — meaningful room to come down on a strong offer.
Risks & watch-outs
- Watch-outs: flood insurance adds $66/mo; built in 1950 — expect roof / HVAC / electrical / plumbing capex.
- Climate carrying-cost: severe flood risk; major wind risk, 73% chance of damaging wind over 30y; extreme-heat days projected 7→17/yr by 2055 (HVAC capex compounding) — expect insurance premiums to compound above CPI over the hold.
Questions for the listing agent
- Built in 1950 — when were the roof, HVAC, electrical panel, plumbing, and water heater last replaced?
- What's the actual annual flood-insurance premium (NFIP or private), and is the property in a SFHA with mandatory coverage?
- Is there a deadline driving the sale (1031 exchange, divorce, estate, relocation)? That informs how much negotiation room exists.
- Crime grade is D in this area — have there been break-ins, vandalism, or insurance claims at this property in the last 3 years? What carrier currently insures it and at what premium?
- What's the average days-on-market for RENTAL listings here right now (not sales)? A rising rental-DOM trend means longer vacancies and softer asking-rent achievability than the comps imply.
- What's the recent tenant-quality profile in this submarket — average credit score on applications, eviction rate, late-payment / NSF rate, and stable-employment percentage? A property-management company in the area should have these aggregated.
- How much new for-sale + rental construction is in the pipeline within 1–3 miles? Heavy new supply typically softens prices + rents 12–24 months out; constrained supply supports both.
Investment metrics
- 1% rule
- 1.13% ✓
- Cap rate
- 9.86%
- Cash-on-cash
- 12.73%
- DSCR
- 1.57
- GRM
- 7.4
CMA / ARV
No comps found within radius.
Projected returns pro-forma
5.1% appreciation · 3.0% rent growth · sell at horizon
- IRR
- 22.5%
- Equity multiple
- 2.42×
- Total profit
- $63,814
- Equity at exit
- $91,644
- IRR
- 21.9%
- Equity multiple
- 4.79×
- Total profit
- $169,951
- Equity at exit
- $158,980
Cash invested: $44,799 (down + closing). Projections, not guarantees.
Landlord ↔ Tenant lean methodology
- Overall (STATE)
- 27 Tenant-Leaning
- State Maryland
- 27 Tenant-Leaning · D+14
- County
- — inherits STATE
- City
- — inherits STATE
ZIP-level market 21856
- Home prices YoY
- 2.4%
- Active inventory
- 11
- Price-to-rent
- 7.4×
Monthly cashflow live
- Estimated rent
- $1,808 medium interval (Pro) →
- Mortgage (P&I)
- −$839
- Tax from tax record
- −$47 /mo · $567/yr
- Insurance
- −$67
- Flood insurance flood zone
- −$66 /mo · $798/yr
- HOA
- −$0
- Vacancy / Maint / Mgmt
- −$380
- Net cashflow
- $409
Break-even live
Sensitivity live
| Price | -10% $500 | -5% $454 | +0% $409 | +5% $364 | +10% $318 |
|---|---|---|---|---|---|
| Rent | -10% $266 | -5% $338 | +0% $409 | +5% $480 | +10% $552 |
| Rate | -1.0pp $490 | -0.5pp $450 | base $409 | +0.5pp $367 | +1.0pp $325 |
UW: 25.0% down · 7.5% · 30yr · 1.5% tax · 5.0% vac · 8.0% maint · 8.0% mgmt
Financing live
Cash to close
- Down payment
- $39,999
- Closing costs
- $4,800
- Reserves months
- —
- Total cash needed
- —
Loan-product check · same deal, 3 products live
Conventional
25% down · 7.5% · 30yr
- Down + closing
- —
- Monthly P&I
- —
- Monthly cashflow
- —
- DSCR
- —
- Eligible?
- —
Personal DTI + credit; lowest rate.
DSCR
20% down · 8.5% · 30yr
- Down + closing
- —
- Monthly P&I
- —
- Monthly cashflow
- —
- DSCR
- —
- Eligible?
- —
No personal income docs; deal must DSCR.
Hard money
10% down · 12.0% · 12mo
- Down + closing
- —
- Monthly P&I
- —
- Monthly cashflow
- —
- DSCR
- —
- Eligible?
- —
Short-term bridge; refi at stabilization.
Listing history 23 events
-
2026-06-18days on market $159,995 Active 26 DOM
-
2026-06-17days on market $159,995 Active 25 DOM
-
2026-06-16days on market $159,995 Active 24 DOM
-
2026-06-15days on market $159,995 Active 23 DOM
-
2026-06-14days on market $159,995 Active 21 DOM
-
2026-06-13days on market $159,995 Active 20 DOM
-
2026-06-10days on market $159,995 Active 18 DOM
-
2026-06-09days on market $159,995 Active 17 DOM
-
2026-06-08days on market $159,995 Active 16 DOM
-
2026-06-07days on market $159,995 Active 15 DOM
-
2026-06-03days on market $159,995 Active 11 DOM
-
2026-06-02days on market $159,995 Active 10 DOM
-
2026-06-01days on market $159,995 Active 9 DOM
-
2026-05-31days on market $159,995 Active 8 DOM
-
2026-05-30days on market $159,995 Active 7 DOM
-
2026-05-29status Active
-
2026-04-30soldstatus Closed
-
2026-03-24historical Active Under Contract
-
2026-03-17$159,995 Active
-
2007-12-31soldstatus $75,000
-
2007-12-21soldstatus $75,000 118-char remark
Show marketing remark (118 chars)
Very well kept home that is in move-in condition. Just right for a first time buyer. Property is being offered AS IS.
-
2007-10-29$75,000 118-char remark
Show marketing remark (118 chars)
Very well kept home that is in move-in condition. Just right for a first time buyer. Property is being offered AS IS.
-
1989-03-14soldstatus $35,000
ⓘ Source: listings_history table (triggers on properties + properties_extension) + one-shot
backfill from property_details.listing_events for pre-trigger history.
Tax reassessment forecast MD · Partial reset (capped growth)
- Current annual tax
- $567 · $47/mo
- Projected year-2 tax
- $1,155 · $96/mo
- Expected delta
- +$589/yr (+$49/mo · 103.9%)
ⓘ Screening estimate from a state-policy table — verify with the county assessor before closing.
Climate risk First Street
- Flood 8/10 Severe FEMA zone X (unshaded) · 99% chance over 30 yrs
- Wildfire 4/10 Moderate
- Heat 8/10 Severe 7 d/yr ≥106°F today · 17 d/yr by 30 yrs out
- Wind 6/10 Major 73% chance of damaging wind over 30 yrs
- Air quality 2/10 Low 2 unhealthy d/yr today · 2 by 30 yrs out
Nearby sold comps map
Loading sold comps map…
Walkable amenities ~0.75 mi
Loading nearby amenities…
Taxation est. · year 1
- Rental income
- $21,696
- − Mortgage interest
- −$8,962
- − Property taxes
- −$567
- − Insurance
- −$1,597
- − Repairs & maintenance
- −$1,736
- − Management
- −$1,736
- − Depreciation
- −$4,654
- Taxable income
- $2,444
- Est. tax owed @ 24.0%
- −$586
- After-tax cash flow
- $4,321/yr
For passive investors: Depreciation is non-cash, so a rental often shows a tax loss while cash-flowing — sheltering income. Rental losses are passive: they offset passive income freely, and up to $25,000/yr can offset ordinary (W-2) income if you actively participate and your MAGI is under $100k (phasing out to $0 by $150k); unused losses carry forward. On sale, claimed depreciation is recaptured at up to 25%, and gains may owe capital-gains tax (a 1031 exchange can defer both). Figures are a year-1 estimate at your 24.0% rate — not tax advice; consult a CPA.
Schools (NCES district)
- District
- Wicomico County Public Schools
- NCES district ID
- 2400690
- Math proficiency
- 16% ▼ -18.00%
- Reading proficiency
- 26% ▼ -13.00%
- Median HH income
- $51,745
- Composite
- 18.87/100
- National rank
- #8860
- State rank
- #19 of 24 in MD
Livability — Quantico
- Score
- 65/100
- State rank
- #250
- US rank
- #12922
Category grades
Schools grade is shown separately in the Schools card above.
Census & demographics
- Population (ZIP)
- 816
Population outlook (Wicomico County) Hauer SSP2
- Today (2025)
- 108,548 people
- By 2030
- 111,783 · +3.0%
- By 2040
- 118,139 · +8.8%
- By 2050
- 123,641 · +13.9%
- By 2075
- 139,784 · +28.8%
- By 2100
- 145,334 · +33.9%
Race, ethnicity, and origin ACS 2023
- Neighborhood character
- Predominantly White (65%)
- Race & ethnicity
- White 65% Black 27% Two or more races 8%
- Common ancestry
- Hispanic 2% Slovak 2%
- Foreign-born
- 4% · Canada
- Languages at home
- 98% English-only · French/Haitian/Cajun 2%
Political lean MEDSL · Wicomico
- 2024 margin
- Lean R (+5.5) · D 46.1% · R 51.5% · Other 2.4%
- 2008→2024 swing
- +0.3pp no change · 2008: -5.8pp · 2024: -5.5pp
- All cycles
- 2024: R+5.5 2020: R+1.9 2016: R+11.6 2012: R+6.9 2008: R+5.8
Not yet ingested
- Civics
- —
Market trends
- HPI YoY
- ▲ 5.10%
- Current HPI
- 216.379
- Rent YoY
- —
- Metro
- —
- State GDP YoY
- ▲ 2.97%
- F500 in state
- 12
Industry mix (Fortune 500 HQ in MD)
| Industry | F500 HQs | Revenue |
|---|---|---|
| Aerospace / Defense | 1 | $71B |
|
||
| Utilities | 1 | $25B |
|
||
| Hotels | 1 | $24B |
|
||
| Consumer Goods | 1 | $7B |
|
||
| Real Estate | 1 | $6B |
|
||
| Chemicals | 1 | $2B |
|
||
Price history
+357.1% since first listed8 events — show timeline
- 2026-05-29 Relisted — BRIGHT MLS
- 2026-04-30 Sold (MLS) — BRIGHT MLS
- 2026-03-24 Contingent — BRIGHT MLS
- 2026-03-17 Listed $159,995 BRIGHT MLS
- 2007-12-31 Sold (Public Records) $75,000 Public Records
- 2007-12-21 Sold (MLS) $75,000 BRIGHT MLS
- 2007-10-29 Listed $75,000 BRIGHT MLS
- 1989-03-14 Sold (Public Records) $35,000 Public Records
Property tax history
-0.4%/yrLatest (2025): $567 · +1.2% YoY. Source: county tax records.
Cash-flow waterfall
monthlySold comps — $/sqft
last 12 mo · ≤1 miLoading sold comps…