 7-Plex
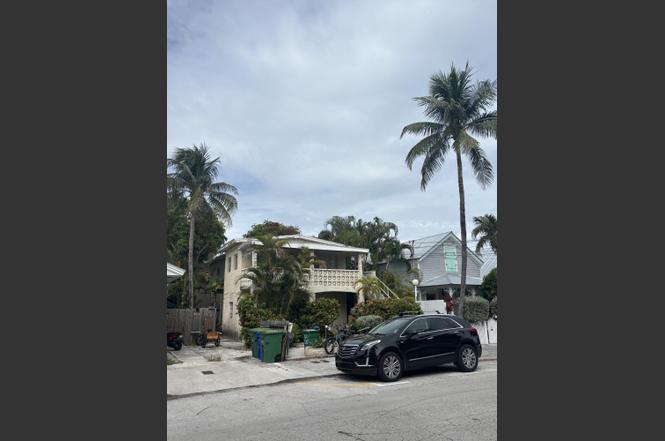
909 Grinnell St · Key West, FL
Flood risk 7/10 · Major
- FEMA flood zone
- X (shaded)
- Chance of flooding over 30 yrs
- 0.95%
- Est. flood insurance / yr
- $507 – $1,088
Fire risk 1/10 · Minimal
- Est. fire insurance / yr
- $947 – $1,759
Heat risk No data
- Hot days now (above threshold)
- —
- Hot days in 30 yrs
- —
Wind risk 10/10 · Severe
- Chance of severe wind over 30 yrs
- 99.0%
Air-quality risk 1/10 · Minimal
- Unhealthy air days now
- 0 days/yr
- Unhealthy air days in 30 yrs
- 0 days/yr
Risk factors via First Street. Map © Google.
Why this score? — see what drove the B grade
The composite is a weighted blend of 9 inputs, each scored 0–100. Each bar is that input's sub-score; the figure is the points it added to the 100-point composite (weight × sub-score).
- Cash flow +30.0/30.0
- DSCR +10.0/10.0
- 1% rule +9.3/10.0
- ARV discount +8.6/15.0
- Schools +4.6/10.0
- Livability +4.1/5.0
- Rent growth +3.6/5.0
- Condition / age +2.5/5.0
- Appreciation +0.0/10.0
$1,899,000
🖨 Deal sheet (PDF) 📄 Offer letter ✓ Due diligence
Multi-family units
County records classify this as Multi-Family (2-4 Unit). Listing-text estimate: 7 units. estimate disagrees with records
Listing remarks
Rare opportunity to acquire SEVEN units in the X-Flood Zone in Old Town Key West. That's correct, seven market rate units! That's less than $272K per unit! Renovations in progress. Recent changes to IRS tax code (such as accelerated depreciation) can benefit RE Investors - ask your tax expert. Prime location, just 1/2 block from cemetery and 1/2 block off Truman Ave. Currently configured as 6 units (but City recognizes 7). Presently being used as: one 2-bedroom unit, three 1-bedroom units and 2 studio units. All with separate exterior entrances. Convenient location is close to many Old Town hot spots including world famous Duval St. . Perfect for employee housing or income producing multi-
Key facts
- Seven units
- X-flood zone
- 3,002 sq ft lot
Tags
Property features AI
Finance
- Financial info: Seven total units
- HOA & community: No association fees; No HOA fee inclusions; No first right of refusal
Exterior
- Utilities: Public sewer hook-up available; Buyer to verify other utilities
- Home design: Two-story building; Above flood level; Historic High Density Residential zoning; Located in Old Town (north of Truman), Key West; property faces median side of the block
- Construction: Built in 1976; CBS construction
- Exterior features: No waterfront; No dockage; Pets allowed; Rentals allowed with a minimum of 30 days; Located in a 0.07-acre lot (less than 1/4 acre); Located in Flood Zone: 0.2% annual chance
Interior
- Kitchen: Some appliances included
- Bathrooms: Six full bathrooms
- Heating & cooling: Window/Wall unit
- Interior features: Window/Wall unit cooling and heating; Some kitchen appliances included
Neighborhood map
What this means for you Summary
Snapshot
- This is a 7 × 7-bed/6.0-bath units multifamily listed at $1.90M.
Deal economics
- At list price, monthly cash flow is $9k ($112k/yr) — positive. Per door: $1k/mo.
- The deal already cash-flows at list — no discount required.
- Meets the 1% rule at list price ($27k rent vs $1.90M).
- Recommended offer: $1.67M (12.0% below list) — sets the bar for market timing.
- Cap rate 12.2% vs local median 0.8% in Key West — top-decile yield for the area; either an underpriced asset or a hidden risk that comps aren't pricing in. Stress-test before assuming the spread holds.
Location & tenants
- Location reads 82/100 on livability (#65 in FL, #1,123 nationally) — a professional / high-income tenant draw. Strengths: amenities A+, commute A+, employment A+; Watch: crime D+, cost of living F.
- Monroe (town): math 50% / reading 55% proficiency, ranked #23 of 73 in FL (top 32%) — acceptable for families but not a draw, mixed tenant base, ~2y average lease.
- Market conditions: Rents rising fast (+4.5%/yr); 496 active listings in the ZIP; solid renter incomes; 332 units permitted in Monroe County in 2024 (42 in 5+ unit buildings).
- At $27,118/mo this rent would consume 376% of the median local household income ($87k/yr) (locally 2502% of renters already pay >50% of income on rent) — very limited rent-growth headroom before tenants either downsize or default.
Forward outlook
- Local home prices are declining (-3.0%/yr); year-one equity from $13k of loan paydown is wiped out by about $57k of value loss. Plan a longer hold.
- Monroe County population projected at +28% by 2050 — long-run rental-demand tailwind backs the buy-and-hold thesis.
- At projected returns (-3.0% appreciation + 4.5% rent growth), your $532k cash investment doubles in ~6 years — after that, you're playing with house money.
Negotiation context
- It's been on market 331 days — a 12% lower offer ($1.67M) is reasonable based on typical stale-listing flexibility.
- 3 sale attempts since 3y ago with the ask held roughly flat each time — persistent listings suggest the price (not the market) is what's stuck; bring a comps-based counter.
- Current owner paid $73k; list at $1.90M implies a 2501% gain — meaningful room to come down on a strong offer.
Risks & watch-outs
- Watch-outs: flood insurance adds $66/mo.
- Climate carrying-cost: major flood risk; severe wind risk, 99% chance of damaging wind over 30y — expect insurance premiums to compound above CPI over the hold.
Questions for the listing agent
- It's been on market 331 days. Have you received any prior offers? Is the seller open to a 12% concession, seller financing, or rate buy-down credit?
- Can we see the unit-by-unit rent roll, current vacancy, and any below-market leases? What's the average tenancy length?
- What capital expenditures (roof, boiler, parking lot, exteriors) have been made in the last 5 years, and what's planned in the next 2?
- Built in 1976 — when were the roof, HVAC, electrical panel, plumbing, and water heater last replaced?
- What's the actual annual flood-insurance premium (NFIP or private), and is the property in a SFHA with mandatory coverage?
- Why hasn't it sold? Are there any deal-killer items the seller is aware of (foundation, flood, title, zoning, code violations)?
- Is there a deadline driving the sale (1031 exchange, divorce, estate, relocation)? That informs how much negotiation room exists.
- Schools are B-rated — typically a magnet for longer-tenancy family renters. What's the average tenant stay here, and is there a school-zone premium baked into asking?
- Crime grade is D in this area — have there been break-ins, vandalism, or insurance claims at this property in the last 3 years? What carrier currently insures it and at what premium?
- What's the average days-on-market for RENTAL listings here right now (not sales)? A rising rental-DOM trend means longer vacancies and softer asking-rent achievability than the comps imply.
- What's the recent tenant-quality profile in this submarket — average credit score on applications, eviction rate, late-payment / NSF rate, and stable-employment percentage? A property-management company in the area should have these aggregated.
- How much new apartment / multifamily construction is in the pipeline within 1–3 miles? Heavy new supply (>2% of stock underway) typically softens rents 12–24 months out; light construction supports rent growth.
Investment metrics
- 1% rule
- 1.43% ✓
- Cap rate
- 12.25%
- Cash-on-cash
- 21.27%
- DSCR
- 1.95
- GRM
- 5.8
CMA / ARV
- ARV (on-the-fly)
- $1,947,420
- Comps found
- 2
Show comp detail 2 sales within ~0.75 mi
| Address | Dist | Beds/Ba | Sqft | Sold | Price | $/sf | Match |
|---|---|---|---|---|---|---|---|
| 602 Southard St | 0.44mi | 3/3.0 (-1) | 2,671 (-4%) | 11mo | $1,425,000 | $534 | 58 |
| 1320 Johnson St | 0.63mi | 3/4.0 (-1) | 2,436 (-13%) | 15mo | $1,700,000 | $698 | 28 |
Match score weights: distance 35% · size 25% · config 20% · recency 20%. Top-matched comps best support the ARV.
Projected returns pro-forma
-3.0% appreciation · 4.52% rent growth · sell at horizon
- IRR
- 15.2%
- Equity multiple
- 1.62×
- Total profit
- $330,272
- Equity at exit
- $283,147
- IRR
- 24.9%
- Equity multiple
- 3.32×
- Total profit
- $1,232,429
- Equity at exit
- $164,191
Cash invested: $531,720 (down + closing). Projections, not guarantees.
Landlord ↔ Tenant lean methodology
- Overall (STATE)
- 87 Strongly Landlord-Friendly
- State Florida
- 87 Strongly Landlord-Friendly · R+3
- County
- — inherits STATE
- City
- — inherits STATE
ZIP-level market 33040
- Rents YoY
- 4.5%
- Active inventory
- 496
- Price-to-rent
- 40.8×
Monthly cashflow live
- Estimated rent
- $27,118 medium interval (Pro) →
- Mortgage (P&I)
- −$9,959
- Tax from tax record
- −$1,247 /mo · $14,965/yr
- Insurance
- −$791
- Flood insurance flood zone
- −$66 /mo · $798/yr
- HOA
- −$0
- Vacancy / Maint / Mgmt
- −$5,695
- Net cashflow
- $9,360
Break-even live
Sensitivity live
| Price | -10% $10,435 | -5% $9,897 | +0% $9,360 | +5% $8,822 | +10% $8,285 |
|---|---|---|---|---|---|
| Rent | -10% $7,218 | -5% $8,289 | +0% $9,360 | +5% $10,431 | +10% $11,502 |
| Rate | -1.0pp $10,316 | -0.5pp $9,843 | base $9,360 | +0.5pp $8,868 | +1.0pp $8,367 |
7-unit breakdown (identical units grouped — click to expand)
| Units | Beds | Baths | Est. rent |
|---|---|---|---|
| 7× units | 7 | 6 | $27,118 |
| #1 | 7 | 6 | $3,874 |
| #2 | 7 | 6 | $3,874 |
| #3 | 7 | 6 | $3,874 |
| #4 | 7 | 6 | $3,874 |
| #5 | 7 | 6 | $3,874 |
| #6 | 7 | 6 | $3,874 |
| #7 | 7 | 6 | $3,874 |
| Total (7 units) | $27,118 | ||
UW: 25.0% down · 7.5% · 30yr · 1.5% tax · 5.0% vac · 8.0% maint · 8.0% mgmt
Financing live
Cash to close
- Down payment
- $474,750
- Closing costs
- $56,970
- Reserves months
- —
- Total cash needed
- —
Loan-product check · same deal, 3 products live
Conventional
25% down · 7.5% · 30yr
- Down + closing
- —
- Monthly P&I
- —
- Monthly cashflow
- —
- DSCR
- —
- Eligible?
- —
Personal DTI + credit; lowest rate.
DSCR
20% down · 8.5% · 30yr
- Down + closing
- —
- Monthly P&I
- —
- Monthly cashflow
- —
- DSCR
- —
- Eligible?
- —
No personal income docs; deal must DSCR.
Hard money
10% down · 12.0% · 12mo
- Down + closing
- —
- Monthly P&I
- —
- Monthly cashflow
- —
- DSCR
- —
- Eligible?
- —
Short-term bridge; refi at stabilization.
Listing history 24 events
-
2026-06-19days on market $1,899,000 Active 331 DOM
-
2026-06-18days on market $1,899,000 Active 330 DOM
-
2026-06-17days on market $1,899,000 Active 329 DOM
-
2026-06-16days on market $1,899,000 Active 328 DOM
-
2026-06-15days on market $1,899,000 Active 327 DOM
-
2026-06-14days on market $1,899,000 Active 325 DOM
-
2026-06-13days on market $1,899,000 Active 324 DOM
-
2026-06-10days on market $1,899,000 Active 322 DOM
-
2026-06-09days on market $1,899,000 Active 321 DOM
-
2026-06-08days on market $1,899,000 Active 320 DOM
-
2026-06-07days on market $1,899,000 Active 319 DOM
-
2026-06-05days on market $1,899,000 Active 316 DOM
-
2026-06-03days on market $1,899,000 Active 315 DOM
-
2026-06-02days on market $1,899,000 Active 314 DOM
-
2026-06-01days on market $1,899,000 Active 313 DOM
-
2026-05-31days on market $1,899,000 Active 312 DOM
-
2026-05-30days on market $1,899,000 Active 311 DOM
-
2025-07-23$1,899,000 Active
-
2023-08-01historical
-
2023-05-07status Active
-
2023-04-22historical Contingent (Show)
-
2023-03-20price $1,675,000
-
2023-01-30$1,995,000 Active
-
1985-09-01soldstatus $73,000
ⓘ Source: listings_history table (triggers on properties + properties_extension) + one-shot
backfill from property_details.listing_events for pre-trigger history.
Tax reassessment forecast FL · Resets to sale price
- Current annual tax
- $14,965 · $1,247/mo
- Projected year-2 tax
- $15,762 · $1,313/mo
- Expected delta
- +$797/yr (+$66/mo · 5.3%)
ⓘ Screening estimate from a state-policy table — verify with the county assessor before closing.
Climate risk First Street
- Flood 7/10 Severe FEMA zone X (shaded) · 95% chance over 30 yrs
- Wildfire 1/10 Low
- Wind 10/10 Extreme 99% chance of damaging wind over 30 yrs
- Air quality 1/10 Low 0 unhealthy d/yr today · 0 by 30 yrs out
Nearby sold comps map
Loading sold comps map…
Walkable amenities ~0.75 mi
Loading nearby amenities…
Taxation est. · year 1
- Rental income
- $325,416
- − Mortgage interest
- −$106,374
- − Property taxes
- −$14,965
- − Insurance
- −$10,292
- − Repairs & maintenance
- −$26,033
- − Management
- −$26,033
- − Depreciation
- −$55,244
- Taxable income
- $86,475
- Est. tax owed @ 24.0%
- −$20,754
- After-tax cash flow
- $91,564/yr
For passive investors: Depreciation is non-cash, so a rental often shows a tax loss while cash-flowing — sheltering income. Rental losses are passive: they offset passive income freely, and up to $25,000/yr can offset ordinary (W-2) income if you actively participate and your MAGI is under $100k (phasing out to $0 by $150k); unused losses carry forward. On sale, claimed depreciation is recaptured at up to 25%, and gains may owe capital-gains tax (a 1031 exchange can defer both). Figures are a year-1 estimate at your 24.0% rate — not tax advice; consult a CPA.
Schools (NCES district)
- District
- Monroe
- NCES district ID
- 1201320
- Math proficiency
- 50% ▼ -14.00%
- Reading proficiency
- 55% ▼ -6.00%
- Median HH income
- $56,955
- Composite
- 45.51/100
- National rank
- #2608
- State rank
- #23 of 73 in FL
Livability — Key West
- Score
- 82/100
- State rank
- #65
- US rank
- #1123
Category grades
Schools grade is shown separately in the Schools card above.
Census & demographics
- Census place
- Key West, FL
- County
- Monroe County · 66,185 people
- City population
- 35,429
- Metro
- Key West, FL
- Population (ZIP)
- 35,429
- Household income
- $86,586
- Rent vs Own
- Severe rent burden
- 2502.0
Population outlook (Monroe County) Hauer SSP2
- Today (2025)
- 90,706 people
- By 2030
- 96,308 · +6.2%
- By 2040
- 106,565 · +17.5%
- By 2050
- 116,500 · +28.4%
- By 2075
- 141,423 · +55.9%
- By 2100
- 151,947 · +67.5%
Race, ethnicity, and origin ACS 2023
- Neighborhood character
- Diverse neighborhood (Simpson 0.61)
- Race & ethnicity
- White 56% Hispanic / Latino 26% Two or more races 16% Black 12% Asian 2%
- Hispanic origin (detail)
- Mexican 2% Puerto Rican 2% Cuban 14%
- Common ancestry
- Hispanic 6% Romanian 2% Scotch-Irish 2%
- Foreign-born
- 22% · Canada, Dominican Republic
- Languages at home
- 76% English-only · Spanish 17% French/Haitian/Cajun 2% Russian/Polish/Slavic 2%
Political lean MEDSL · Monroe
- 2024 margin
- R (+18.3) · D 40.5% · R 58.8%
- 2008→2024 swing
- -23.2pp toward R · 2008: 4.9pp · 2024: -18.3pp
- All cycles
- 2024: R+18.3 2020: R+7.9 2016: R+6.9 2012: D+0.4 2008: D+4.9
Not yet ingested
- Civics
- —
Market trends
- HPI YoY
- ▼ -814.48%
- Current HPI
- 168.5706
- Rent YoY
- ▲ 4.52%
- Metro
- Key West, FL
- State GDP YoY
- ▲ 3.28%
- F500 in state
- 36
Industry mix (Fortune 500 HQ in FL)
| Industry | F500 HQs | Revenue |
|---|---|---|
| Industrial Technology | 2 | $29B |
|
||
| Insurance | 2 | $17B |
|
||
| Retail | 1 | $60B |
|
||
| Technology Distribution | 1 | $58B |
|
||
| Homebuilding | 1 | $35B |
|
||
| Technology Manufacturing | 1 | $35B |
|
||
Price history
+2501.4% since first listed7 events — show timeline
- 2025-07-23 Listed $1,899,000 FLKMLS
- 2023-08-01 Listing Removed — FLKMLS
- 2023-05-07 Relisted — FLKMLS
- 2023-04-22 Contingent — FLKMLS
- 2023-03-20 Price Changed $1,675,000 FLKMLS
- 2023-01-30 Listed $1,995,000 FLKMLS
- 1985-09-01 Sold (Public Records) $73,000 Public Records
Property tax history
+8.5%/yrLatest (2025): $14,965 · +5.3% YoY. Source: county tax records.
Cash-flow waterfall
monthlySold comps — $/sqft
last 12 mo · ≤1 miLoading sold comps…