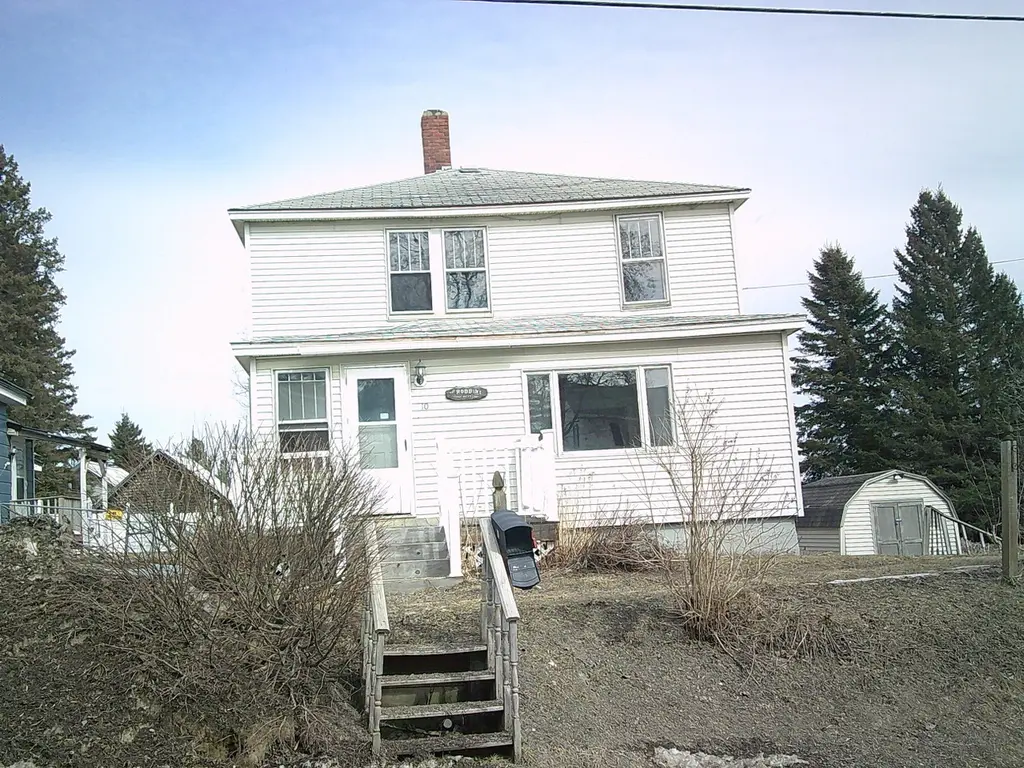
10 S Park St · Caribou, ME
Flood risk 1/10 · Minimal
- FEMA flood zone
- X
- Chance of flooding over 30 yrs
- 0.0%
- Est. flood insurance / yr
- $473 – $860
Fire risk 2/10 · Minimal
- Est. fire insurance / yr
- $669 – $1,243
Heat risk 2/10 · Minimal
- Hot days now (above 87°F)
- 7 days/yr
- Hot days in 30 yrs
- 15 days/yr
Wind risk 4/10 · Minor
- Chance of severe wind over 30 yrs
- 10.0%
Air-quality risk 1/10 · Minimal
- Unhealthy air days now
- 0 days/yr
- Unhealthy air days in 30 yrs
- 0 days/yr
Risk factors via First Street. Map © Google.
Why this score? — see what drove the B- grade
The composite is a weighted blend of 9 inputs, each scored 0–100. Each bar is that input's sub-score; the figure is the points it added to the 100-point composite (weight × sub-score).
- Cash flow +27.5/30.0
- DSCR +9.6/10.0
- 1% rule +9.2/10.0
- ARV discount +7.5/15.0
- Schools +6.9/10.0
- Livability +3.7/5.0
- Rent growth +2.5/5.0
- Condition / age +2.5/5.0
- Appreciation +0.0/10.0
$79,900
🖨 Deal sheet 📄 Offer letter ✓ Due diligence
Listing remarks
Three bedroom, 1 1/2 bath home on a nice intown lot. Front and rear decks. Check it out today.
Key facts
- 0.28 acre lot
- Parking
- Built 1930
Property features AI
Finance
- Financial info: Residential zoning
Exterior
- Parking: Gravel off-street parking with 1–4 spaces
- Utilities: Public water; Public sewer; Electric service with circuit breakers
- Home design: Single family residence; Built in 1930; Vinyl siding with wood frame construction; Shingle roof
- Construction: Wood frame construction; Vinyl siding; Shingle roof; Built in 1930
- Exterior features: Intown neighborhood setting; Paved road access
Interior
- Kitchen: Kitchen on the first floor
- Bedrooms: Three bedrooms on the second floor
- Flooring: Wood flooring; Linoleum flooring
- Bathrooms: One full bathroom; One half bathroom
- Heating & cooling: Forced air heating
- Interior features: 8 total rooms; Unfinished basement with interior entry and doghouse access
- Laundry & utility: Electric water heater
Neighborhood map
What this means for you Summary
Snapshot
- This is a 3-bed/1.5-bath single-family listed at $80k.
Deal economics
- At list price, monthly cash flow is $236 ($3k/yr) — positive.
- The deal already cash-flows at list — no discount required.
- Meets the 1% rule at list price ($1k rent vs $80k).
- Cap rate 9.8% vs local median 3.6% in Caribou — top-decile yield for the area; either an underpriced asset or a hidden risk that comps aren't pricing in. Stress-test before assuming the spread holds.
Location & tenants
- Location reads 74/100 on livability (#46 in ME, #4,849 nationally) — a middle-class / working-renter tenant base. Strengths: cost of living A+, housing A+, health & safety A+; Watch: employment D+, schools D, amenities F.
- RSU 39 (town): math 82% / reading 83% proficiency, ranked #79 of 112 in ME (top 70%) — strong family-tenant draw, lease renewals of 3-5y typical.
- Market conditions: 83 active listings in the ZIP; 112 units permitted in Aroostook County in 2024 (45 in 5+ unit buildings).
Forward outlook
- Local home prices are declining (-3.0%/yr); year-one equity from $552 of loan paydown is wiped out by about $2k of value loss. Plan a longer hold.
- Aroostook County population projected at -33% by 2050 — secular population decline; favor cash flow + early exit over multi-decade hold.
- At projected returns (-3.0% appreciation + 3.0% rent growth), your $22k cash investment doubles in ~9 years — after that, you're playing with house money.
Negotiation context
- Only 4 days on market — expect competitive offers; lowballing is unlikely to land.
Risks & watch-outs
- Watch-outs: property tax is 3.1% of price; built in 1930 — expect roof / HVAC / electrical / plumbing capex.
Questions for the listing agent
- Built in 1930 — when were the roof, HVAC, electrical panel, plumbing, and water heater last replaced?
- Property tax is high relative to price — has the assessment been appealed recently, and will the sale trigger a re-assessment?
- Is there a deadline driving the sale (1031 exchange, divorce, estate, relocation)? That informs how much negotiation room exists.
- Schools are D-rated, which usually means shorter tenancies and higher turnover. Who's the typical renter profile here, and what's been the actual vacancy rate?
- What's the average days-on-market for RENTAL listings here right now (not sales)? A rising rental-DOM trend means longer vacancies and softer asking-rent achievability than the comps imply.
- What's the recent tenant-quality profile in this submarket — average credit score on applications, eviction rate, late-payment / NSF rate, and stable-employment percentage? A property-management company in the area should have these aggregated.
- How much new for-sale + rental construction is in the pipeline within 1–3 miles? Heavy new supply typically softens prices + rents 12–24 months out; constrained supply supports both.
Investment metrics
- 1% rule
- 1.42% ✓
- Cap rate
- 9.83%
- Cash-on-cash
- 12.63%
- DSCR
- 1.56
- GRM
- 5.9
CMA / ARV
- ARV (on-the-fly)
- $184,600
- Comps found
- 10
Show comp detail 10 sales within ~0.75 mi
| Address | Dist | Beds/Ba | Sqft | Sold | Price | $/sf | Match |
|---|---|---|---|---|---|---|---|
| 39 Park St | 0.19mi | 3/2.0 | 1,296 (-0%) | 9mo | $120,000 | $93 | 81 |
| 33 Elmwood Ave | 0.36mi | 3/1.0 | 1,272 (-2%) | 3mo | $174,900 | $138 | 75 |
| 44 Garden Cir | 0.51mi | 3/1.0 | 1,296 (-0%) | 3mo | $185,000 | $143 | 72 |
| 18 Park St | 0.30mi | 3/1.5 | 1,176 (-10%) | 3mo | $168,000 | $143 | 68 |
| 10 Laurette Cir | 0.37mi | 4/1.0 (+1) | 1,248 (-4%) | 6mo | $178,400 | $143 | 64 |
| 21 Thomas Ave | 0.48mi | 2/1.5 (-1) | 1,401 (+8%) | 2mo | $149,000 | $106 | 59 |
| 13 Elizabeth Ave | 0.68mi | 4/1.0 (+1) | 1,277 (-2%) | 10mo | $179,900 | $141 | 50 |
| 11 Violette St | 0.73mi | 3/1.0 | 1,196 (-8%) | 6mo | $206,000 | $172 | 45 |
| 1 Caroline Ave | 0.42mi | 2/2.0 (-1) | 1,181 (-9%) | 21mo | $95,000 | $80 | 41 |
| 34 Prospect St | 0.65mi | 3/1.5 | 1,176 (-10%) | 20mo | $166,500 | $142 | 37 |
Match score weights: distance 35% · size 25% · config 20% · recency 20%. Top-matched comps best support the ARV.
Projected returns pro-forma
-3.0% appreciation · 3.0% rent growth · sell at horizon
- IRR
- 2.5%
- Equity multiple
- 1.10×
- Total profit
- $2,138
- Equity at exit
- $11,913
- IRR
- 12.1%
- Equity multiple
- 1.96×
- Total profit
- $21,517
- Equity at exit
- $6,908
Cash invested: $22,372 (down + closing). Projections, not guarantees.
Landlord ↔ Tenant lean methodology
- Overall (STATE)
- 41 Moderately Tenant-Leaning
- State Maine
- 41 Moderately Tenant-Leaning · D+2
- County
- — inherits STATE
- City
- — inherits STATE
ZIP-level market 04736
- Home prices YoY
- -18.6%
- Active inventory
- 83
- Price-to-rent
- 5.9×
Monthly cashflow live
- Estimated rent
- $1,133 medium interval (Pro) →
- Mortgage (P&I)
- −$419
- Tax from tax record
- −$207 /mo · $2,485/yr
- Insurance
- −$33
- HOA
- −$0
- Vacancy / Maint / Mgmt
- −$238
- Net cashflow
- $236
Break-even live
UW: 25.0% down · 7.5% · 30yr · 1.5% tax · 5.0% vac · 8.0% maint · 8.0% mgmt
Financing live
Cash to close
- Down payment
- $19,975
- Closing costs
- $2,397
- Reserves months
- —
- Total cash needed
- —
Loan-product check · same deal, 3 products live
Conventional
25% down · 7.5% · 30yr
- Down + closing
- —
- Monthly P&I
- —
- Monthly cashflow
- —
- DSCR
- —
- Eligible?
- —
Personal DTI + credit; lowest rate.
DSCR
20% down · 8.5% · 30yr
- Down + closing
- —
- Monthly P&I
- —
- Monthly cashflow
- —
- DSCR
- —
- Eligible?
- —
No personal income docs; deal must DSCR.
Hard money
10% down · 12.0% · 12mo
- Down + closing
- —
- Monthly P&I
- —
- Monthly cashflow
- —
- DSCR
- —
- Eligible?
- —
Short-term bridge; refi at stabilization.
Listing history 1 events
-
2026-05-22$79,900 Active
ⓘ Source: listings_history table (triggers on properties + properties_extension) + one-shot
backfill from property_details.listing_events for pre-trigger history.
Tax reassessment forecast ME · Partial reset (capped growth)
- Current annual tax
- $2,485 · $207/mo
- Projected year-2 tax
- $2,485 · $207/mo
- Expected delta
- $0/yr ($0/mo · 0.0%)
ⓘ Screening estimate from a state-policy table — verify with the county assessor before closing.
Climate risk First Street
- Flood 1/10 Low FEMA zone X · 0% chance over 30 yrs
- Wildfire 2/10 Low
- Heat 2/10 Low 7 d/yr ≥87°F today · 15 d/yr by 30 yrs out
- Wind 4/10 Moderate 10% chance of damaging wind over 30 yrs
- Air quality 1/10 Low 0 unhealthy d/yr today · 0 by 30 yrs out
Nearby sold comps map
Loading sold comps map…
Walkable amenities ~0.75 mi
Loading nearby amenities…
Taxation est. · year 1
- Rental income
- $13,594
- − Mortgage interest
- −$4,476
- − Property taxes
- −$2,485
- − Insurance
- −$400
- − Repairs & maintenance
- −$1,088
- − Management
- −$1,088
- − Depreciation
- −$2,324
- Taxable income
- $1,734
- Est. tax owed @ 24.0%
- −$416
- After-tax cash flow
- $2,410/yr
For passive investors: Depreciation is non-cash, so a rental often shows a tax loss while cash-flowing — sheltering income. Rental losses are passive: they offset passive income freely, and up to $25,000/yr can offset ordinary (W-2) income if you actively participate and your MAGI is under $100k (phasing out to $0 by $150k); unused losses carry forward. On sale, claimed depreciation is recaptured at up to 25%, and gains may owe capital-gains tax (a 1031 exchange can defer both). Figures are a year-1 estimate at your 24.0% rate — not tax advice; consult a CPA.
Schools (NCES district)
- District
- RSU 39
- NCES district ID
- 2314794
- Math proficiency
- 82% ▲ 55.00%
- Reading proficiency
- 83% ▲ 39.00%
- Median HH income
- $38,159
- Composite
- 68.6/100
- National rank
- #341
- State rank
- #79 of 112 in ME
Livability — Caribou
- Score
- 74/100
- State rank
- #46
- US rank
- #4849
Category grades
Schools grade is shown separately in the Schools card above.
Census & demographics
- Census place
- Caribou, ME
- City population
- 9,107
- Population (ZIP)
- 9,107
Population outlook (Aroostook County) Hauer SSP2
- Today (2025)
- 61,905 people
- By 2030
- 57,815 · -6.6%
- By 2040
- 49,240 · -20.5%
- By 2050
- 41,386 · -33.1%
- By 2075
- 27,664 · -55.3%
- By 2100
- 18,974 · -69.3%
Race, ethnicity, and origin ACS 2023
- Neighborhood character
- Predominantly White (93%)
- Race & ethnicity
- White 93% Two or more races 5%
- Common ancestry
- Lithuanian 28% Slovak 3% Serbian 1%
- Foreign-born
- 3% · Canada
- Languages at home
- 92% English-only · French/Haitian/Cajun 7%
Political lean MEDSL · Aroostook
- 2024 margin
- Strong R (+26.2) · D 36.2% · R 62.4% · Other 1.4%
- 2008→2024 swing
- -35.8pp toward R · 2008: 9.6pp · 2024: -26.2pp
- All cycles
- 2024: R+26.2 2020: R+19.9 2016: R+17.3 2012: D+7.7 2008: D+9.6
Not yet ingested
- Civics
- —
Market trends
- HPI YoY
- ▼ -50.06%
- Current HPI
- 219.5142
- Rent YoY
- —
- Metro
- —
- State GDP YoY
- —
- F500 in state
- 0
Price history
1 event — show timeline
- 2026-05-22 Listed $79,900 MREIS
Property tax history
+4.5%/yrLatest (2024): $2,485 · +9.8% YoY. Source: county tax records.
Cash-flow waterfall
monthlySold comps — $/sqft
last 12 mo · ≤1 miLoading sold comps…