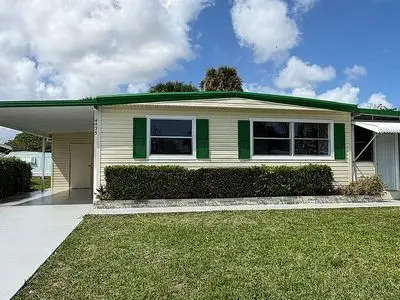
4435 Round Table Ct · Boynton Beach, FL
Flood risk 1/10 · Minimal
- FEMA flood zone
- X (unshaded)
- Chance of flooding over 30 yrs
- 0.0%
- Est. flood insurance / yr
- $507 – $1,088
Fire risk 1/10 · Minimal
- Est. fire insurance / yr
- $947 – $1,759
Heat risk 9/10 · Severe
- Hot days now (above 106°F)
- 5 days/yr
- Hot days in 30 yrs
- 18 days/yr
Wind risk 10/10 · Severe
- Chance of severe wind over 30 yrs
- 99.0%
Air-quality risk 2/10 · Minimal
- Unhealthy air days now
- 1 days/yr
- Unhealthy air days in 30 yrs
- 2 days/yr
Risk factors via First Street. Map © Google.
Why this score? — see what drove the B grade
The composite is a weighted blend of 9 inputs, each scored 0–100. Each bar is that input's sub-score; the figure is the points it added to the 100-point composite (weight × sub-score).
- Cash flow +30.0/30.0
- 1% rule +10.0/10.0
- DSCR +10.0/10.0
- ARV discount +7.5/15.0
- Schools +4.3/10.0
- Condition / age +4.0/5.0
- Livability +3.6/5.0
- Rent growth +2.4/5.0
- Appreciation +0.0/10.0
$124,900
🖨 Deal sheet (PDF) 📄 Offer letter ✓ Due diligence
Listing remarks
Welcome to your dream home at 4435 Round Table CT, Boynton Beach, FL 33436! This stunning manufactured home has been completely remodeled with modern upgrades and thoughtful design throughout. Open Concept Living: Spacious living room, dining area, and kitchen flow seamlessly together, perfect for entertaining and family gatherings. Brand New Appliances: Enjoy cooking with all-new, high-quality kitchen appliances. Fresh Interiors: New drywall on walls and ceilings create a clean, bright, and inviting atmosphere. Bathrooms Fully Renewed: Experience luxury and comfort with totally renovated bathrooms featuring modern fixtures. Extra 3rd Room: Versatile additional room equipped with wall A/C-i
Key facts
- Open concept living
- Brand new appliances
- Completely remodeled
Tags
Neighborhood map
What this means for you Summary
Snapshot
- This is a 3-bed/2.0-bath other listed at $125k. Condition is rated good.
Deal economics
- At list price, monthly cash flow is $1k ($16k/yr) — positive.
- The deal already cash-flows at list — no discount required.
- Meets the 1% rule at list price ($3k rent vs $125k).
- Recommended offer: $121k (3.0% below list) — sets the bar for market timing.
- Cap rate 19.1% vs local median 4.3% in Boynton Beach — top-decile yield for the area; either an underpriced asset or a hidden risk that comps aren't pricing in. Stress-test before assuming the spread holds.
Location & tenants
- Location reads 72/100 on livability (#351 in FL) — a middle-class / working-renter tenant base. Strengths: housing A+, health & safety B+, cost of living B; Watch: amenities D+, crime D-, commute F.
- Palm Beach (suburban): math 46% / reading 53% proficiency, ranked #34 of 73 in FL (top 47%) — families likely to look elsewhere, expect single-tenant / working-renter base with shorter leases.
- Zoned schools: Citrus Cove Elementary School (math 47% / reading 57%, grade C-, #990 of 2,144 statewide, top 48%, 1,026 students, 59% FRL); Congress Community Middle School (math 21% / reading 28%, grade F, #522 of 571 statewide, top 93%, 988 students, 72% FRL); Boynton Beach Community High (math 13% / reading 25%, grade F, #565 of 667 statewide, top 85%, 1,547 students, 65% FRL).
- Zoned-school proficiency averages 32% at this address vs 50% district-wide (-18 pts) — the specific schools serving this property underperform the Palm Beach average; the district grade overstates school quality for this exact location.
- Market conditions: Rents soft (-0.6%/yr); 456 active listings in the ZIP; 40 comparable units currently listed for rent nearby; rentals at typical pace (median 24d on market — plan ~3-4 weeks tenant-placement turnaround); solid renter incomes; 3,974 units permitted in Palm Beach County in 2024 (1,012 in 5+ unit buildings).
- This rent runs 44% of the median local income ($76k/yr) — at the standard rent-burdened threshold; future hikes will face affordability resistance.
Forward outlook
- Local home prices are declining (-3.0%/yr); year-one equity from $864 of loan paydown is wiped out by about $4k of value loss. Plan a longer hold.
- Palm Beach County population projected at +30% by 2050 — long-run rental-demand tailwind backs the buy-and-hold thesis.
- At projected returns (-3.0% appreciation + 0.0% rent growth), your $35k cash investment doubles in ~3 years — after that, you're playing with house money.
Negotiation context
- It's been on market 40 days — a 3% lower offer ($121k) is reasonable based on typical stale-listing flexibility.
Risks & watch-outs
- Climate carrying-cost: severe wind risk, 99% chance of damaging wind over 30y; extreme-heat days projected 5→18/yr by 2055 (HVAC capex compounding) — expect insurance premiums to compound above CPI over the hold.
Questions for the listing agent
- It's been on market 40 days. Have you received any prior offers? Is the seller open to a 3% concession, seller financing, or rate buy-down credit?
- Built in 1979 — when were the roof, HVAC, electrical panel, plumbing, and water heater last replaced?
- Is there a deadline driving the sale (1031 exchange, divorce, estate, relocation)? That informs how much negotiation room exists.
- Crime grade is D in this area — have there been break-ins, vandalism, or insurance claims at this property in the last 3 years? What carrier currently insures it and at what premium?
- What's the average days-on-market for RENTAL listings here right now (not sales)? A rising rental-DOM trend means longer vacancies and softer asking-rent achievability than the comps imply.
- What's the recent tenant-quality profile in this submarket — average credit score on applications, eviction rate, late-payment / NSF rate, and stable-employment percentage? A property-management company in the area should have these aggregated.
- How much new for-sale + rental construction is in the pipeline within 1–3 miles? Heavy new supply typically softens prices + rents 12–24 months out; constrained supply supports both.
Investment metrics
- 1% rule
- 2.23% ✓
- Cap rate
- 19.13%
- Cash-on-cash
- 45.85%
- DSCR
- 3.04
- GRM
- 3.7
CMA / ARV
No comps found within radius.
Projected returns pro-forma
-3.0% appreciation · 0.0% rent growth · sell at horizon
- IRR
- 39.6%
- Equity multiple
- 2.62×
- Total profit
- $56,755
- Equity at exit
- $18,623
- IRR
- 44.5%
- Equity multiple
- 4.65×
- Total profit
- $127,653
- Equity at exit
- $10,799
Cash invested: $34,972 (down + closing). Projections, not guarantees.
Landlord ↔ Tenant lean methodology
- Overall (STATE)
- 87 Strongly Landlord-Friendly
- State Florida
- 87 Strongly Landlord-Friendly · R+3
- County
- — inherits STATE
- City
- — inherits STATE
ZIP-level market 33436
- Home prices YoY
- -26.0%
- Rents YoY
- -0.6%
- Active inventory
- 456
- Price-to-rent
- 3.7×
Monthly cashflow live
- Estimated rent
- $2,784 high interval (Pro) →
- Mortgage (P&I)
- −$655
- Tax est. 1.5%
- −$156 /mo · $1,874/yr
- Insurance
- −$52
- HOA
- −$0
- Vacancy / Maint / Mgmt
- −$585
- Net cashflow
- $1,336
Break-even live
Sensitivity live
| Price | -10% $1,423 | -5% $1,379 | +0% $1,336 | +5% $1,293 | +10% $1,250 |
|---|---|---|---|---|---|
| Rent | -10% $1,116 | -5% $1,226 | +0% $1,336 | +5% $1,446 | +10% $1,556 |
| Rate | -1.0pp $1,399 | -0.5pp $1,368 | base $1,336 | +0.5pp $1,304 | +1.0pp $1,271 |
UW: 25.0% down · 7.5% · 30yr · 1.5% tax · 5.0% vac · 8.0% maint · 8.0% mgmt
Financing live
Cash to close
- Down payment
- $31,225
- Closing costs
- $3,747
- Reserves months
- —
- Total cash needed
- —
Loan-product check · same deal, 3 products live
Conventional
25% down · 7.5% · 30yr
- Down + closing
- —
- Monthly P&I
- —
- Monthly cashflow
- —
- DSCR
- —
- Eligible?
- —
Personal DTI + credit; lowest rate.
DSCR
20% down · 8.5% · 30yr
- Down + closing
- —
- Monthly P&I
- —
- Monthly cashflow
- —
- DSCR
- —
- Eligible?
- —
No personal income docs; deal must DSCR.
Hard money
10% down · 12.0% · 12mo
- Down + closing
- —
- Monthly P&I
- —
- Monthly cashflow
- —
- DSCR
- —
- Eligible?
- —
Short-term bridge; refi at stabilization.
Rent comps 40 comps
| Address | Beds | Baths | Sqft | Rent | $/sqft | DOM | Units | Dist |
|---|---|---|---|---|---|---|---|---|
| 8949 Oak St Boynton Beach, FL | 2.0 | 2.0 | 1040 | $1,300 | $1.25 | 26d | 1 | 0.33mi |
| 8202 White Rock Cir Boynton Beach, FL | 3.0 | 2.0 | 1738 | $3,300 | $1.90 | 9d | 1 | 0.35mi |
| 4045 White Pine Dr Boynton Beach, FL | 3.0 | 2.0 | 1566 | $1,800 | $1.15 | 3d | 1 | 0.48mi |
| 3930 Max Pl Boynton Beach, FL | 2.0 | 2.0 | 1250 | $2,370 | $1.90 | 1d | 1 | 0.71mi |
| 3930 Max Pl Boynton Beach, FL | 3.0 | 2.0 | 1550 | $2,825 | $1.82 | 26d | 1 | 0.71mi |
| 3736 Coelebs Ave Boynton Beach, FL | 3.0 | 2.0 | 1232 | $3,000 | $2.44 | 26d | 1 | 0.78mi |
| 3500 Sandpiper Dr Boynton Beach, FL | 1.0–2.0 | 1.0–2.0 | 1147 | $2,579 | $2.25 | 23d | 22 | 0.81mi |
| 920 Sun Acres Ln Boynton Beach, FL | 2.0 | 2.0 | 1352 | $2,200 | $1.63 | 26d | 1 | 0.85mi |
| 3962 Winfield Rd Unit 3962 Boynton Beach, FL | 4.0 | 2.0 | 1592 | $3,300 | $2.07 | 15d | 1 | 0.87mi |
| 3962 Winfield Rd Boynton Beach, FL | 4.0 | 2.0 | 1592 | $3,300 | $2.07 | 1d | 1 | 0.87mi |
| 3962 Winfield Rd Boynton Beach, FL | 4.0 | 2.0 | 1592 | $3,300 | $2.07 | 16d | 1 | 0.87mi |
| 190 Temple Ave Boynton Beach, FL | 3.0 | 2.0 | 1781 | $4,200 | $2.36 | 26d | 1 | 0.91mi |
| 4296 Grove Park Ln Boynton Beach, FL | 3.0 | 2.0 | 1696 | $3,350 | $1.98 | 26d | 1 | 0.95mi |
| 9498 S Military Trl #5 Boynton Beach, FL | 3.0 | 2.5 | 1317 | $2,900 | $2.20 | 26d | 1 | 0.98mi |
| 4220 Grove Park Ln Unit 1 Boynton Beach, FL | 3.0 | 2.0 | 1406 | $3,400 | $2.42 | 5d | 1 | 0.99mi |
| 4220 Grove Park Ln Unit 1 Boynton Beach, FL | 3.0 | 2.0 | 1406 | $3,600 | $2.56 | 26d | 1 | 0.99mi |
| 7705 Forest Green Ln Boynton Beach, FL | 2.0 | 2.0 | 1379 | $3,200 | $2.32 | 19d | 1 | 1.02mi |
| 7705 Forest Green Ln Boynton Beach, FL | 3.0 | 2.0 | 1379 | $3,200 | $2.32 | 26d | 1 | 1.02mi |
| 5072 Arbor Glen Cir Lake Worth, FL | 3.0 | 2.0 | 1232 | $3,300 | $2.68 | 16d | 1 | 1.06mi |
| 7640 Forest Green Ln Boynton Beach, FL | 3.0 | 2.0 | 1696 | $3,500 | $2.06 | 26d | 1 | 1.08mi |
| 7640 Forest Green Ln Unit 7640 Boynton Beach, FL | 3.0 | 2.0 | 1696 | $3,500 | $2.06 | 12d | 1 | 1.08mi |
| 4259 Wood Ride Unit E Boynton Beach, FL | 2.0 | 2.0 | 1240 | $2,350 | $1.90 | 9d | 1 | 1.13mi |
| 1239 Sussex St Boynton Beach, FL | 3.0 | 2.0 | 1436 | $3,100 | $2.16 | 21d | 1 | 1.14mi |
| 1239 Sussex St Boynton Beach, FL | 3.0 | 2.0 | 1436 | $3,100 | $2.16 | 26d | 1 | 1.14mi |
| 9766 Kamena Cir Boynton Beach, FL | 3.0 | 2.5 | 1596 | $3,300 | $2.07 | 7d | 1 | 1.15mi |
| 1515 Arezzo Cir Boynton Beach, FL | 2.0 | 2.5 | 1286 | $2,750 | $2.14 | 26d | 1 | 1.15mi |
| 1620 Cetona Dr Boynton Beach, FL | 4.0 | 2.0 | 1681 | $3,200 | $1.90 | 26d | 1 | 1.15mi |
| 3561 Oberon Ave Boynton Beach, FL | 3.0 | 2.0 | 1248 | $2,850 | $2.28 | 22d | 1 | 1.18mi |
| 220 Savannah Lakes Dr Boynton Beach, FL | 2.0 | 2.0 | 1098 | $2,365 | $2.15 | 4d | 1 | 1.19mi |
| 5155 Europa Dr Unit J Boynton Beach, FL | 3.0 | 2.0 | 1333 | $2,750 | $2.06 | 26d | 1 | 1.22mi |
| 5537 Pebble Brook Ln Boynton Beach, FL | 3.0 | 2.0 | 1166 | $2,825 | $2.42 | 16d | 1 | 1.22mi |
| 9873 Lawrence Rd Boynton Beach, FL | 2.0 | 2.0 | 1200 | $2,315 | $1.93 | 5d | 1 | 1.24mi |
| 9873 Lawrence Rd Boynton Beach, FL | 2.0 | 2.0 | 1200 | $2,267 | $1.89 | 23d | 1 | 1.24mi |
| 9900 Pineapple Tree Dr #106 Boynton Beach, FL | 2.0 | 2.0 | 1008 | $2,250 | $2.23 | 26d | 1 | 1.25mi |
| 4101 Mahogany Dr Boynton Beach, FL | 1.0–2.0 | 1.0–2.0 | 950 | $2,159 | $2.27 | 1d | 12 | 1.26mi |
| 5373 Mirror Lakes Blvd Boynton Beach, FL | 3.0 | 2.0 | 1310 | $2,100 | $1.60 | 26d | 1 | 1.27mi |
| 107 Buttonwood Ln Unit 107 Boynton Beach, FL | 2.0 | 2.5 | 1264 | $2,600 | $2.06 | 26d | 1 | 1.28mi |
| 9842 Kamena Cir Boynton Beach, FL | 3.0 | 2.5 | 1596 | $2,800 | $1.75 | 26d | 1 | 1.29mi |
| 2303 N Congress Ave #15 Boynton Beach, FL | 2.0 | 1.0 | 925 | $1,950 | $2.11 | 26d | 1 | 1.29mi |
| 2305 N Congress Ave #18 Boynton Beach, FL | 3.0 | 2.0 | 1217 | $2,600 | $2.14 | 16d | 1 | 1.29mi |
Listing history 13 events
-
2026-06-21days on market $124,900 Active 40 DOM
-
2026-06-18days on market $124,900 Active 37 DOM
-
2026-06-17days on market $124,900 Active 36 DOM
-
2026-06-16days on market $124,900 Active 35 DOM
-
2026-06-15days on market $124,900 Active 34 DOM
-
2026-06-13days on market $124,900 Active 32 DOM
-
2026-06-09days on market $124,900 Active 28 DOM
-
2026-06-07days on market $124,900 Active 26 DOM
-
2026-06-04days on market $124,900 Active 23 DOM
-
2026-06-03days on market $124,900 Active 22 DOM
-
2026-06-01days on market $124,900 Active 20 DOM
-
2026-05-31days on market $124,900 Active 19 DOM
-
2026-05-12$124,900 Active
ⓘ Source: listings_history table (triggers on properties + properties_extension) + one-shot
backfill from property_details.listing_events for pre-trigger history.
Climate risk First Street
- Flood 1/10 Low FEMA zone X (unshaded) · 0% chance over 30 yrs
- Wildfire 1/10 Low
- Heat 9/10 Extreme 5 d/yr ≥106°F today · 18 d/yr by 30 yrs out
- Wind 10/10 Extreme 99% chance of damaging wind over 30 yrs
- Air quality 2/10 Low 1 unhealthy d/yr today · 2 by 30 yrs out
Nearby sold comps map
Loading sold comps map…
Walkable amenities ~0.75 mi
Loading nearby amenities…
Taxation est. · year 1
- Rental income
- $33,410
- − Mortgage interest
- −$6,996
- − Property taxes
- −$1,874
- − Insurance
- −$624
- − Repairs & maintenance
- −$2,673
- − Management
- −$2,673
- − Depreciation
- −$3,633
- Taxable income
- $14,936
- Est. tax owed @ 24.0%
- −$3,585
- After-tax cash flow
- $12,451/yr
For passive investors: Depreciation is non-cash, so a rental often shows a tax loss while cash-flowing — sheltering income. Rental losses are passive: they offset passive income freely, and up to $25,000/yr can offset ordinary (W-2) income if you actively participate and your MAGI is under $100k (phasing out to $0 by $150k); unused losses carry forward. On sale, claimed depreciation is recaptured at up to 25%, and gains may owe capital-gains tax (a 1031 exchange can defer both). Figures are a year-1 estimate at your 24.0% rate — not tax advice; consult a CPA.
Condition & rehab AI · 1 photo
This well-maintained, fully remodeled manufactured home is move-in ready with modern upgrades and a fresh, inviting interior. It offers a great opportunity for investors looking to capitalize on its current condition and potential for further improvements.
Value-add opportunities
- Both Painting exterior and interior — Enhances curb appeal and interior brightness
- Both Landscaping improvements — Enhances curb appeal and property value
- Both New flooring in bathrooms — Improves aesthetics and functionality
- Both New kitchen appliances — Enhances functionality and appeal
Renovation cost estimate screening
Value-add ROI direction
- Both Painting exterior and interior — Enhances curb appeal and interior brightness ↑
- Both Landscaping improvements — Enhances curb appeal and property value ↑
- Both New flooring in bathrooms — Improves aesthetics and functionality ↑
- Both New kitchen appliances — Enhances functionality and appeal ↑
ⓘ Cost ranges are severity-bucket heuristics (US national rule-of-thumb). Get contractor quotes + a written scope before underwriting a rehab budget.
Schools (NCES district)
- District
- Palm Beach
- NCES district ID
- 1201500
- Math proficiency
- 46% ▼ -16.00%
- Reading proficiency
- 53% ▼ -4.00%
- Median HH income
- $53,943
- Composite
- 42.72/100
- National rank
- #3160
- State rank
- #34 of 73 in FL
Livability — Boynton Beach
- Score
- 72/100
- State rank
- #351
- US rank
- #6098
Category grades
Schools grade is shown separately in the Schools card above.
Census & demographics
- Census place
- Boynton Beach, FL
- County
- Palm Beach County · 1,438,312 people
- City population
- 123,167
- Metro
- Miami-Fort Lauderdale-Pompano Beach, FL
- Population (ZIP)
- 48,743
- Household income
- $75,789
- Rent vs Own
- Severe rent burden
- 1813.0
Population outlook (Palm Beach County) Hauer SSP2
- Today (2025)
- 1,637,487 people
- By 2030
- 1,743,255 · +6.5%
- By 2040
- 1,948,712 · +19.0%
- By 2050
- 2,132,979 · +30.3%
- By 2075
- 2,530,027 · +54.5%
- By 2100
- 2,706,979 · +65.3%
Race, ethnicity, and origin ACS 2023
- Neighborhood character
- Diverse neighborhood (Simpson 0.64)
- Race & ethnicity
- White 52% Black 24% Hispanic / Latino 19% Two or more races 10% Asian 2%
- Hispanic origin (detail)
- Mexican 2% Puerto Rican 4% Cuban 3% Dominican 1%
- Common ancestry
- Hispanic 12% Romanian 3% Scotch-Irish 2%
- Foreign-born
- 27% · Canada, Jamaica, Vietnam
- Languages at home
- 64% English-only · Spanish 14% French/Haitian/Cajun 13% Other Indo-European 2%
Political lean MEDSL · Palm Beach
- 2024 margin
- Toss-up / Even · D 50.0% · R 49.2%
- 2008→2024 swing
- -22.1pp toward R · 2008: 22.9pp · 2024: 0.8pp
- All cycles
- 2024: D+0.8 2020: D+12.8 2016: D+15.3 2012: D+17.0 2008: D+22.9
Not yet ingested
- Civics
- —
Market trends
- HPI YoY
- ▼ -109.59%
- Current HPI
- 311.7742
- Rent YoY
- ▼ -0.57%
- Metro
- Miami-Fort Lauderdale-Pompano Beach, FL
- State GDP YoY
- ▲ 3.28%
- F500 in state
- 36
Industry mix (Fortune 500 HQ in FL)
| Industry | F500 HQs | Revenue |
|---|---|---|
| Industrial Technology | 2 | $29B |
|
||
| Insurance | 2 | $17B |
|
||
| Retail | 1 | $60B |
|
||
| Technology Distribution | 1 | $58B |
|
||
| Homebuilding | 1 | $35B |
|
||
| Technology Manufacturing | 1 | $35B |
|
||
Price history
1 event — show timeline
- 2026-05-12 Listed $124,900 FSBO.com
Cash-flow waterfall
monthlySold comps — $/sqft
last 12 mo · ≤1 miLoading sold comps…