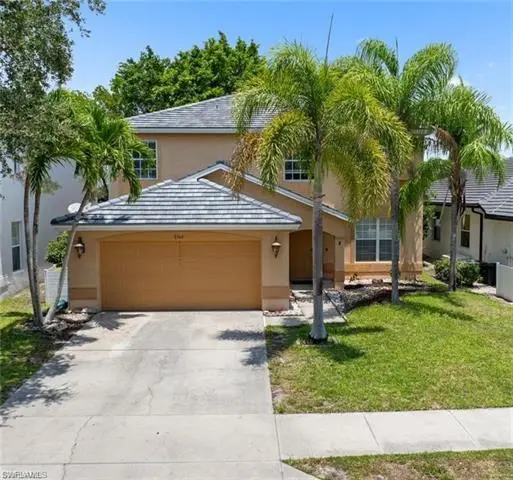
8364 Laurel Lakes Blvd · Island Walk, FL
Flood risk 1/10 · Minimal
- FEMA flood zone
- X (shaded)
- Chance of flooding over 30 yrs
- 0.0%
- Est. flood insurance / yr
- $507 – $1,088
Fire risk 5/10 · Moderate
- Est. fire insurance / yr
- $947 – $1,759
Heat risk 10/10 · Severe
- Hot days now (above 107°F)
- 7 days/yr
- Hot days in 30 yrs
- 30 days/yr
Wind risk 10/10 · Severe
- Chance of severe wind over 30 yrs
- 99.0%
Air-quality risk 2/10 · Minimal
- Unhealthy air days now
- 2 days/yr
- Unhealthy air days in 30 yrs
- 2 days/yr
Risk factors via First Street. Map © Google.
Why this score? — see what drove the F grade
The composite is a weighted blend of 9 inputs, each scored 0–100. Each bar is that input's sub-score; the figure is the points it added to the 100-point composite (weight × sub-score).
- ARV discount +7.5/15.0
- Cash flow +5.3/30.0
- Schools +5.0/10.0
- Livability +3.2/5.0
- Condition / age +2.5/5.0
- Rent growth +1.9/5.0
- 1% rule +0.4/10.0
- DSCR +0.0/10.0
- Appreciation +0.0/10.0
$615,000
🖨 Deal sheet 📄 Offer letter ✓ Due diligence
Listing remarks
One or more photo(s) has been virtually staged, AI generated or rendered. Incredible opportunity in an incredible North Naples community! HUGE home (over 3000 sq ft!) now available with so much value! 2 stories, 5bedrooms PLUS a den, and 3 FULL baths (with one bedroom and bathroom downstairs)! Formal living and dining, casual living and dining, a breakfast bar, massive kitchen with a large pantry, NEW ROOF, and a large fenced in yard with PLENTY of room for a pool! Just a little TLC, and this home will meet all your needs! With low HOA fees, in a community with great amenities, you will love living here! You can't beat the location, in an A rated school district, minutes to our beautiful be
Key facts
- Minutes to beaches
- New roof
- Large fenced in yard
Tags
Property features AI
Finance
- Other: Deeded restrictions: no commercial
- Financial info: Total annual recurring HOA fees: $2,508; Total one-time fees: $1,150; Master HOA fee: $627 quarterly
- HOA & community: Mandatory HOA; Quarterly master HOA fee; Master association fee covers recreation facilities, irrigation water, street maintenance, street lights, manager, legal/accounting; Professional management; Community amenities include clubhouse, community pool, community spa/hot tub, exercise room, tennis and basketball courts, play area, sidewalks, underground utilities
Exterior
- Parking: Attached 2-car garage
- Security: Completely fenced yard; Entry keypad; Gated community; Manual shutters
- Utilities: Central water; Central sewer; Cable available
- Home design: Residential single-family home; Two-story; Rear exposure facing east; Located in Laurel Lakes (gated community)
- Construction: Concrete block construction; Stucco exterior; Tile roof; Built in 2004
- Exterior features: Fence; Patio; Room for pool; Landscaped view; Central irrigation
Interior
- Kitchen: Pantry; Dishwasher; Disposal; Microwave; Range; Refrigerator/freezer; Self-cleaning oven; Wine cooler
- Bedrooms: Five bedrooms plus a den; First-floor bedroom; Master bedroom upstairs; Split bedroom floor plan
- Flooring: Carpet; Tile
- Bathrooms: Three full bathrooms; Master bath with dual sinks and separate tub and shower
- Heating & cooling: Central electric heat; Central electric cooling; Ceiling fans
- Interior features: French doors; High-speed internet available; Laundry tub; Pantry; Smoke detectors; Volume ceilings; Walk-in closet(s); Window coverings; Den/study; Family room; Laundry in residence; Screened lanai/porch; Unfurnished
- Laundry & utility: Washer; Dryer; Laundry tub
Neighborhood map
What this means for you Summary
Snapshot
- This is a 5-bed/3.0-bath single-family listed at $615k.
Deal economics
- At list price, monthly cash flow is $-1k ($-16k/yr) — negative.
- To cash-flow at today's rent, offer at most $374k (39.3% below list).
- To meet the 1% rule (rent ≥ 1% of price), the offer needs to be $335k (45.5% below list).
- Recommended offer: $335k (45.5% below list) — sets the bar for 1% rule.
Location & tenants
- Location reads 64/100 on livability (#692 in FL) — a middle-class / working-renter tenant base. Strengths: crime A+, employment A+, housing B+; Watch: health & safety D, amenities F, commute F.
- Collier (suburban): math 60% / reading 56% proficiency, ranked #16 of 73 in FL (top 22%) — acceptable for families but not a draw, mixed tenant base, ~2y average lease.
- Market conditions: Rents soft (-2.5%/yr); 586 active listings in the ZIP; 18 comparable units currently listed for rent nearby; rentals at typical pace (median 21d on market — plan ~3-4 weeks tenant-placement turnaround); high-income renter base; 3,520 units permitted in Collier County in 2024 (959 in 5+ unit buildings).
- This rent runs 35% of the median local income ($113k/yr) — at the standard rent-burdened threshold; future hikes will face affordability resistance.
Forward outlook
- Local home prices are declining (-3.0%/yr); year-one equity from $4k of loan paydown is wiped out by about $18k of value loss. Plan a longer hold.
- Collier County population projected at +30% by 2050 — long-run rental-demand tailwind backs the buy-and-hold thesis.
Negotiation context
- It's been on market 29 days — a 2% lower offer ($606k) is reasonable based on typical stale-listing flexibility.
- 5 sale attempts since 8y ago with the ask held roughly flat each time — persistent listings suggest the price (not the market) is what's stuck; bring a comps-based counter.
- Current owner paid $440k; 40% above their basis — modest negotiation headroom, anchor on the comps not their cost.
Risks & watch-outs
- Climate carrying-cost: severe wind risk, 99% chance of damaging wind over 30y; moderate wildfire risk; extreme-heat days projected 7→30/yr by 2055 (HVAC capex compounding) — expect insurance premiums to compound above CPI over the hold.
Questions for the listing agent
- What do current leases actually rent for vs. the listed asking? Can we see a recent rent roll and the last 12 months of T-12 income?
- What does the HOA fee cover, when was the last increase, and are there any pending special assessments or reserve-fund shortfalls?
- Is there a deadline driving the sale (1031 exchange, divorce, estate, relocation)? That informs how much negotiation room exists.
- The area grade is low — what's the realistic commute time and amenity access for the typical tenant pool here? Any planned neighborhood developments (good or bad) we should know about?
- What's the average days-on-market for RENTAL listings here right now (not sales)? A rising rental-DOM trend means longer vacancies and softer asking-rent achievability than the comps imply.
- What's the recent tenant-quality profile in this submarket — average credit score on applications, eviction rate, late-payment / NSF rate, and stable-employment percentage? A property-management company in the area should have these aggregated.
- How much new for-sale + rental construction is in the pipeline within 1–3 miles? Heavy new supply typically softens prices + rents 12–24 months out; constrained supply supports both.
Investment metrics
- 1% rule
- 0.54% ✗
- Cap rate
- 3.63%
- Cash-on-cash
- -9.52%
- DSCR
- 0.58
- GRM
- 15.3
CMA / ARV
No comps found within radius.
Projected returns pro-forma
-3.0% appreciation · 0.0% rent growth · sell at horizon
- IRR
- -36.4%
- Equity multiple
- -0.14×
- Total profit
- $-196,607
- Equity at exit
- $91,698
- IRR
- -71.8%
- Equity multiple
- -0.87×
- Total profit
- $-321,611
- Equity at exit
- $53,174
Cash invested: $172,200 (down + closing). Projections, not guarantees.
Landlord ↔ Tenant lean methodology
- Overall (STATE)
- 87 Strongly Landlord-Friendly
- State Florida
- 87 Strongly Landlord-Friendly · R+3
- County
- — inherits STATE
- City
- — inherits STATE
ZIP-level market 34119
- Rents YoY
- -2.5%
- Active inventory
- 586
- Price-to-rent
- 15.3×
Monthly cashflow live
- Estimated rent
- $3,351 high interval (Pro) →
- Mortgage (P&I)
- −$3,225
- Tax from tax record
- −$324 /mo · $3,882/yr
- Insurance
- −$256
- HOA
- −$209
- Vacancy / Maint / Mgmt
- −$704
- Net cashflow
- $-1,367
Break-even live
UW: 25.0% down · 7.5% · 30yr · 1.5% tax · 5.0% vac · 8.0% maint · 8.0% mgmt
Financing live
Cash to close
- Down payment
- $153,750
- Closing costs
- $18,450
- Reserves months
- —
- Total cash needed
- —
Loan-product check · same deal, 3 products live
Conventional
25% down · 7.5% · 30yr
- Down + closing
- —
- Monthly P&I
- —
- Monthly cashflow
- —
- DSCR
- —
- Eligible?
- —
Personal DTI + credit; lowest rate.
DSCR
20% down · 8.5% · 30yr
- Down + closing
- —
- Monthly P&I
- —
- Monthly cashflow
- —
- DSCR
- —
- Eligible?
- —
No personal income docs; deal must DSCR.
Hard money
10% down · 12.0% · 12mo
- Down + closing
- —
- Monthly P&I
- —
- Monthly cashflow
- —
- DSCR
- —
- Eligible?
- —
Short-term bridge; refi at stabilization.
Rent comps 18 comps
| Address | Beds | Baths | Sqft | Rent | $/sqft | DOM | Units | Dist |
|---|---|---|---|---|---|---|---|---|
| 87 Burnt Pine Dr Naples, FL | 4.0 | 2.0 | 1921 | $3,500 | $1.82 | 23d | 1 | 0.40mi |
| 14895 Pleasant Bay Ln Apt 5202 Naples, FL | 4.0 | 3.0 | 1528 | $2,100 | $1.37 | 13d | 1 | 0.59mi |
| 14815 Triangle Bay Dr Naples, FL | 2.0–4.0 | 2.0–4.0 | 1214 | $1,809 | $1.49 | 13d | 11 | 0.67mi |
| 14732 Sutherland Ave #332 Naples, FL | 4.0 | 2.5 | 2002 | $2,550 | $1.27 | 23d | 1 | 0.81mi |
| 14732 Sutherland Ave Naples, FL | 4.0 | 3.0 | 2002 | $2,550 | $1.27 | 23d | 1 | 0.81mi |
| 14886 Toscana Way Naples, FL | 4.0 | 2.0 | 2100 | $4,200 | $2.00 | 23d | 1 | 0.82mi |
| 7073 Venice Way #2701 Naples, FL | 4.0 | 3.0 | 1828 | $3,241 | $1.77 | 23d | 1 | 1.41mi |
| 7081 Venice Way #1808 Naples, FL | 4.0 | 3.0 | 1833 | $3,241 | $1.77 | 23d | 1 | 1.42mi |
| 9444 Glenforest Dr Naples, FL | 4.0 | 3.0 | 2034 | $3,400 | $1.67 | 13d | 1 | 1.45mi |
| 7051 Ambrosia Ln #3501 Naples, FL | 4.0 | 3.0 | 1828 | $2,996 | $1.64 | 23d | 1 | 1.45mi |
| 1638 Triangle Palm Ter Naples, FL | 4.0 | 2.0 | 2028 | $10,000 | $4.93 | 13d | 1 | 1.45mi |
| 7047 Ambrosia Ln Naples, FL | 3.0–4.0 | 2.5–3.0 | 1753 | $3,363 | $1.92 | 13d | 38 | 1.48mi |
| 7012 Romana Way #1403 Naples, FL | 4.0 | 2.5 | 1828 | $3,291 | $1.80 | 21d | 1 | 1.48mi |
| 7012 Romana Way #1408 Naples, FL | 4.0 | 3.0 | 1828 | $3,210 | $1.76 | 21d | 1 | 1.48mi |
| 7012 Romana Way #1406 Naples, FL | 4.0 | 2.5 | 1828 | $3,328 | $1.82 | 21d | 1 | 1.48mi |
| 7012 Romana Way #1401 Naples, FL | 4.0 | 3.0 | 1828 | $3,216 | $1.76 | 21d | 1 | 1.48mi |
| 7044 Ambrosia Ln #104 Naples, FL | 4.0 | 2.5 | 1828 | $3,288 | $1.80 | 21d | 1 | 1.50mi |
| 7044 Ambrosia Ln #101 Naples, FL | 4.0 | 3.0 | 1828 | $3,145 | $1.72 | 21d | 1 | 1.50mi |
HOA detail
- Monthly dues
- $209 · $2,508/yr
- Likely covers
- pool
Listing history 35 events
-
2026-06-18days on market $615,000 Active 29 DOM
-
2026-06-17days on market $615,000 Active 28 DOM
-
2026-06-16days on market $615,000 Active 27 DOM
-
2026-06-15days on market $615,000 Active 26 DOM
-
2026-06-14days on market $615,000 Active 24 DOM
-
2026-06-10days on market $615,000 Active 21 DOM
-
2026-06-09days on market $615,000 Active 20 DOM
-
2026-06-08days on market $615,000 Active 19 DOM
-
2026-06-07days on market $615,000 Active 18 DOM
-
2026-06-03days on market $615,000 Active 14 DOM
-
2026-06-02days on market $615,000 Active 13 DOM
-
2026-06-01days on market $615,000 Active 12 DOM
-
2026-05-31days on market $615,000 Active 11 DOM
-
2026-05-30days on market $615,000 Active 10 DOM
-
2026-05-20$615,000 Active
-
2026-05-16historical
-
2026-05-14price $615,000
-
2026-04-18price $635,000
-
2026-03-26price $649,000
-
2026-03-26status Active
-
2026-01-27historical
-
2026-01-22status Pending With Contingencies
-
2025-11-30price $655,000
-
2025-11-21$665,000 Active
-
2025-11-15historical
-
2025-10-09price $675,000
-
2025-09-15price $699,999
-
2025-06-24price $720,000
-
2025-06-10price $740,000
-
2025-05-28$750,000 Active
-
2018-09-07soldstatus $440,000 Sold
-
2018-08-01status Pending With Contingencies
-
2018-05-18price $449,000
-
2018-04-27$460,000 Active
-
2003-05-27soldstatus $4,631,200
ⓘ Source: listings_history table (triggers on properties + properties_extension) + one-shot
backfill from property_details.listing_events for pre-trigger history.
Tax reassessment forecast FL · Resets to sale price
- Current annual tax
- $3,882 · $324/mo
- Projected year-2 tax
- $5,104 · $425/mo
- Expected delta
- +$1,222/yr (+$102/mo · 31.5%)
ⓘ Screening estimate from a state-policy table — verify with the county assessor before closing.
Climate risk First Street
- Flood 1/10 Low FEMA zone X (shaded) · 0% chance over 30 yrs
- Wildfire 5/10 Major
- Heat 10/10 Extreme 7 d/yr ≥107°F today · 30 d/yr by 30 yrs out
- Wind 10/10 Extreme 99% chance of damaging wind over 30 yrs
- Air quality 2/10 Low 2 unhealthy d/yr today · 2 by 30 yrs out
Nearby sold comps map
Loading sold comps map…
Walkable amenities ~0.75 mi
Loading nearby amenities…
Taxation est. · year 1
- Rental income
- $40,214
- − Mortgage interest
- −$34,450
- − Property taxes
- −$3,882
- − Insurance
- −$3,075
- − Repairs & maintenance
- −$3,217
- − Management
- −$3,217
- − HOA
- −$2,508
- − Depreciation
- −$17,891
- Taxable loss
- −$28,027
- Est. tax savings @ 24.0%
- +$6,726
- After-tax cash flow
- $-9,672/yr
For passive investors: Depreciation is non-cash, so a rental often shows a tax loss while cash-flowing — sheltering income. Rental losses are passive: they offset passive income freely, and up to $25,000/yr can offset ordinary (W-2) income if you actively participate and your MAGI is under $100k (phasing out to $0 by $150k); unused losses carry forward. On sale, claimed depreciation is recaptured at up to 25%, and gains may owe capital-gains tax (a 1031 exchange can defer both). Figures are a year-1 estimate at your 24.0% rate — not tax advice; consult a CPA.
Schools (NCES district)
- District
- Collier
- NCES district ID
- 1200330
- Math proficiency
- 60% ▼ -4.00%
- Reading proficiency
- 56% ▼ -2.00%
- Median HH income
- $58,275
- Composite
- 50.23/100
- National rank
- #1892
- State rank
- #16 of 73 in FL
Livability — Island Walk
- Score
- 64/100
- State rank
- #692
- US rank
- #14444
Category grades
Schools grade is shown separately in the Schools card above.
Census & demographics
- County
- Collier County · 396,295 people
- Metro
- Naples-Marco Island, FL
- Population (ZIP)
- 36,807
- Household income
- $113,391
- Rent vs Own
- Severe rent burden
- 741.0
Population outlook (Collier County) Hauer SSP2
- Today (2025)
- 420,858 people
- By 2030
- 450,054 · +6.9%
- By 2040
- 502,232 · +19.3%
- By 2050
- 544,932 · +29.5%
- By 2075
- 627,203 · +49.0%
- By 2100
- 659,015 · +56.6%
Race, ethnicity, and origin ACS 2023
- Neighborhood character
- Predominantly White (74%)
- Race & ethnicity
- White 74% Hispanic / Latino 20% Two or more races 14% Black 1%
- Hispanic origin (detail)
- Mexican 6% Puerto Rican 2% Cuban 4% Dominican 2%
- Common ancestry
- Romanian 4% Lithuanian 2% Italian 2%
- Foreign-born
- 17% · Canada, Jamaica, Dominican Republic
- Languages at home
- 78% English-only · Spanish 15% Other Indo-European 3% Russian/Polish/Slavic 1%
Political lean MEDSL · Collier
- 2024 margin
- Solid R (+33.1) · D 33.1% · R 66.2%
- 2008→2024 swing
- -10.6pp toward R · 2008: -22.5pp · 2024: -33.1pp
- All cycles
- 2024: R+33.1 2020: R+24.7 2016: R+26.0 2012: R+30.1 2008: R+22.5
Not yet ingested
- Civics
- —
Market trends
- HPI YoY
- ▼ -243.12%
- Current HPI
- 269.3208
- Rent YoY
- ▼ -2.51%
- Metro
- Naples-Marco Island, FL
- State GDP YoY
- ▲ 3.28%
- F500 in state
- 36
Industry mix (Fortune 500 HQ in FL)
| Industry | F500 HQs | Revenue |
|---|---|---|
| Industrial Technology | 2 | $29B |
|
||
| Insurance | 2 | $17B |
|
||
| Retail | 1 | $60B |
|
||
| Technology Distribution | 1 | $58B |
|
||
| Homebuilding | 1 | $35B |
|
||
| Technology Manufacturing | 1 | $35B |
|
||
Price history
-86.7% since first listed21 events — show timeline
- 2026-05-20 Listed $615,000 NAPLESMLS
- 2026-05-16 Listing Removed — NAPLESMLS
- 2026-05-14 Price Changed $615,000 NAPLESMLS
- 2026-04-18 Price Changed $635,000 NAPLESMLS
- 2026-03-26 Price Changed $649,000 NAPLESMLS
- 2026-03-26 Relisted — NAPLESMLS
- 2026-01-27 Listing Removed — NAPLESMLS
- 2026-01-22 Pending — NAPLESMLS
- 2025-11-30 Price Changed $655,000 NAPLESMLS
- 2025-11-21 Listed $665,000 NAPLESMLS
- 2025-11-15 Listing Removed — NAPLESMLS
- 2025-10-09 Price Changed $675,000 NAPLESMLS
- 2025-09-15 Price Changed $699,999 NAPLESMLS
- 2025-06-24 Price Changed $720,000 NAPLESMLS
- 2025-06-10 Price Changed $740,000 NAPLESMLS
- 2025-05-28 Listed $750,000 NAPLESMLS
- 2018-09-07 Sold (MLS) $440,000 NAPLESMLS
- 2018-08-01 Pending — NAPLESMLS
- 2018-05-18 Price Changed $449,000 NAPLESMLS
- 2018-04-27 Listed $460,000 NAPLESMLS
- 2003-05-27 Sold (Public Records) $4,631,200 Public Records
Property tax history
+4.9%/yrLatest (2025): $3,882 · +7.0% YoY. Source: county tax records.
Cash-flow waterfall
monthlySold comps — $/sqft
last 12 mo · ≤1 miLoading sold comps…