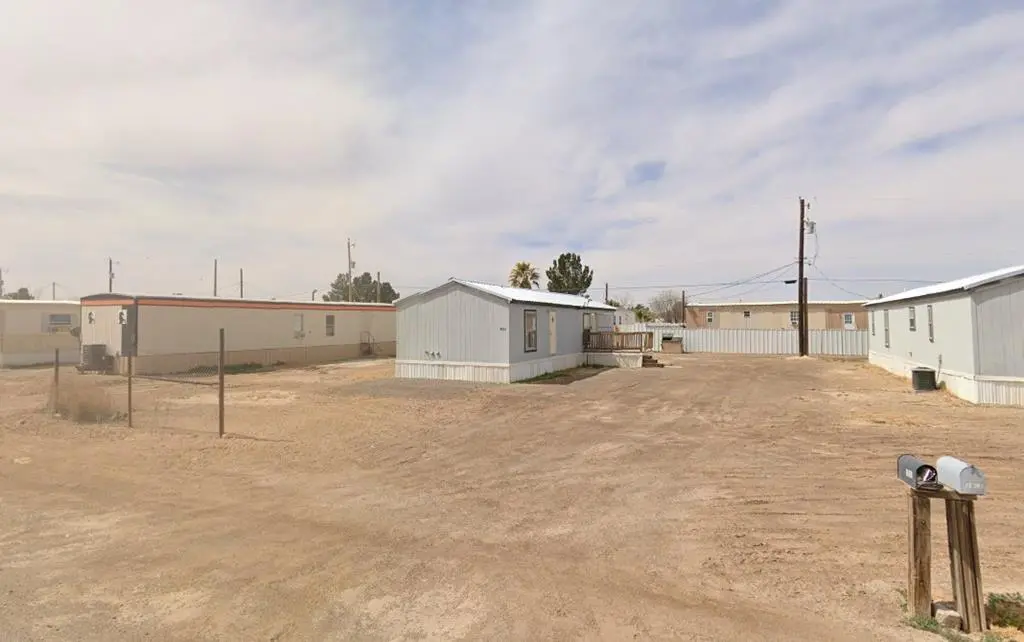
1805 Redbud St · Town of Pecos, TX
Flood risk 3/10 · Minor
- FEMA flood zone
- X
- Chance of flooding over 30 yrs
- 0.17%
- Est. flood insurance / yr
- $507 – $1,088
Fire risk 5/10 · Moderate
- Est. fire insurance / yr
- $1,222 – $2,270
Heat risk 7/10 · Major
- Hot days now (above 105°F)
- 7 days/yr
- Hot days in 30 yrs
- 22 days/yr
Wind risk 1/10 · Minimal
- Chance of severe wind over 30 yrs
- —
Air-quality risk 1/10 · Minimal
- Unhealthy air days now
- 0 days/yr
- Unhealthy air days in 30 yrs
- 0 days/yr
Risk factors via First Street. Map © Google.
Why this score? — see what drove the B grade
The composite is a weighted blend of 9 inputs, each scored 0–100. Each bar is that input's sub-score; the figure is the points it added to the 100-point composite (weight × sub-score).
- Cash flow +30.0/30.0
- DSCR +10.0/10.0
- 1% rule +9.8/10.0
- ARV discount +7.5/15.0
- Appreciation +4.5/10.0
- Rent growth +2.5/5.0
- Schools +2.5/10.0
- Livability +2.5/5.0
- Condition / age +2.5/5.0
$99,997
🖨 Deal sheet 📄 Offer letter ✓ Due diligence
Listing remarks MLS
This well-maintained 2-bedroom, 2-bathroom mobile home, built in 2012, is located in Pecos, TX, making it an ideal, turnkey housing solution for oil field workers due to its comfortable living spaces and convenient proximity to major oil fields; this single property represents a fantastic opportunity for you to invest in a high-demand rental property or to house your crew, so contact us today to schedule a viewing and secure this excellent investment.
Key facts
- 8,276 sq ft lot
- Built 2012
- Listed 230 days
Neighborhood map
What this means for you Summary
Snapshot
- This is a 2-bed/2.0-bath other listed at $100k.
Deal economics
- At list price, monthly cash flow is $479 ($6k/yr) — positive.
- The deal already cash-flows at list — no discount required.
- Meets the 1% rule at list price ($1k rent vs $100k).
- Recommended offer: $88k (12.0% below list) — sets the bar for market timing.
Location & tenants
- Location reads: area grade B — affects rentability + tenant quality, not the cash-flow math above.
- Pecos-Barstow-Toyah ISD (town): math 28% / reading 30% proficiency, ranked #652 of 826 in TX (top 79%) — low school quality limits family demand, transient renter base, plan for 1-2y turnover; 66% free/reduced lunch — lower-income household profile, screen leases tightly.
- Market conditions: 88 active listings in the ZIP; 22 units permitted in Reeves County in 2024 (0 in 5+ unit buildings).
Forward outlook
- Local home prices are declining (-1.1%/yr); year-one equity from $692 of loan paydown is wiped out by about $1k of value loss. Plan a longer hold.
- Reeves County population projected at +45% by 2050 — long-run rental-demand tailwind backs the buy-and-hold thesis.
- At projected returns (-1.1% appreciation + 3.0% rent growth), your $28k cash investment doubles in ~5 years — after that, you're playing with house money.
Negotiation context
- It's been on market 230 days — a 12% lower offer ($88k) is reasonable based on typical stale-listing flexibility.
Risks & watch-outs
- Climate carrying-cost: moderate wildfire risk; extreme-heat days projected 7→22/yr by 2055 (HVAC capex compounding) — expect insurance premiums to compound above CPI over the hold.
Questions for the listing agent
- It's been on market 230 days. Have you received any prior offers? Is the seller open to a 12% concession, seller financing, or rate buy-down credit?
- Why hasn't it sold? Are there any deal-killer items the seller is aware of (foundation, flood, title, zoning, code violations)?
- Is there a deadline driving the sale (1031 exchange, divorce, estate, relocation)? That informs how much negotiation room exists.
- What's the average days-on-market for RENTAL listings here right now (not sales)? A rising rental-DOM trend means longer vacancies and softer asking-rent achievability than the comps imply.
- What's the recent tenant-quality profile in this submarket — average credit score on applications, eviction rate, late-payment / NSF rate, and stable-employment percentage? A property-management company in the area should have these aggregated.
- How much new for-sale + rental construction is in the pipeline within 1–3 miles? Heavy new supply typically softens prices + rents 12–24 months out; constrained supply supports both.
Investment metrics
- 1% rule
- 1.48% ✓
- Cap rate
- 12.04%
- Cash-on-cash
- 20.51%
- DSCR
- 1.91
- GRM
- 5.6
CMA / ARV
No comps found within radius.
Projected returns pro-forma
-1.09% appreciation · 3.0% rent growth · sell at horizon
- IRR
- 17.8%
- Equity multiple
- 1.81×
- Total profit
- $22,575
- Equity at exit
- $23,711
- IRR
- 23.6%
- Equity multiple
- 3.38×
- Total profit
- $66,734
- Equity at exit
- $24,537
Cash invested: $27,999 (down + closing). Projections, not guarantees.
Landlord ↔ Tenant lean methodology
- Overall (STATE)
- 87 Strongly Landlord-Friendly
- State Texas
- 87 Strongly Landlord-Friendly · R+5
- County
- — inherits STATE
- City
- — inherits STATE
ZIP-level market 79772
- Home prices YoY
- -0.7%
- Active inventory
- 88
- Price-to-rent
- 5.6×
Monthly cashflow live
- Estimated rent
- $1,481 medium interval (Pro) →
- Mortgage (P&I)
- −$524
- Tax est. 1.5%
- −$125 /mo · $1,500/yr
- Insurance
- −$42
- HOA
- −$0
- Vacancy / Maint / Mgmt
- −$311
- Net cashflow
- $479
Break-even live
UW: 25.0% down · 7.5% · 30yr · 1.5% tax · 5.0% vac · 8.0% maint · 8.0% mgmt
Financing live
Cash to close
- Down payment
- $24,999
- Closing costs
- $3,000
- Reserves months
- —
- Total cash needed
- —
Loan-product check · same deal, 3 products live
Conventional
25% down · 7.5% · 30yr
- Down + closing
- —
- Monthly P&I
- —
- Monthly cashflow
- —
- DSCR
- —
- Eligible?
- —
Personal DTI + credit; lowest rate.
DSCR
20% down · 8.5% · 30yr
- Down + closing
- —
- Monthly P&I
- —
- Monthly cashflow
- —
- DSCR
- —
- Eligible?
- —
No personal income docs; deal must DSCR.
Hard money
10% down · 12.0% · 12mo
- Down + closing
- —
- Monthly P&I
- —
- Monthly cashflow
- —
- DSCR
- —
- Eligible?
- —
Short-term bridge; refi at stabilization.
Listing history 18 events
-
2026-06-18days on market $99,997 Active 230 DOM
-
2026-06-17days on market $99,997 Active 229 DOM
-
2026-06-16days on market $99,997 Active 228 DOM
-
2026-06-15days on market $99,997 Active 227 DOM
-
2026-06-15days on market $99,997 Active 226 DOM
-
2026-06-13days on market $99,997 Active 225 DOM
-
2026-06-12days on market $99,997 Active 224 DOM
-
2026-06-10days on market $99,997 Active 221 DOM
-
2026-06-08days on market $99,997 Active 220 DOM
-
2026-06-08days on market $99,997 Active 219 DOM
-
2026-06-07days on market $99,997 Active 218 DOM
-
2026-06-03days on market $99,997 Active 215 DOM
-
2026-06-02days on market $99,997 Active 214 DOM
-
2026-06-01days on market $99,997 Active 213 DOM
-
2026-05-31days on market $99,997 Active 212 DOM
-
2025-10-31$99,997 Active 455-char remark
Show marketing remark (455 chars)
This well-maintained 2-bedroom, 2-bathroom mobile home, built in 2012, is located in Pecos, TX, making it an ideal, turnkey housing solution for oil field workers due to its comfortable living spaces and convenient proximity to major oil fields; this single property represents a fantastic opportunity for you to invest in a high-demand rental property or to house your crew, so contact us today to schedule a viewing and secure this excellent investment.
-
2024-10-24price $125,000
-
2022-02-13price $1,500
ⓘ Source: listings_history table (triggers on properties + properties_extension) + one-shot
backfill from property_details.listing_events for pre-trigger history.
Climate risk First Street
- Flood 3/10 Moderate FEMA zone X · 17% chance over 30 yrs
- Wildfire 5/10 Major
- Heat 7/10 Severe 7 d/yr ≥105°F today · 22 d/yr by 30 yrs out
- Wind 1/10 Low
- Air quality 1/10 Low 0 unhealthy d/yr today · 0 by 30 yrs out
Nearby sold comps map
Loading sold comps map…
Walkable amenities ~0.75 mi
Loading nearby amenities…
Taxation est. · year 1
- Rental income
- $17,767
- − Mortgage interest
- −$5,601
- − Property taxes
- −$1,500
- − Insurance
- −$500
- − Repairs & maintenance
- −$1,421
- − Management
- −$1,421
- − Depreciation
- −$2,909
- Taxable income
- $4,414
- Est. tax owed @ 24.0%
- −$1,059
- After-tax cash flow
- $4,684/yr
For passive investors: Depreciation is non-cash, so a rental often shows a tax loss while cash-flowing — sheltering income. Rental losses are passive: they offset passive income freely, and up to $25,000/yr can offset ordinary (W-2) income if you actively participate and your MAGI is under $100k (phasing out to $0 by $150k); unused losses carry forward. On sale, claimed depreciation is recaptured at up to 25%, and gains may owe capital-gains tax (a 1031 exchange can defer both). Figures are a year-1 estimate at your 24.0% rate — not tax advice; consult a CPA.
Schools (NCES district)
- District
- Pecos-Barstow-Toyah ISD
- NCES district ID
- 4834550
- Math proficiency
- 28% ▼ -7.00%
- Reading proficiency
- 30% ▲ 1.00%
- Median HH income
- $41,982
- Composite
- 24.61/100
- National rank
- #7632
- State rank
- #652 of 826 in TX
Livability — Town of Pecos
No livability data for this city. (Only ~50 U.S. cities are tracked.)
Census & demographics
- Census place
- Town of Pecos, TX
- City population
- 12,547
- Population (ZIP)
- 12,547
Population outlook (Reeves County) Hauer SSP2
- Today (2025)
- 17,069 people
- By 2030
- 18,407 · +7.8%
- By 2040
- 21,342 · +25.0%
- By 2050
- 24,701 · +44.7%
- By 2075
- 32,688 · +91.5%
- By 2100
- 36,117 · +111.6%
Race, ethnicity, and origin ACS 2023
- Neighborhood character
- Predominantly Hispanic (85%)
- Race & ethnicity
- Hispanic / Latino 85% Two or more races 22% White 12% Black 2% Native American 1%
- Hispanic origin (detail)
- Mexican 78%
- Common ancestry
- Iranian 1% Serbian 1%
- Foreign-born
- 19% · Canada
- Languages at home
- 38% English-only · Spanish 62%
Political lean MEDSL · Reeves
- 2024 margin
- Solid R (+36.9) · D 31.1% · R 68.0%
- 2008→2024 swing
- -42.2pp toward R · 2008: 5.2pp · 2024: -36.9pp
- All cycles
- 2024: R+36.9 2020: R+23.3 2016: D+7.6 2012: D+16.2 2008: D+5.2
Not yet ingested
- Civics
- —
Market trends
- HPI YoY
- ▼ -1.09%
- Current HPI
- 147.9377
- Rent YoY
- —
- Metro
- —
- State GDP YoY
- ▲ 3.95%
- F500 in state
- 110
Industry mix (Fortune 500 HQ in TX)
| Industry | F500 HQs | Revenue |
|---|---|---|
| Energy | 16 | $1,198B |
|
||
| Technology | 5 | $198B |
|
||
| Engineering / Construction | 4 | $72B |
|
||
| Energy Services | 3 | $60B |
|
||
| Utilities | 3 | $41B |
|
||
| Healthcare | 2 | $330B |
|
||
Price history
+6566.5% since first listed3 events — show timeline
- 2025-10-31 Listed $99,997 PBBOR
- 2024-10-24 Price Changed $125,000 ODMLS
- 2022-02-13 Price Changed $1,500 RENT.
Cash-flow waterfall
monthlySold comps — $/sqft
last 12 mo · ≤1 miLoading sold comps…