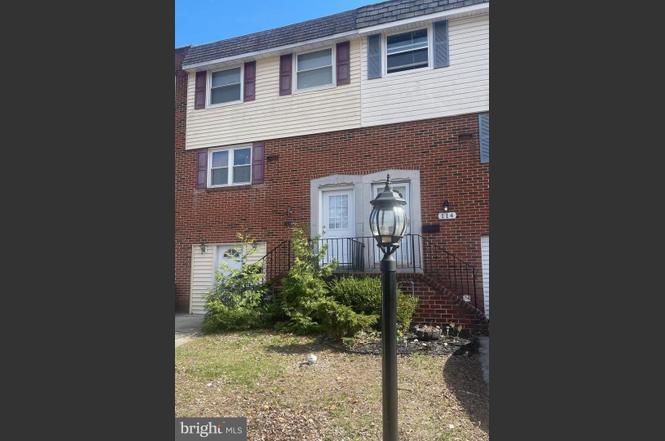
116 Laureba Ave · Stratford, NJ
Flood risk 1/10 · Minimal
- FEMA flood zone
- X (unshaded)
- Chance of flooding over 30 yrs
- 0.0%
- Est. flood insurance / yr
- $507 – $1,088
Fire risk 1/10 · Minimal
- Est. fire insurance / yr
- $526 – $976
Heat risk 6/10 · Moderate
- Hot days now (above 103°F)
- 7 days/yr
- Hot days in 30 yrs
- 15 days/yr
Wind risk 6/10 · Moderate
- Chance of severe wind over 30 yrs
- 56.0%
Air-quality risk 3/10 · Minor
- Unhealthy air days now
- 3 days/yr
- Unhealthy air days in 30 yrs
- 3 days/yr
Risk factors via First Street. Map © Google.
Why this score? — see what drove the B+ grade
The composite is a weighted blend of 9 inputs, each scored 0–100. Each bar is that input's sub-score; the figure is the points it added to the 100-point composite (weight × sub-score).
- Cash flow +30.0/30.0
- ARV discount +15.0/15.0
- 1% rule +10.0/10.0
- DSCR +10.0/10.0
- Livability +3.8/5.0
- Schools +2.9/10.0
- Rent growth +2.5/5.0
- Condition / age +2.5/5.0
- Appreciation +0.0/10.0
$195,000
🖨 Deal sheet 📄 Offer letter ✓ Due diligence
Listing remarks
Coming soon along with pictures. This home needs updating and some repair but offers lots of potential. This home has 3 bedrooms 1.5 baths with spacious rooms and more . Convenient located near PATCO Speedline, Jefferson Hospital, etc. Don't miss your chance to own this versatile and conveniently located townhome
Key facts
- Built 1965
Neighborhood map
What this means for you Summary
Snapshot
- This is a 3-bed/1.0-bath single-family listed at $195k.
Deal economics
- At list price, monthly cash flow is $762 ($9k/yr) — positive.
- The deal already cash-flows at list — no discount required.
- Meets the 1% rule at list price ($3k rent vs $195k).
- Cap rate 11.0% vs local median 3.5% in Stratford — top-decile yield for the area; either an underpriced asset or a hidden risk that comps aren't pricing in. Stress-test before assuming the spread holds.
Location & tenants
- Location reads 76/100 on livability (#131 in NJ, #3,497 nationally) — a middle-class / working-renter tenant base. Strengths: crime A+, employment A+, housing A+; Watch: amenities F, commute F.
- Stratford School District (suburban): math 21% / reading 42% proficiency, ranked #317 of 472 in NJ (top 67%) — families likely to look elsewhere, expect single-tenant / working-renter base with shorter leases.
- Market conditions: 27 active listings in the ZIP; 10 comparable units currently listed for rent nearby; rentals leasing fast (median 10d on market — plan ~1-2 weeks tenant-placement turnaround); 1,018 units permitted in Camden County in 2024 (509 in 5+ unit buildings).
Forward outlook
- Local home prices are declining (-3.0%/yr); year-one equity from $1k of loan paydown is wiped out by about $6k of value loss. Plan a longer hold.
- Camden County population projected to shrink 8% by 2050 — rents likely to lag national; underwrite the cash flow, not the appreciation.
- At projected returns (-3.0% appreciation + 3.0% rent growth), your $55k cash investment doubles in ~8 years — after that, you're playing with house money.
Negotiation context
- Only 1 days on market — expect competitive offers; lowballing is unlikely to land.
- Current owner paid $75k; list at $195k implies a 160% gain — meaningful room to come down on a strong offer.
Risks & watch-outs
- Watch-outs: property tax is 2.8% of price.
- Climate carrying-cost: major wind risk, 56% chance of damaging wind over 30y; extreme-heat days projected 7→15/yr by 2055 (HVAC capex compounding) — expect insurance premiums to compound above CPI over the hold.
Questions for the listing agent
- Built in 1965 — when were the roof, HVAC, electrical panel, plumbing, and water heater last replaced?
- Property tax is high relative to price — has the assessment been appealed recently, and will the sale trigger a re-assessment?
- Is there a deadline driving the sale (1031 exchange, divorce, estate, relocation)? That informs how much negotiation room exists.
- Schools are B-rated — typically a magnet for longer-tenancy family renters. What's the average tenant stay here, and is there a school-zone premium baked into asking?
- What's the average days-on-market for RENTAL listings here right now (not sales)? A rising rental-DOM trend means longer vacancies and softer asking-rent achievability than the comps imply.
- What's the recent tenant-quality profile in this submarket — average credit score on applications, eviction rate, late-payment / NSF rate, and stable-employment percentage? A property-management company in the area should have these aggregated.
- How much new for-sale + rental construction is in the pipeline within 1–3 miles? Heavy new supply typically softens prices + rents 12–24 months out; constrained supply supports both.
Investment metrics
- 1% rule
- 1.51% ✓
- Cap rate
- 10.98%
- Cash-on-cash
- 16.75%
- DSCR
- 1.75
- GRM
- 5.5
CMA / ARV
- ARV (on-the-fly)
- $356,184
- Comps found
- 12
Show comp detail 12 sales within ~0.75 mi
| Address | Dist | Beds/Ba | Sqft | Sold | Price | $/sf | Match |
|---|---|---|---|---|---|---|---|
| 140 Laureba Ave | 0.04mi | 3/1.5 | 1,836 (0%) | 4mo | $275,000 | $150 | 93 |
| 202 Broadway | 0.39mi | 3/1.5 | 1,764 (-4%) | 6mo | $355,000 | $201 | 68 |
| 124 Stratford Ave | 0.18mi | 4/1.5 (+1) | 1,660 (-10%) | 1mo | $330,000 | $199 | 68 |
| 1006 Chestnut Ave | 0.55mi | 3/1.0 | 1,689 (-8%) | 2mo | $325,000 | $192 | 59 |
| 105 Summit Ave | 0.33mi | 3/1.0 | 1,600 (-13%) | 7mo | $310,000 | $194 | 58 |
| 316 E Stafford Ave | 0.46mi | 4/2.0 (+1) | 1,732 (-6%) | 7mo | $340,000 | $196 | 54 |
| 326 Chestnut Ave | 0.61mi | 4/2.5 (+1) | 1,870 (+2%) | 7mo | $330,000 | $176 | 52 |
| 126 E Linden Ave | 0.42mi | 4/2.5 (+1) | 1,703 (-7%) | 8mo | $325,000 | $191 | 51 |
| 137 E Elm Ave | 0.49mi | 3/2.0 | 1,653 (-10%) | 7mo | $359,000 | $217 | 51 |
| 101 Hemlock Ave | 0.29mi | 4/1.5 (+1) | 1,579 (-14%) | 9mo | $307,000 | $194 | 49 |
| 413 Myrtle Ave | 0.50mi | 2/2.0 (-1) | 1,650 (-10%) | 5mo | $240,000 | $145 | 47 |
| 128 W Elm Ave | 0.66mi | 4/2.0 (+1) | 1,596 (-13%) | 10mo | $315,000 | $197 | 30 |
Match score weights: distance 35% · size 25% · config 20% · recency 20%. Top-matched comps best support the ARV.
Projected returns pro-forma
-3.0% appreciation · 3.0% rent growth · sell at horizon
- IRR
- 8.0%
- Equity multiple
- 1.31×
- Total profit
- $17,127
- Equity at exit
- $29,075
- IRR
- 17.3%
- Equity multiple
- 2.43×
- Total profit
- $78,146
- Equity at exit
- $16,860
Cash invested: $54,600 (down + closing). Projections, not guarantees.
Landlord ↔ Tenant lean methodology
- Overall (STATE)
- 21 Tenant-Leaning
- State New Jersey
- 21 Tenant-Leaning · D+6
- County
- — inherits STATE
- City
- — inherits STATE
ZIP-level market 08084
- Home prices YoY
- -17.5%
- Active inventory
- 27
- Price-to-rent
- 5.5×
Monthly cashflow live
- Estimated rent
- $2,943 high interval (Pro) →
- Mortgage (P&I)
- −$1,023
- Tax from tax record
- −$459 /mo · $5,506/yr
- Insurance
- −$81
- HOA
- −$0
- Vacancy / Maint / Mgmt
- −$618
- Net cashflow
- $762
Break-even live
UW: 25.0% down · 7.5% · 30yr · 1.5% tax · 5.0% vac · 8.0% maint · 8.0% mgmt
Financing live
Cash to close
- Down payment
- $48,750
- Closing costs
- $5,850
- Reserves months
- —
- Total cash needed
- —
Loan-product check · same deal, 3 products live
Conventional
25% down · 7.5% · 30yr
- Down + closing
- —
- Monthly P&I
- —
- Monthly cashflow
- —
- DSCR
- —
- Eligible?
- —
Personal DTI + credit; lowest rate.
DSCR
20% down · 8.5% · 30yr
- Down + closing
- —
- Monthly P&I
- —
- Monthly cashflow
- —
- DSCR
- —
- Eligible?
- —
No personal income docs; deal must DSCR.
Hard money
10% down · 12.0% · 12mo
- Down + closing
- —
- Monthly P&I
- —
- Monthly cashflow
- —
- DSCR
- —
- Eligible?
- —
Short-term bridge; refi at stabilization.
Rent comps 10 comps
| Address | Beds | Baths | Sqft | Rent | $/sqft | DOM | Units | Dist |
|---|---|---|---|---|---|---|---|---|
| 222 Berlin Rd N Lindenwold, NJ | 3.0 | 1.5 | 1925 | $3,300 | $1.71 | 1d | 1 | 0.23mi |
| 126 Washington Ave Unit 1B Laurel Springs, NJ | 2.0 | 1.0 | 2309 | $1,950 | $0.84 | 17d | 1 | 0.40mi |
| 5 Sidney Ln Stratford, NJ | 2.0 | 2.5 | 1548 | $2,800 | $1.81 | 1d | 1 | 0.41mi |
| 16 W Linden Ave Lindenwold, NJ | 4.0 | 1.0 | 1560 | $2,950 | $1.89 | 1d | 1 | 0.55mi |
| 1256 Kirkwood-gibbsboro R Voorhees, NJ | 2.0 | 2.0 | 1738 | $1,050 | $0.60 | 22d | 1 | 0.74mi |
| 98 Oak St Clementon, NJ | 1.0–2.0 | 1.0–2.0 | 1027 | $2,040 | $1.99 | 1d | 44 | 0.79mi |
| 215 S Atlantic Ave E Stratford, NJ | 3.0 | 1.0 | 1460 | $2,445 | $1.67 | 10d | 1 | 0.82mi |
| 8 Cornell Ave Somerdale, NJ | 4.0 | 2.0 | 1546 | $3,200 | $2.07 | 24d | 1 | 1.16mi |
| 4 Millbank Ct Voorhees, NJ | 3.0 | 2.5 | 1470 | $3,400 | $2.31 | 1d | 1 | 1.24mi |
| 136 Colonial Sq Lindenwold, NJ | 3.0 | 1.5 | 1380 | $1,950 | $1.41 | 24d | 1 | 1.35mi |
Listing history 5 events
-
2026-04-21status Pending
-
2026-04-21$195,000 Active
-
2026-03-10historical $195,000
-
1997-10-27soldstatus $75,000
-
1986-08-02soldstatus $54,700
ⓘ Source: listings_history table (triggers on properties + properties_extension) + one-shot
backfill from property_details.listing_events for pre-trigger history.
Tax reassessment forecast NJ · Partial reset (capped growth)
- Current annual tax
- $5,506 · $459/mo
- Projected year-2 tax
- $5,506 · $459/mo
- Expected delta
- $0/yr ($0/mo · 0.0%)
ⓘ Screening estimate from a state-policy table — verify with the county assessor before closing.
Climate risk First Street
- Flood 1/10 Low FEMA zone X (unshaded) · 0% chance over 30 yrs
- Wildfire 1/10 Low
- Heat 6/10 Major 7 d/yr ≥103°F today · 15 d/yr by 30 yrs out
- Wind 6/10 Major 56% chance of damaging wind over 30 yrs
- Air quality 3/10 Moderate 3 unhealthy d/yr today · 3 by 30 yrs out
Nearby sold comps map
Loading sold comps map…
Walkable amenities ~0.75 mi
Loading nearby amenities…
Taxation est. · year 1
- Rental income
- $35,316
- − Mortgage interest
- −$10,923
- − Property taxes
- −$5,506
- − Insurance
- −$975
- − Repairs & maintenance
- −$2,825
- − Management
- −$2,825
- − Depreciation
- −$5,673
- Taxable income
- $6,588
- Est. tax owed @ 24.0%
- −$1,581
- After-tax cash flow
- $7,566/yr
For passive investors: Depreciation is non-cash, so a rental often shows a tax loss while cash-flowing — sheltering income. Rental losses are passive: they offset passive income freely, and up to $25,000/yr can offset ordinary (W-2) income if you actively participate and your MAGI is under $100k (phasing out to $0 by $150k); unused losses carry forward. On sale, claimed depreciation is recaptured at up to 25%, and gains may owe capital-gains tax (a 1031 exchange can defer both). Figures are a year-1 estimate at your 24.0% rate — not tax advice; consult a CPA.
Schools (NCES district)
- District
- Stratford School District
- NCES district ID
- 3415870
- Math proficiency
- 21% ▼ -28.00%
- Reading proficiency
- 42% ▼ -22.00%
- Median HH income
- $66,959
- Composite
- 28.99/100
- National rank
- #6621
- State rank
- #317 of 472 in NJ
Livability — Stratford
- Score
- 76/100
- State rank
- #131
- US rank
- #3497
Category grades
Schools grade is shown separately in the Schools card above.
Census & demographics
- Census place
- Stratford, NJ
- City population
- 6,965
- Population (ZIP)
- 6,965
Population outlook (Camden County) Hauer SSP2
- Today (2025)
- 507,964 people
- By 2030
- 502,182 · -1.1%
- By 2040
- 485,602 · -4.4%
- By 2050
- 465,630 · -8.3%
- By 2075
- 419,986 · -17.3%
- By 2100
- 369,492 · -27.3%
Race, ethnicity, and origin ACS 2023
- Neighborhood character
- Predominantly White (71%)
- Race & ethnicity
- White 71% Hispanic / Latino 13% Black 8% Two or more races 8% Asian 3%
- Hispanic origin (detail)
- Mexican 2% Puerto Rican 4%
- Common ancestry
- Romanian 5% Portuguese 2% Slovak 1%
- Foreign-born
- 10% · Canada, Philippines, Vietnam
- Languages at home
- 85% English-only · Spanish 9% Other Indo-European 2% Other Asian/Pacific 1%
Political lean MEDSL · Camden
- 2024 margin
- Strong D (+27.4) · D 63.0% · R 35.5% · Other 1.5%
- 2008→2024 swing
- -8.8pp toward R · 2008: 36.2pp · 2024: 27.4pp
- All cycles
- 2024: D+27.4 2020: D+33.5 2016: D+32.4 2012: D+36.6 2008: D+36.2
Not yet ingested
- Civics
- —
Market trends
- HPI YoY
- ▼ -75.77%
- Current HPI
- 357.8554
- Rent YoY
- —
- Metro
- —
- State GDP YoY
- ▲ 2.05%
- F500 in state
- 34
Industry mix (Fortune 500 HQ in NJ)
| Industry | F500 HQs | Revenue |
|---|---|---|
| Consumer Goods | 3 | $31B |
|
||
| Pharmaceuticals | 2 | $153B |
|
||
| Technology | 2 | $21B |
|
||
| Insurance | 2 | $20B |
|
||
| Healthcare | 2 | $19B |
|
||
| Financial Services | 1 | $70B |
|
||
Price history
+256.5% since first listed5 events — show timeline
- 2026-04-21 Pending — BRIGHT MLS
- 2026-04-21 Listed $195,000 BRIGHT MLS
- 2026-03-10 Coming Soon $195,000 BRIGHT MLS
- 1997-10-27 Sold (Public Records) $75,000 Public Records
- 1986-08-02 Sold (Public Records) $54,700 Public Records
Property tax history
+1.8%/yrLatest (2025): $5,506 · +3.0% YoY. Source: county tax records.
Cash-flow waterfall
monthlySold comps — $/sqft
last 12 mo · ≤1 miLoading sold comps…