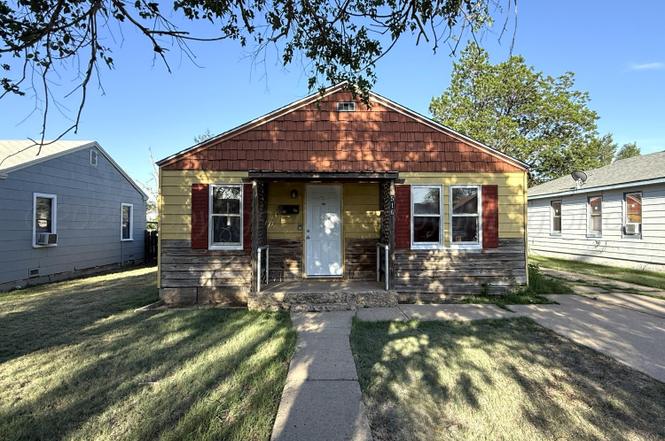
516 N Nelson St · Pampa, TX
Flood risk 1/10 · Minimal
- FEMA flood zone
- X (unshaded)
- Chance of flooding over 30 yrs
- 0.0%
- Est. flood insurance / yr
- $507 – $1,088
Fire risk 9/10 · Severe
- Est. fire insurance / yr
- $1,222 – $2,270
Heat risk 5/10 · Moderate
- Hot days now (above 99°F)
- 7 days/yr
- Hot days in 30 yrs
- 20 days/yr
Wind risk 2/10 · Minimal
- Chance of severe wind over 30 yrs
- —
Air-quality risk 2/10 · Minimal
- Unhealthy air days now
- 1 days/yr
- Unhealthy air days in 30 yrs
- 1 days/yr
Risk factors via First Street. Map © Google.
Why this score? — see what drove the C grade
The composite is a weighted blend of 9 inputs, each scored 0–100. Each bar is that input's sub-score; the figure is the points it added to the 100-point composite (weight × sub-score).
- Cash flow +25.6/30.0
- DSCR +8.5/10.0
- ARV discount +7.5/15.0
- 1% rule +5.9/10.0
- Livability +3.8/5.0
- Schools +3.1/10.0
- Rent growth +2.5/5.0
- Condition / age +2.5/5.0
- Appreciation +0.0/10.0
$72,000
🖨 Deal sheet (PDF) 📄 Offer letter ✓ Due diligence
Listing remarks
Charming 2-bedroom, 1-bath home full of character and opportunity! This cute property offers a spacious layout, a large yard with plenty of room for gardening, entertaining, pets, or future improvements, and a detached one-car garage/shop perfect for storage, hobbies, or a workshop space. The home has great bones and just needs a little updating to truly make it your own. Whether you're a first-time homebuyer, investor, or someone looking for an affordable property with potential, this home is worth a look. Don't miss the chance to add your personal touch and create something special! Note: Toilet being replaced.
Key facts
- Large yard
- Spacious layout
- Detached garage
Tags
Property features AI
Exterior
- Parking: Detached parking
- Home design: Single family residence; Residential property
Interior
- Heating & cooling: Natural gas heating
- Interior features: Has heating
Neighborhood map
What this means for you Summary
Snapshot
- This is a 2-bed/1.0-bath single-family listed at $72k.
Deal economics
- At list price, monthly cash flow is $171 ($2k/yr) — positive.
- The deal already cash-flows at list — no discount required.
- Meets the 1% rule at list price ($783 rent vs $72k).
Location & tenants
- Location reads 75/100 on livability (#128 in TX, #3,885 nationally) — a middle-class / working-renter tenant base. Strengths: cost of living A+, housing A+, health & safety A+; Watch: schools D+, employment D+, crime F.
- Pampa ISD (town): math 38% / reading 36% proficiency, ranked #482 of 826 in TX (top 58%) — families likely to look elsewhere, expect single-tenant / working-renter base with shorter leases.
- Market conditions: 182 active listings in the ZIP; 7 comparable units currently listed for rent nearby; rentals lingering (median 45d on market — plan ~5-8 weeks vacancy on turnover, expect pricing pressure); 100% of comp listings sitting > 30 days — soft ceiling on asking rent; 7 units permitted in Gray County in 2024 (0 in 5+ unit buildings).
Forward outlook
- Local home prices are declining (-3.0%/yr); year-one equity from $498 of loan paydown is wiped out by about $2k of value loss. Plan a longer hold.
- Gray County population projected at +28% by 2050 — long-run rental-demand tailwind backs the buy-and-hold thesis.
Negotiation context
- Only 2 days on market — expect competitive offers; lowballing is unlikely to land.
Risks & watch-outs
- Watch-outs: built in 1940 — expect roof / HVAC / electrical / plumbing capex.
- Climate carrying-cost: severe wildfire risk; extreme-heat days projected 7→20/yr by 2055 (HVAC capex compounding) — expect insurance premiums to compound above CPI over the hold.
Questions for the listing agent
- Built in 1940 — when were the roof, HVAC, electrical panel, plumbing, and water heater last replaced?
- Is there a deadline driving the sale (1031 exchange, divorce, estate, relocation)? That informs how much negotiation room exists.
- Schools are D-rated, which usually means shorter tenancies and higher turnover. Who's the typical renter profile here, and what's been the actual vacancy rate?
- Crime grade is F in this area — have there been break-ins, vandalism, or insurance claims at this property in the last 3 years? What carrier currently insures it and at what premium?
- What's the average days-on-market for RENTAL listings here right now (not sales)? A rising rental-DOM trend means longer vacancies and softer asking-rent achievability than the comps imply.
- What's the recent tenant-quality profile in this submarket — average credit score on applications, eviction rate, late-payment / NSF rate, and stable-employment percentage? A property-management company in the area should have these aggregated.
- How much new for-sale + rental construction is in the pipeline within 1–3 miles? Heavy new supply typically softens prices + rents 12–24 months out; constrained supply supports both.
Investment metrics
- 1% rule
- 1.09% ✓
- Cap rate
- 9.15%
- Cash-on-cash
- 10.19%
- DSCR
- 1.45
- GRM
- 7.7
CMA / ARV
No comps found within radius.
Projected returns pro-forma
-3.0% appreciation · 3.0% rent growth · sell at horizon
- IRR
- -1.0%
- Equity multiple
- 0.96×
- Total profit
- $-780
- Equity at exit
- $10,735
- IRR
- 8.6%
- Equity multiple
- 1.66×
- Total profit
- $13,287
- Equity at exit
- $6,225
Cash invested: $20,160 (down + closing). Projections, not guarantees.
Landlord ↔ Tenant lean methodology
- Overall (STATE)
- 87 Strongly Landlord-Friendly
- State Texas
- 87 Strongly Landlord-Friendly · R+5
- County
- — inherits STATE
- City
- — inherits STATE
ZIP-level market 79065
- Active inventory
- 182
- Price-to-rent
- 7.7×
Monthly cashflow live
- Estimated rent
- $783 high interval (Pro) →
- Mortgage (P&I)
- −$378
- Tax from tax record
- −$39 /mo · $473/yr
- Insurance
- −$30
- HOA
- −$0
- Vacancy / Maint / Mgmt
- −$164
- Net cashflow
- $171
Break-even live
Sensitivity live
| Price | -10% $212 | -5% $192 | +0% $171 | +5% $151 | +10% $130 |
|---|---|---|---|---|---|
| Rent | -10% $109 | -5% $140 | +0% $171 | +5% $202 | +10% $233 |
| Rate | -1.0pp $208 | -0.5pp $190 | base $171 | +0.5pp $153 | +1.0pp $134 |
UW: 25.0% down · 7.5% · 30yr · 1.5% tax · 5.0% vac · 8.0% maint · 8.0% mgmt
Financing live
Cash to close
- Down payment
- $18,000
- Closing costs
- $2,160
- Reserves months
- —
- Total cash needed
- —
Loan-product check · same deal, 3 products live
Conventional
25% down · 7.5% · 30yr
- Down + closing
- —
- Monthly P&I
- —
- Monthly cashflow
- —
- DSCR
- —
- Eligible?
- —
Personal DTI + credit; lowest rate.
DSCR
20% down · 8.5% · 30yr
- Down + closing
- —
- Monthly P&I
- —
- Monthly cashflow
- —
- DSCR
- —
- Eligible?
- —
No personal income docs; deal must DSCR.
Hard money
10% down · 12.0% · 12mo
- Down + closing
- —
- Monthly P&I
- —
- Monthly cashflow
- —
- DSCR
- —
- Eligible?
- —
Short-term bridge; refi at stabilization.
Rent comps 7 comps
| Address | Beds | Baths | Sqft | Rent | $/sqft | DOM | Units | Dist |
|---|---|---|---|---|---|---|---|---|
| 100 Hampton Ln Pampa, TX | 2.0 | 2.0 | 1000 | $1,048 | $1.05 | 44d | 1 | 0.44mi |
| 1601 W Somerville St Unit 1201 Pampa, TX | 3.0 | 2.0 | 1053 | $865 | $0.82 | 44d | 1 | 0.54mi |
| 1601 W Somerville St Unit 1001 Pampa, TX | 2.0 | 2.0 | 935 | $780 | $0.83 | 44d | 1 | 0.54mi |
| 1601 W Somerville St Unit 601 Pampa, TX | 1.0 | 1.0 | 812 | $750 | $0.92 | 44d | 1 | 0.54mi |
| 1601 W Somerville St Unit 501 Pampa, TX | 1.0 | 1.0 | 623 | $675 | $1.08 | 44d | 1 | 0.54mi |
| 1601 W Somerville St Unit 103 Pampa, TX | 1.0 | 1.0 | 700 | $700 | $1.00 | 44d | 1 | 0.54mi |
| 120 S Russell St Unit 211 Pampa, TX | 1.0 | 1.0 | 600 | $550 | $0.92 | 44d | 1 | 0.78mi |
Listing history 6 events
-
2026-06-21days on market $72,000 Active 2 DOM
-
2026-06-18days on market $72,000 Active 1 DOM
-
2026-06-18days on market $72,000 Active 3 DOM
-
2026-06-17days on market $72,000 Active 2 DOM
-
2026-06-16remarks 620-char remark
-
2026-06-16$72,000 Active 1 DOM
ⓘ Source: listings_history table (triggers on properties + properties_extension) + one-shot
backfill from property_details.listing_events for pre-trigger history.
Tax reassessment forecast TX · Resets to sale price
- Current annual tax
- $473 · $39/mo
- Projected year-2 tax
- $1,318 · $110/mo
- Expected delta
- +$844/yr (+$70/mo · 178.4%)
ⓘ Screening estimate from a state-policy table — verify with the county assessor before closing.
Climate risk First Street
- Flood 1/10 Low FEMA zone X (unshaded) · 0% chance over 30 yrs
- Wildfire 9/10 Extreme
- Heat 5/10 Major 7 d/yr ≥99°F today · 20 d/yr by 30 yrs out
- Wind 2/10 Low
- Air quality 2/10 Low 1 unhealthy d/yr today · 1 by 30 yrs out
Nearby sold comps map
Loading sold comps map…
Walkable amenities ~0.75 mi
Loading nearby amenities…
Taxation est. · year 1
- Rental income
- $9,391
- − Mortgage interest
- −$4,033
- − Property taxes
- −$473
- − Insurance
- −$360
- − Repairs & maintenance
- −$751
- − Management
- −$751
- − Depreciation
- −$2,095
- Taxable income
- $928
- Est. tax owed @ 24.0%
- −$223
- After-tax cash flow
- $1,832/yr
For passive investors: Depreciation is non-cash, so a rental often shows a tax loss while cash-flowing — sheltering income. Rental losses are passive: they offset passive income freely, and up to $25,000/yr can offset ordinary (W-2) income if you actively participate and your MAGI is under $100k (phasing out to $0 by $150k); unused losses carry forward. On sale, claimed depreciation is recaptured at up to 25%, and gains may owe capital-gains tax (a 1031 exchange can defer both). Figures are a year-1 estimate at your 24.0% rate — not tax advice; consult a CPA.
Schools (NCES district)
- District
- Pampa ISD
- NCES district ID
- 4834170
- Math proficiency
- 38% ▼ -10.00%
- Reading proficiency
- 36% ▬ 0.00%
- Median HH income
- $43,741
- Composite
- 31.43/100
- National rank
- #5986
- State rank
- #482 of 826 in TX
Livability — Pampa
- Score
- 75/100
- State rank
- #128
- US rank
- #3885
Category grades
Schools grade is shown separately in the Schools card above.
Census & demographics
- Census place
- Pampa, TX
- Population (ZIP)
- 19,569
Population outlook (Gray County) Hauer SSP2
- Today (2025)
- 24,965 people
- By 2030
- 26,105 · +4.6%
- By 2040
- 28,752 · +15.2%
- By 2050
- 31,859 · +27.6%
- By 2075
- 39,812 · +59.5%
- By 2100
- 43,284 · +73.4%
Race, ethnicity, and origin ACS 2023
- Neighborhood character
- Majority White (59%)
- Race & ethnicity
- White 59% Hispanic / Latino 32% Two or more races 6% Black 5% Native American 1%
- Hispanic origin (detail)
- Mexican 29%
- Common ancestry
- Slovak 3% Iranian 2% Lithuanian 2%
- Foreign-born
- 10% · Canada, South Korea
- Languages at home
- 79% English-only · Spanish 21%
Political lean MEDSL · Gray
- 2024 margin
- Solid R (+77.1) · D 11.2% · R 88.3%
- 2008→2024 swing
- -6.2pp toward R · 2008: -71.0pp · 2024: -77.1pp
- All cycles
- 2024: R+77.1 2020: R+77.2 2016: R+78.8 2012: R+75.2 2008: R+71.0
Not yet ingested
- Civics
- —
Market trends
- HPI YoY
- ▼ -88.67%
- Current HPI
- 128.8525
- Rent YoY
- —
- Metro
- —
- State GDP YoY
- ▲ 3.95%
- F500 in state
- 110
Industry mix (Fortune 500 HQ in TX)
| Industry | F500 HQs | Revenue |
|---|---|---|
| Energy | 16 | $1,198B |
|
||
| Technology | 5 | $198B |
|
||
| Engineering / Construction | 4 | $72B |
|
||
| Energy Services | 3 | $60B |
|
||
| Utilities | 3 | $41B |
|
||
| Healthcare | 2 | $330B |
|
||
Price history
1 event — show timeline
- 2026-06-16 Listed $72,000 PBOR
Property tax history
-0.8%/yrLatest (2025): $473 · -0.5% YoY. Source: county tax records.
Cash-flow waterfall
monthlySold comps — $/sqft
last 12 mo · ≤1 miLoading sold comps…