4660 Tilbury Ct · Firestone, CO
Flood risk No data
- FEMA flood zone
- —
- Chance of flooding over 30 yrs
- —
- Est. flood insurance / yr
- —
Fire risk No data
- Est. fire insurance / yr
- —
Heat risk No data
- Hot days now (above threshold)
- —
- Hot days in 30 yrs
- —
Wind risk No data
- Chance of severe wind over 30 yrs
- —
Air-quality risk No data
- Unhealthy air days now
- —
- Unhealthy air days in 30 yrs
- —
Risk factors via First Street. Map © Google.
Why this score? — see what drove the C+ grade
The composite is a weighted blend of 9 inputs, each scored 0–100. Each bar is that input's sub-score; the figure is the points it added to the 100-point composite (weight × sub-score).
- Cash flow +30.0/30.0
- 1% rule +10.0/10.0
- DSCR +10.0/10.0
- Schools +3.8/10.0
- Livability +3.7/5.0
- Condition / age +2.8/5.0
- Rent growth +1.9/5.0
- ARV discount +0.0/15.0
- Appreciation +0.0/10.0
$129,000
🖨 Deal sheet (PDF) 📄 Offer letter ✓ Due diligence
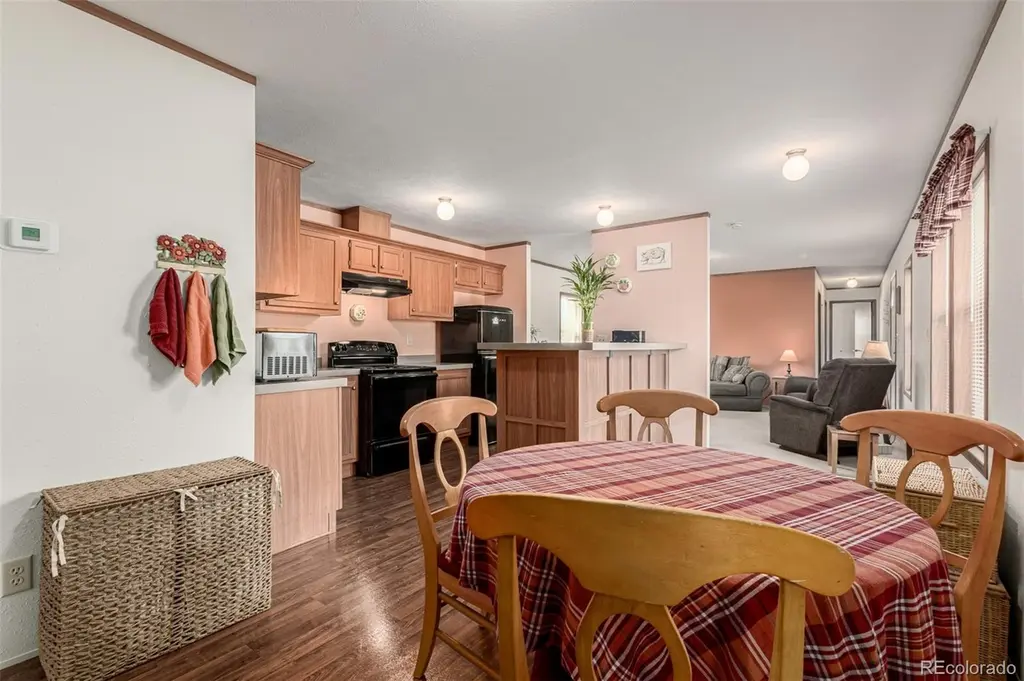
Listing remarks
Step into this beautifully cared for 3 bed, 2 bath mobile home in Eagle Crest! Featuring a newer roof with a transferable warranty & AC, a low-care landscape, and fantastic mountain views, it's sure to be the one for you! Come inside to discover a sizeable living area where you can spend quality time w/ friends & loved ones. Wood-look flooring, soft carpet in all the right places, and custom palette throughout. The eat-in kitchen comes equipped w/ ample cabinet & counter space, as well as all the built-in appliances you'll need for home cooking. You'll love the primary suite, boasting a walk-in closet and a private bath for added comfort. Lot rent is $1,003 per month. Enjo
Key facts
- Newer roof
- Ample cabinet space
- Sizeable living area
Tags
Property features AI
Finance
- Financial info: Monthly land lease amount: $959; Land lease expires October 31, 2026
- HOA & community: Land lease in place (Eagle Crest) with monthly land lease payment
Exterior
- Parking: Parking for 2 vehicles
- Utilities: Public water; Public sewer; Electricity available; Natural gas available; Cable available; Wired internet access available; Phone service available
- Home design: Manufactured home in park; Single-story (main level living); Individual ownership
- Construction: Frame construction with vinyl siding; Composition roof
- Exterior features: Front porch; Rain gutters; Landscaped, level lot; Paved public road frontage (public maintained road); Lot located in a manufactured home park (Eagle Crest)
Interior
- Kitchen: Eat-in kitchen; Laminate counters; Range; Dishwasher; Disposal; Refrigerator
- Bedrooms: 3 bedrooms, all on the main level; Primary bedroom on the main level with walk-in closet and en suite bathroom; Other bedrooms carpeted
- Flooring: Carpet; Vinyl
- Bathrooms: 2 full bathrooms, both on the main level; Bathrooms with shower and tub combo; Primary suite includes an en suite bathroom
- Heating & cooling: Forced air heating; Central air conditioning
- Interior features: Built-in features; Eat-in kitchen; High-speed internet available; Laminate counters; No stairs; Primary suite; Walk-in closet(s); Double pane windows; Custom paint (living room)
- Laundry & utility: Main-level laundry room; Washer; Dryer
Neighborhood map
What this means for you Summary
Snapshot
- This is a 3-bed/2.0-bath manufactured listed at $129k. Condition is rated average.
Deal economics
- At list price, monthly cash flow is $1k ($13k/yr) — positive.
- The deal already cash-flows at list — no discount required.
- Meets the 1% rule at list price ($2k rent vs $129k).
- Recommended offer: $121k (6.0% below list) — sets the bar for market timing.
- Cap rate 16.1% vs local median 2.9% in Firestone — top-decile yield for the area; either an underpriced asset or a hidden risk that comps aren't pricing in. Stress-test before assuming the spread holds.
Location & tenants
- Location reads 73/100 on livability (#44 in CO) — a middle-class / working-renter tenant base. Strengths: employment A+, housing A+, crime A; Watch: amenities F, commute F, cost of living F.
- St. Vrain Valley School District No. Re1J (suburban): math 32% / reading 51% proficiency, ranked #23 of 86 in CO (top 27%) — families likely to look elsewhere, expect single-tenant / working-renter base with shorter leases.
- Zoned schools: Centennial Elementary (math 32% / reading 47%, grade F, #357 of 966 statewide, top 40%, 468 students, 33% FRL); Coal Ridge Middle School (math 23% / reading 46%, grade F, #106 of 270 statewide, top 42%, 800 students, 32% FRL); Mead High School (math 34% / reading 59%, grade D-, #137 of 381 statewide, top 36%, 1,119 students, 25% FRL) — zoned schools at 30% FRL track the district average.
- Market conditions: Rents soft (-2.3%/yr); 534 active listings in the ZIP; 5 comparable units currently listed for rent nearby; rentals at typical pace (median 22d on market — plan ~3-4 weeks tenant-placement turnaround); high-income renter base; 3,170 units permitted in Weld County in 2024 (278 in 5+ unit buildings).
Forward outlook
- Local home prices are declining (-3.0%/yr); year-one equity from $892 of loan paydown is wiped out by about $4k of value loss. Plan a longer hold.
- Weld County population projected at +46% by 2050 — long-run rental-demand tailwind backs the buy-and-hold thesis.
- At projected returns (-3.0% appreciation + 0.0% rent growth), your $36k cash investment doubles in ~4 years — after that, you're playing with house money.
Negotiation context
- It's been on market 71 days — a 6% lower offer ($121k) is reasonable based on typical stale-listing flexibility.
Questions for the listing agent
- It's been on market 71 days. Have you received any prior offers? Is the seller open to a 6% concession, seller financing, or rate buy-down credit?
- Why hasn't it sold? Are there any deal-killer items the seller is aware of (foundation, flood, title, zoning, code violations)?
- Is there a deadline driving the sale (1031 exchange, divorce, estate, relocation)? That informs how much negotiation room exists.
- What's the average days-on-market for RENTAL listings here right now (not sales)? A rising rental-DOM trend means longer vacancies and softer asking-rent achievability than the comps imply.
- What's the recent tenant-quality profile in this submarket — average credit score on applications, eviction rate, late-payment / NSF rate, and stable-employment percentage? A property-management company in the area should have these aggregated.
- How much new for-sale + rental construction is in the pipeline within 1–3 miles? Heavy new supply typically softens prices + rents 12–24 months out; constrained supply supports both.
Investment metrics
- 1% rule
- 1.91% ✓
- Cap rate
- 16.06%
- Cash-on-cash
- 34.88%
- DSCR
- 2.55
- GRM
- 4.4
CMA / ARV
- ARV (on-the-fly)
- $99,712
- Comps found
- 9
Show comp detail 9 sales within ~0.75 mi
| Address | Dist | Beds/Ba | Sqft | Sold | Price | $/sf | Match |
|---|---|---|---|---|---|---|---|
| 10611 Barron Cir | 0.22mi | 3/2.0 | 1,216 (0%) | 3mo | $100,000 | $82 | 87 |
| 4785 Audrey St #261 | 0.18mi | 3/2.0 | 1,216 (0%) | 10mo | $129,900 | $107 | 84 |
| 10597 Bald Eagle Cir #244 | 0.17mi | 3/2.0 | 1,174 (-4%) | 5mo | $135,300 | $115 | 82 |
| 4785 Audrey St | 0.18mi | 2/2.0 (-1) | 1,216 (0%) | 10mo | $129,900 | $107 | 79 |
| 10833 Belmont St | 0.43mi | 3/2.0 | 1,216 (0%) | 12mo | $97,000 | $80 | 70 |
| 10540 Barron Cir | 0.31mi | 3/2.0 | 1,350 (+11%) | 1mo | $157,000 | $116 | 66 |
| 10729 Belmont St #146 | 0.36mi | 3/2.0 | 1,292 (+6%) | 11mo | $70,000 | $54 | 63 |
| 4595 Ashwood St | 0.16mi | 3/2.0 | 1,344 (+10%) | 16mo | $108,900 | $81 | 62 |
| 4904 Eagle Crest Blvd | 0.28mi | 3/2.0 | 1,056 (-13%) | 22mo | $85,000 | $80 | 47 |
Match score weights: distance 35% · size 25% · config 20% · recency 20%. Top-matched comps best support the ARV.
Projected returns pro-forma
-3.0% appreciation · 0.0% rent growth · sell at horizon
- IRR
- 27.0%
- Equity multiple
- 2.07×
- Total profit
- $38,802
- Equity at exit
- $19,234
- IRR
- 32.7%
- Equity multiple
- 3.55×
- Total profit
- $92,213
- Equity at exit
- $11,154
Cash invested: $36,120 (down + closing). Projections, not guarantees.
Landlord ↔ Tenant lean methodology
- Overall (STATE)
- 38 Tenant-Leaning
- State Colorado
- 38 Tenant-Leaning · D+4
- County
- — inherits STATE
- City
- — inherits STATE
ZIP-level market 80504
- Rents YoY
- -2.3%
- Active inventory
- 534
- Price-to-rent
- 4.4×
Monthly cashflow live
- Estimated rent
- $2,458 high interval (Pro) →
- Mortgage (P&I)
- −$676
- Tax est. 1.5%
- −$161 /mo · $1,935/yr
- Insurance
- −$54
- HOA
- −$0
- Vacancy / Maint / Mgmt
- −$516
- Net cashflow
- $1,050
Break-even live
Sensitivity live
| Price | -10% $1,139 | -5% $1,095 | +0% $1,050 | +5% $1,005 | +10% $961 |
|---|---|---|---|---|---|
| Rent | -10% $856 | -5% $953 | +0% $1,050 | +5% $1,147 | +10% $1,244 |
| Rate | -1.0pp $1,115 | -0.5pp $1,083 | base $1,050 | +0.5pp $1,017 | +1.0pp $983 |
UW: 25.0% down · 7.5% · 30yr · 1.5% tax · 5.0% vac · 8.0% maint · 8.0% mgmt
Financing live
Cash to close
- Down payment
- $32,250
- Closing costs
- $3,870
- Reserves months
- —
- Total cash needed
- —
Loan-product check · same deal, 3 products live
Conventional
25% down · 7.5% · 30yr
- Down + closing
- —
- Monthly P&I
- —
- Monthly cashflow
- —
- DSCR
- —
- Eligible?
- —
Personal DTI + credit; lowest rate.
DSCR
20% down · 8.5% · 30yr
- Down + closing
- —
- Monthly P&I
- —
- Monthly cashflow
- —
- DSCR
- —
- Eligible?
- —
No personal income docs; deal must DSCR.
Hard money
10% down · 12.0% · 12mo
- Down + closing
- —
- Monthly P&I
- —
- Monthly cashflow
- —
- DSCR
- —
- Eligible?
- —
Short-term bridge; refi at stabilization.
Rent comps 5 comps
| Address | Beds | Baths | Sqft | Rent | $/sqft | DOM | Units | Dist |
|---|---|---|---|---|---|---|---|---|
| 10670 Jake Jabs Blvd Firestone, CO | 1.0–3.0 | 1.0–2.0 | 1036 | $2,595 | $2.50 | 14d | 26 | 0.26mi |
| 10910 Turner Blvd #70 Longmont, CO | 3.0 | 2.0 | 1152 | $1,999 | $1.74 | 22d | 1 | 0.89mi |
| 10692 Durango Pl Longmont, CO | 3.0 | 2.0 | 1500 | $2,395 | $1.60 | 22d | 1 | 1.04mi |
| 10426 Durango Pl Longmont, CO | 3.0 | 2.0 | 1500 | $2,350 | $1.57 | 22d | 1 | 1.06mi |
| 10767 Cimarron St Firestone, CO | 1.0–2.0 | 1.0–2.0 | 760 | $1,725 | $2.27 | 14d | 6 | 1.16mi |
Listing history 15 events
-
2026-06-18days on market $129,000 Active 71 DOM
-
2026-06-17days on market $129,000 Active 70 DOM
-
2026-06-16days on market $129,000 Active 69 DOM
-
2026-06-15days on market $129,000 Active 68 DOM
-
2026-06-14days on market $129,000 Active 66 DOM
-
2026-06-13days on market $129,000 Active 65 DOM
-
2026-06-09days on market $129,000 Active 62 DOM
-
2026-06-09days on market $129,000 Active 61 DOM
-
2026-06-07days on market $129,000 Active 60 DOM
-
2026-06-02days on market $129,000 Active 55 DOM
-
2026-06-01days on market $129,000 Active 54 DOM
-
2026-05-31days on market $129,000 Active 53 DOM
-
2026-05-30days on market $129,000 Active 52 DOM
-
2026-04-21price $129,000
-
2026-01-02$130,000 Active
ⓘ Source: listings_history table (triggers on properties + properties_extension) + one-shot
backfill from property_details.listing_events for pre-trigger history.
Nearby sold comps map
Loading sold comps map…
Walkable amenities ~0.75 mi
Loading nearby amenities…
Taxation est. · year 1
- Rental income
- $29,490
- − Mortgage interest
- −$7,226
- − Property taxes
- −$1,935
- − Insurance
- −$645
- − Repairs & maintenance
- −$2,359
- − Management
- −$2,359
- − Depreciation
- −$3,753
- Taxable income
- $11,213
- Est. tax owed @ 24.0%
- −$2,691
- After-tax cash flow
- $9,908/yr
For passive investors: Depreciation is non-cash, so a rental often shows a tax loss while cash-flowing — sheltering income. Rental losses are passive: they offset passive income freely, and up to $25,000/yr can offset ordinary (W-2) income if you actively participate and your MAGI is under $100k (phasing out to $0 by $150k); unused losses carry forward. On sale, claimed depreciation is recaptured at up to 25%, and gains may owe capital-gains tax (a 1031 exchange can defer both). Figures are a year-1 estimate at your 24.0% rate — not tax advice; consult a CPA.
Condition & rehab AI · 12 photos
This mobile home is in average condition with some cosmetic updates needed. It offers a good starting point for a potential investor looking to make it move-in ready.
Repairs flagged
- Minor kitchen backsplash — slight discoloration
- Minor paint touch-ups — light paint wear
Value-add opportunities
- Both paint interior walls — refreshes the interior and improves curb appeal
- Both install new backsplash — enhances kitchen functionality and aesthetics
- Both landscaping improvements — enhances curb appeal and adds value
Renovation cost estimate screening
| Repair item | Severity | Est. cost |
|---|---|---|
| kitchen backsplash · slight discoloration | Minor | $500–3,000 |
| paint touch-ups · light paint wear | Minor | $500–3,000 |
| Total estimated repair cost · 2 items | $1,000–6,000 |
Value-add ROI direction
- Both paint interior walls — refreshes the interior and improves curb appeal ↑
- Both install new backsplash — enhances kitchen functionality and aesthetics ↑
- Both landscaping improvements — enhances curb appeal and adds value ↑
ⓘ Cost ranges are severity-bucket heuristics (US national rule-of-thumb). Get contractor quotes + a written scope before underwriting a rehab budget.
Schools (NCES district)
- District
- St. Vrain Valley School District No. Re1J
- NCES district ID
- 0805370
- Math proficiency
- 32% ▼ -8.00%
- Reading proficiency
- 51% ▬ 0.00%
- Median HH income
- $71,571
- Composite
- 37.73/100
- National rank
- #4353
- State rank
- #23 of 86 in CO
Livability — Firestone
- Score
- 73/100
- State rank
- #44
- US rank
- #5060
Category grades
Schools grade is shown separately in the Schools card above.
Census & demographics
- Census place
- Firestone, CO
- County
- Weld County · 332,652 people
- City population
- 1,684
- Metro
- Greeley, CO
- Population (ZIP)
- 63,451
- Household income
- $113,643
- Rent vs Own
- Severe rent burden
- 1028.0
Population outlook (Weld County) Hauer SSP2
- Today (2025)
- 351,957 people
- By 2030
- 385,304 · +9.5%
- By 2040
- 451,818 · +28.4%
- By 2050
- 514,478 · +46.2%
- By 2075
- 648,733 · +84.3%
- By 2100
- 720,400 · +104.7%
Race, ethnicity, and origin ACS 2023
- Neighborhood character
- Predominantly White (68%)
- Race & ethnicity
- White 68% Hispanic / Latino 24% Two or more races 13% Asian 3%
- Hispanic origin (detail)
- Mexican 18%
- Common ancestry
- Lithuanian 3% Italian 2% Iranian 2%
- Foreign-born
- 8% · Canada, Vietnam
- Languages at home
- 84% English-only · Spanish 13% Other Asian/Pacific 1%
Political lean MEDSL · Weld
- 2024 margin
- Strong R (+21.0) · D 38.2% · R 59.2% · Other 2.6%
- 2008→2024 swing
- -12.2pp toward R · 2008: -8.7pp · 2024: -21.0pp
- All cycles
- 2024: R+21.0 2020: R+18.0 2016: R+22.4 2012: R+13.2 2008: R+8.7
Not yet ingested
- Civics
- —
Market trends
- HPI YoY
- ▼ -534.45%
- Current HPI
- 245.1351
- Rent YoY
- ▼ -2.34%
- Metro
- Greeley, CO
- State GDP YoY
- ▲ 1.95%
- F500 in state
- 14
Industry mix (Fortune 500 HQ in CO)
| Industry | F500 HQs | Revenue |
|---|---|---|
| Technology Distribution | 1 | $31B |
|
||
| Food / Agriculture | 1 | $18B |
|
||
| Packaging | 1 | $14B |
|
||
| Healthcare | 1 | $13B |
|
||
| Energy | 1 | $10B |
|
||
| Technology | 1 | $4B |
|
||
Price history
-0.8% since first listed2 events — show timeline
- 2026-04-21 Price Changed $129,000 REColorado as Distributed by MLS Grid
- 2026-01-02 Listed $130,000 REColorado as Distributed by MLS Grid
Cash-flow waterfall
monthlySold comps — $/sqft
last 12 mo · ≤1 miLoading sold comps…