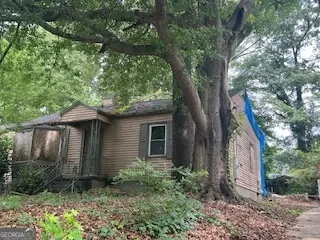
1339 Lanvale Dr SW · Atlanta, GA
Flood risk 1/10 · Minimal
- FEMA flood zone
- X (unshaded)
- Chance of flooding over 30 yrs
- 0.0%
- Est. flood insurance / yr
- $473 – $860
Fire risk 1/10 · Minimal
- Est. fire insurance / yr
- $963 – $1,789
Heat risk 5/10 · Moderate
- Hot days now (above 104°F)
- 7 days/yr
- Hot days in 30 yrs
- 16 days/yr
Wind risk 6/10 · Moderate
- Chance of severe wind over 30 yrs
- 27.0%
Air-quality risk 4/10 · Minor
- Unhealthy air days now
- 4 days/yr
- Unhealthy air days in 30 yrs
- 6 days/yr
Risk factors via First Street. Map © Google.
Why this score? — see what drove the B grade
The composite is a weighted blend of 9 inputs, each scored 0–100. Each bar is that input's sub-score; the figure is the points it added to the 100-point composite (weight × sub-score).
- Cash flow +30.0/30.0
- 1% rule +10.0/10.0
- DSCR +10.0/10.0
- ARV discount +7.5/15.0
- Livability +4.2/5.0
- Rent growth +3.2/5.0
- Schools +2.7/10.0
- Condition / age +2.5/5.0
- Appreciation +0.0/10.0
$135,000
🖨 Deal sheet 📄 Offer letter ✓ Due diligence
Listing remarks MLS
Incredible opportunity investment property, in the heart of Atlanta's vibrant Oakland City neighborhood! Just minutes from the BeltLine, MARTA, West End, and downtown attractions, this 0.201-acre lot offers easy access to parks, shopping, and dining. Surrounded by new construction and renovations, this is a prime location for builders, developers, or homeowners looking to create something special. Zoned R4. Utilities available. Buyer must do due diligence.
Key facts
- New construction
- Heart of atlanta
- Renovations
Tags
Neighborhood map
What this means for you Summary
Snapshot
- This is a 2-bed/1.0-bath single-family listed at $135k.
Deal economics
- At list price, monthly cash flow is $542 ($7k/yr) — positive.
- The deal already cash-flows at list — no discount required.
- Meets the 1% rule at list price ($2k rent vs $135k).
- Recommended offer: $127k (6.0% below list) — sets the bar for market timing.
- Cap rate 11.1% vs local median 3.1% in Atlanta — top-decile yield for the area; either an underpriced asset or a hidden risk that comps aren't pricing in. Stress-test before assuming the spread holds.
Location & tenants
- Location reads 83/100 on livability (#6 in GA, #919 nationally) — a professional / high-income tenant draw. Strengths: amenities A+, commute A+, housing A+; Watch: schools C-, cost of living C-.
- Atlanta Public Schools (urban): math 28% / reading 35% proficiency, ranked #80 of 174 in GA (top 46%) — families likely to look elsewhere, expect single-tenant / working-renter base with shorter leases; 71% free/reduced lunch — lower-income household profile, screen leases tightly.
- Market conditions: Rents rising (+2.8%/yr); 452 active listings in the ZIP; 40 comparable units currently listed for rent nearby; rentals at typical pace (median 25d on market — plan ~3-4 weeks tenant-placement turnaround); 11,565 units permitted in Fulton County in 2024 (8,159 in 5+ unit buildings).
- At $2,038/mo this rent would consume 46% of the median local household income ($53k/yr) (locally 1676% of renters already pay >50% of income on rent) — very limited rent-growth headroom before tenants either downsize or default.
Forward outlook
- Local home prices are declining (-3.0%/yr); year-one equity from $933 of loan paydown is wiped out by about $4k of value loss. Plan a longer hold.
- Fulton County population projected at +38% by 2050 — long-run rental-demand tailwind backs the buy-and-hold thesis.
- At projected returns (-3.0% appreciation + 2.8% rent growth), your $38k cash investment doubles in ~8 years — after that, you're playing with house money.
Negotiation context
- It's been on market 86 days — a 6% lower offer ($127k) is reasonable based on typical stale-listing flexibility.
- 5 sale attempts since 19y ago with the ask held roughly flat each time — persistent listings suggest the price (not the market) is what's stuck; bring a comps-based counter.
Risks & watch-outs
- Watch-outs: property tax is 2.7% of price; built in 1950 — expect roof / HVAC / electrical / plumbing capex.
- Climate carrying-cost: major wind risk, 27% chance of damaging wind over 30y; extreme-heat days projected 7→16/yr by 2055 (HVAC capex compounding) — expect insurance premiums to compound above CPI over the hold.
Questions for the listing agent
- It's been on market 86 days. Have you received any prior offers? Is the seller open to a 6% concession, seller financing, or rate buy-down credit?
- Built in 1950 — when were the roof, HVAC, electrical panel, plumbing, and water heater last replaced?
- Property tax is high relative to price — has the assessment been appealed recently, and will the sale trigger a re-assessment?
- Why hasn't it sold? Are there any deal-killer items the seller is aware of (foundation, flood, title, zoning, code violations)?
- Is there a deadline driving the sale (1031 exchange, divorce, estate, relocation)? That informs how much negotiation room exists.
- What's the average days-on-market for RENTAL listings here right now (not sales)? A rising rental-DOM trend means longer vacancies and softer asking-rent achievability than the comps imply.
- What's the recent tenant-quality profile in this submarket — average credit score on applications, eviction rate, late-payment / NSF rate, and stable-employment percentage? A property-management company in the area should have these aggregated.
- How much new for-sale + rental construction is in the pipeline within 1–3 miles? Heavy new supply typically softens prices + rents 12–24 months out; constrained supply supports both.
Investment metrics
- 1% rule
- 1.51% ✓
- Cap rate
- 11.11%
- Cash-on-cash
- 17.21%
- DSCR
- 1.77
- GRM
- 5.5
CMA / ARV
- ARV (median comp)
- $367,039
- List price
- $135,000
- Delta
- -63.22%
- Verdict
- UNDERPRICED
- Comps
- 20 within 1.0 mi
Show comp detail 12 sales within ~0.75 mi
| Address | Dist | Beds/Ba | Sqft | Sold | Price | $/sf | Match |
|---|---|---|---|---|---|---|---|
| 1255 Ladd St SW | 0.26mi | 3/2.0 (+1) | 1,800 (+9%) | 1mo | $420,000 | $233 | 63 |
| 1384 Epworth St SW | 0.49mi | 3/3.0 (+1) | 1,662 (+1%) | 1mo | $320,000 | $193 | 62 |
| 1589 Westhaven Dr SW | 0.74mi | 3/2.0 (+1) | 1,662 (+1%) | 0mo | $400,000 | $241 | 55 |
| 1417 Richland Rd | 0.49mi | 3/1.0 (+1) | 1,440 (-13%) | 1mo | $127,000 | $88 | 50 |
| 1481 Venetian Dr SW | 0.74mi | 3/1.0 (+1) | 1,752 (+6%) | 2mo | $140,000 | $80 | 49 |
| 1234 Princess Ave SW | 0.43mi | 3/2.0 (+1) | 1,450 (-12%) | 2mo | $335,000 | $231 | 49 |
| 988 Cascade Rd SW | 0.67mi | 3/2.5 (+1) | 1,727 (+4%) | 2mo | $500,000 | $290 | 49 |
| 1041 White Oak Ave SW | 0.56mi | 3/2.0 (+1) | 1,464 (-11%) | 1mo | $420,000 | $287 | 45 |
| 1340 Wichita Dr SW | 0.68mi | 3/2.0 (+1) | 1,800 (+9%) | 1mo | $340,000 | $189 | 43 |
| 920 Lawton St SW | 0.62mi | 3/2.0 (+1) | 1,469 (-11%) | 1mo | $350,000 | $238 | 42 |
| 1239 Avonwood Cir SW | 0.73mi | 3/2.0 (+1) | 1,432 (-13%) | 3mo | $200,000 | $140 | 32 |
| 1673 Altadena Pl SW | 0.74mi | 3/2.5 (+1) | 1,406 (-15%) | 1mo | $415,000 | $295 | 28 |
Match score weights: distance 35% · size 25% · config 20% · recency 20%. Top-matched comps best support the ARV.
Projected returns pro-forma
-3.0% appreciation · 2.77% rent growth · sell at horizon
- IRR
- 8.3%
- Equity multiple
- 1.33×
- Total profit
- $12,301
- Equity at exit
- $20,129
- IRR
- 17.4%
- Equity multiple
- 2.42×
- Total profit
- $53,719
- Equity at exit
- $11,672
Cash invested: $37,800 (down + closing). Projections, not guarantees.
Landlord ↔ Tenant lean methodology
- Overall (STATE)
- 90 Strongly Landlord-Friendly
- State Georgia
- 90 Strongly Landlord-Friendly · R+3
- County
- — inherits STATE
- City
- — inherits STATE
ZIP-level market 30310
- Home prices YoY
- -32.8%
- Rents YoY
- 2.8%
- Active inventory
- 452
- Price-to-rent
- 5.5×
Monthly cashflow live
- Estimated rent
- $2,038 high interval (Pro) →
- Mortgage (P&I)
- −$708
- Tax from tax record
- −$304 /mo · $3,647/yr
- Insurance
- −$56
- HOA
- −$0
- Vacancy / Maint / Mgmt
- −$428
- Net cashflow
- $542
Break-even live
UW: 25.0% down · 7.5% · 30yr · 1.5% tax · 5.0% vac · 8.0% maint · 8.0% mgmt
Financing live
Cash to close
- Down payment
- $33,750
- Closing costs
- $4,050
- Reserves months
- —
- Total cash needed
- —
Loan-product check · same deal, 3 products live
Conventional
25% down · 7.5% · 30yr
- Down + closing
- —
- Monthly P&I
- —
- Monthly cashflow
- —
- DSCR
- —
- Eligible?
- —
Personal DTI + credit; lowest rate.
DSCR
20% down · 8.5% · 30yr
- Down + closing
- —
- Monthly P&I
- —
- Monthly cashflow
- —
- DSCR
- —
- Eligible?
- —
No personal income docs; deal must DSCR.
Hard money
10% down · 12.0% · 12mo
- Down + closing
- —
- Monthly P&I
- —
- Monthly cashflow
- —
- DSCR
- —
- Eligible?
- —
Short-term bridge; refi at stabilization.
Rent comps 40 comps
| Address | Beds | Baths | Sqft | Rent | $/sqft | DOM | Units | Dist |
|---|---|---|---|---|---|---|---|---|
| 1389 Lanvale Dr SW Atlanta, GA | 3.0 | 2.0 | 1430 | $2,500 | $1.75 | 8d | 1 | 0.09mi |
| 1435 Lanvale Dr SW Atlanta, GA | 3.0 | 1.0 | 1547 | $1,800 | $1.16 | 8d | 1 | 0.18mi |
| 1157 Indale Pl SW Atlanta, GA | 3.0 | 2.0 | 1568 | $2,100 | $1.34 | 22d | 1 | 0.18mi |
| 1449 Lynford Dr SW Atlanta, GA | 3.0 | 1.0 | 1242 | $1,895 | $1.53 | 24d | 1 | 0.20mi |
| 1449 Lynford Dr SW Atlanta, GA | 3.0 | 1.0 | 1242 | $1,895 | $1.53 | 18d | 1 | 0.20mi |
| 1316 Plaza Ave SW Atlanta, GA | 3.0 | 2.0 | 1692 | $1,825 | $1.08 | 8d | 1 | 0.28mi |
| 1291 Lorenzo Dr SW Unit 1 Atlanta, GA | 3.0 | 1.0 | 1100 | $1,825 | $1.66 | 15d | 1 | 0.29mi |
| 1192 Arlington Ave SW Atlanta, GA | 1.0 | 1.0 | 1236 | $900 | $0.73 | 18d | 1 | 0.30mi |
| 1307 Lorenzo Dr SW Unit A Atlanta, GA | 3.0 | 2.0 | 1300 | $1,795 | $1.38 | 24d | 1 | 0.32mi |
| 1280 Elizabeth Ave SW Atlanta, GA | 3.0 | 1.0 | 1105 | $1,950 | $1.76 | 24d | 1 | 0.34mi |
| 1310 Kenilworth Dr SW Atlanta, GA | 3.0 | 2.0 | 1192 | $2,000 | $1.68 | 24d | 1 | 0.34mi |
| 1537 Orlando St SW Atlanta, GA | 2.0 | 1.0 | 1068 | $1,700 | $1.59 | 24d | 1 | 0.35mi |
| 1246 Westmont Rd SW Atlanta, GA | 3.0 | 1.0 | 1200 | $1,500 | $1.25 | 3d | 1 | 0.36mi |
| 1239 Plaza Ave SW Atlanta, GA | 1.0 | 1.0 | 1900 | $1,015 | $0.53 | 24d | 1 | 0.37mi |
| 1346 Lorenzo Dr SW Atlanta, GA | 3.0 | 2.0 | 1486 | $5,000 | $3.36 | 24d | 1 | 0.39mi |
| 1255 Westmont Rd SW Atlanta, GA | 3.0 | 2.0 | 1500 | $1,695 | $1.13 | 24d | 1 | 0.40mi |
| 966 Gaston St SW Atlanta, GA | 3.0 | 2.5 | 1331 | $2,250 | $1.69 | 24d | 1 | 0.41mi |
| 1077 Peeples St SW Atlanta, GA | 1.0 | 1.0 | 1718 | $1,000 | $0.58 | 24d | 1 | 0.44mi |
| 1250 Byewood Ln SW Atlanta, GA | 2.0 | 2.0 | 1100 | $2,150 | $1.95 | 24d | 1 | 0.45mi |
| 1255 Campbellton Rd SW Atlanta, GA | 3.0 | 2.0 | 1305 | $2,095 | $1.61 | 24d | 1 | 0.51mi |
| 1435 Richland Rd SW Atlanta, GA | 3.0 | 2.0 | 1637 | $2,875 | $1.76 | 15d | 1 | 0.51mi |
| 1586 Ocala Ave SW Atlanta, GA | 1.0 | 1.0 | 1400 | $600 | $0.43 | 24d | 1 | 0.52mi |
| 1180 Richland Rd SW Atlanta, GA | 3.0 | 2.0 | 1082 | $2,800 | $2.59 | 24d | 1 | 0.55mi |
| 1427 Lorenzo Dr SW Atlanta, GA | 3.0 | 2.0 | 1128 | $1,995 | $1.77 | 24d | 1 | 0.55mi |
| 1448 Westboro Dr SW Atlanta, GA | 3.0 | 2.0 | 1437 | $2,300 | $1.60 | 8d | 1 | 0.57mi |
| 2159 M L King Jr DR SW Atlanta, GA | 1.0 | 1.0 | 1050 | $800 | $0.76 | 3d | 1 | 0.61mi |
| 1300 Wichita Dr SW Atlanta, GA | 3.0 | 2.0 | 1077 | $2,200 | $2.04 | 24d | 1 | 0.62mi |
| 1313 Aniwaka Ave SW Atlanta, GA | 3.0 | 2.0 | 1530 | $2,145 | $1.40 | 2d | 1 | 0.62mi |
| 1408 Lockwood Dr SW Atlanta, GA | 3.0 | 2.0 | 1300 | $1,950 | $1.50 | 24d | 1 | 0.63mi |
| 1158 Donnelly Ave SW Atlanta, GA | 1.0 | 1.0 | 1980 | $725 | $0.37 | 24d | 1 | 0.66mi |
| 1346 Wichita Dr SW Atlanta, GA | 3.0 | 2.0 | 1183 | $2,125 | $1.80 | 8d | 1 | 0.66mi |
| 1474 Beecher St SW Atlanta, GA | 3.0 | 2.0 | 1332 | $3,200 | $2.40 | 24d | 1 | 0.67mi |
| 1443 Venetian Dr SW Atlanta, GA | 3.0 | 1.0 | 1139 | $1,395 | $1.22 | 24d | 1 | 0.67mi |
| 1473 Beecher St SW Atlanta, GA | 3.0 | 2.0 | 1547 | $2,600 | $1.68 | 24d | 1 | 0.70mi |
| 1578 Linda Way SW Atlanta, GA | 3.0 | 2.0 | 1343 | $2,030 | $1.51 | 14d | 1 | 0.82mi |
| 702 Cascade Ave SW Atlanta, GA | 3.0 | 4.0 | 2220 | $2,850 | $1.28 | 24d | 1 | 0.87mi |
| 1513 Melrose Dr SW Atlanta, GA | 3.0 | 2.0 | 1544 | $2,200 | $1.42 | 17d | 1 | 0.89mi |
| 1425 Oglethorpe Ave SW Atlanta, GA | 3.0 | 2.0 | 1540 | $2,950 | $1.92 | 5d | 1 | 0.91mi |
| 1587 Olympian Cir SW Unit B Atlanta, GA | 2.0 | 1.0 | 1086 | $1,300 | $1.20 | 24d | 1 | 0.91mi |
| 1264 Hartford Ave SW Atlanta, GA | 3.0 | 2.0 | 1290 | $1,989 | $1.54 | 24d | 1 | 0.92mi |
Listing history 32 events
-
2026-06-18days on market $135,000 Active 86 DOM
-
2026-06-17days on market $135,000 Active 85 DOM
-
2026-06-16days on market $135,000 Active 84 DOM
-
2026-06-15days on market $135,000 Active 83 DOM
-
2026-06-13days on market $135,000 Active 81 DOM
-
2026-06-13days on market $135,000 Active 80 DOM
-
2026-06-09days on market $135,000 Active 77 DOM
-
2026-06-08days on market $135,000 Active 76 DOM
-
2026-06-07days on market $135,000 Active 75 DOM
-
2026-06-04days on market $135,000 Active 72 DOM
-
2026-06-03days on market $135,000 Active 71 DOM
-
2026-06-02days on market $135,000 Active 70 DOM
-
2026-06-01days on market $135,000 Active 69 DOM
-
2026-05-31days on market $135,000 Active 68 DOM
-
2026-03-06$135,000 New 460-char remark
Show marketing remark (460 chars)
Incredible opportunity investment property, in the heart of Atlanta's vibrant Oakland City neighborhood! Just minutes from the BeltLine, MARTA, West End, and downtown attractions, this 0.201-acre lot offers easy access to parks, shopping, and dining. Surrounded by new construction and renovations, this is a prime location for builders, developers, or homeowners looking to create something special. Zoned R4. Utilities available. Buyer must do due diligence.
-
2025-12-31historical
-
2025-07-24$160,000 New
-
2023-08-22soldstatus $134,000
-
2023-06-30soldstatus $95,000 Closed
-
2023-06-30soldstatus $95,000 Sold
-
2023-06-30soldstatus $95,000
-
2023-06-17status Under Contract
-
2023-06-17status Pending
-
2023-05-24$105,000 Active
-
2023-05-24$105,000 New
-
2020-07-24soldstatus $1,515,400
-
2008-04-07soldstatus $30,000
-
2007-11-30$39,000
-
2006-05-05soldstatus $250,000
-
2005-07-29soldstatus $111,000
-
2003-10-15soldstatus $168,000
-
1998-08-25soldstatus $68,500
ⓘ Source: listings_history table (triggers on properties + properties_extension) + one-shot
backfill from property_details.listing_events for pre-trigger history.
Tax reassessment forecast GA · Resets to sale price
- Current annual tax
- $3,647 · $304/mo
- Projected year-2 tax
- $3,647 · $304/mo
- Expected delta
- $0/yr ($0/mo · 0.0%)
ⓘ Screening estimate from a state-policy table — verify with the county assessor before closing.
Climate risk First Street
- Flood 1/10 Low FEMA zone X (unshaded) · 0% chance over 30 yrs
- Wildfire 1/10 Low
- Heat 5/10 Major 7 d/yr ≥104°F today · 16 d/yr by 30 yrs out
- Wind 6/10 Major 27% chance of damaging wind over 30 yrs
- Air quality 4/10 Moderate 4 unhealthy d/yr today · 6 by 30 yrs out
Nearby sold comps map
Loading sold comps map…
Walkable amenities ~0.75 mi
Loading nearby amenities…
Taxation est. · year 1
- Rental income
- $24,461
- − Mortgage interest
- −$7,562
- − Property taxes
- −$3,647
- − Insurance
- −$675
- − Repairs & maintenance
- −$1,957
- − Management
- −$1,957
- − Depreciation
- −$3,927
- Taxable income
- $4,736
- Est. tax owed @ 24.0%
- −$1,137
- After-tax cash flow
- $5,370/yr
For passive investors: Depreciation is non-cash, so a rental often shows a tax loss while cash-flowing — sheltering income. Rental losses are passive: they offset passive income freely, and up to $25,000/yr can offset ordinary (W-2) income if you actively participate and your MAGI is under $100k (phasing out to $0 by $150k); unused losses carry forward. On sale, claimed depreciation is recaptured at up to 25%, and gains may owe capital-gains tax (a 1031 exchange can defer both). Figures are a year-1 estimate at your 24.0% rate — not tax advice; consult a CPA.
Schools (NCES district)
- District
- Atlanta Public Schools
- NCES district ID
- 1300120
- Math proficiency
- 28% ▼ -6.00%
- Reading proficiency
- 35% ▼ -2.00%
- Median HH income
- $48,306
- Composite
- 27.27/100
- National rank
- #7006
- State rank
- #80 of 174 in GA
Livability — Atlanta
- Score
- 83/100
- State rank
- #6
- US rank
- #919
Category grades
Schools grade is shown separately in the Schools card above.
Census & demographics
- Census place
- Atlanta, GA
- County
- Fulton County · 1,094,430 people
- City population
- 629,525
- Metro
- Atlanta-Sandy Springs-Alpharetta, GA
- Population (ZIP)
- 27,186
- Household income
- $53,037
- Rent vs Own
- Severe rent burden
- 1676.0
Population outlook (Fulton County) Hauer SSP2
- Today (2025)
- 1,203,707 people
- By 2030
- 1,299,706 · +8.0%
- By 2040
- 1,488,256 · +23.6%
- By 2050
- 1,664,580 · +38.3%
- By 2075
- 2,036,072 · +69.2%
- By 2100
- 2,222,402 · +84.6%
Race, ethnicity, and origin ACS 2023
- Neighborhood character
- Predominantly Black (76%)
- Race & ethnicity
- Black 76% White 14% Two or more races 4% Hispanic / Latino 4% Asian 2%
- Common ancestry
- Lithuanian 1% Slovak 1% Serbian 0%
- Foreign-born
- 5% · Canada, South Korea, Vietnam
- Languages at home
- 92% English-only · Spanish 4% French/Haitian/Cajun 1% Other Indo-European 1%
Political lean MEDSL · Fulton
- 2024 margin
- Solid D (+44.9) · D 71.9% · R 27.0% · Other 1.1%
- 2008→2024 swing
- +9.8pp toward D · 2008: 35.0pp · 2024: 44.9pp
- All cycles
- 2024: D+44.9 2020: D+46.4 2016: D+42.1 2012: D+29.6 2008: D+35.0
Not yet ingested
- Civics
- —
Market trends
- HPI YoY
- ▼ -204.00%
- Current HPI
- 418.7297
- Rent YoY
- ▲ 2.77%
- Metro
- Atlanta-Sandy Springs-Alpharetta, GA
- State GDP YoY
- ▲ 2.66%
- F500 in state
- 28
Industry mix (Fortune 500 HQ in GA)
| Industry | F500 HQs | Revenue |
|---|---|---|
| Paper / Packaging | 2 | $29B |
|
||
| Retail | 1 | $160B |
|
||
| Transportation / Logistics | 1 | $91B |
|
||
| Airlines | 1 | $62B |
|
||
| Consumer Goods | 1 | $47B |
|
||
| Utilities | 1 | $25B |
|
||
Price history
+97.1% since first listed18 events — show timeline
- 2026-03-06 Listed $135,000 GAMLS
- 2025-12-31 Listing Removed — GAMLS
- 2025-07-24 Listed $160,000 GAMLS
- 2023-08-22 Sold (Public Records) $134,000 Public Records
- 2023-06-30 Sold (Public Records) $95,000 Public Records
- 2023-06-30 Sold (MLS) $95,000 GAMLS
- 2023-06-30 Sold (MLS) $95,000 FMLS
- 2023-06-17 Pending — GAMLS
- 2023-06-17 Pending — FMLS
- 2023-05-24 Listed $105,000 GAMLS
- 2023-05-24 Listed $105,000 FMLS
- 2020-07-24 Sold (Public Records) $1,515,400 Public Records
- 2008-04-07 Sold (MLS) $30,000 FMLS
- 2007-11-30 Listed $39,000 FMLS
- 2006-05-05 Sold (Public Records) $250,000 Public Records
- 2005-07-29 Sold (Public Records) $111,000 Public Records
- 2003-10-15 Sold (Public Records) $168,000 Public Records
- 1998-08-25 Sold (Public Records) $68,500 Public Records
Property tax history
+2.4%/yrLatest (2025): $3,647 · -13.0% YoY. Source: county tax records.
Cash-flow waterfall
monthlySold comps — $/sqft
last 12 mo · ≤1 miLoading sold comps…