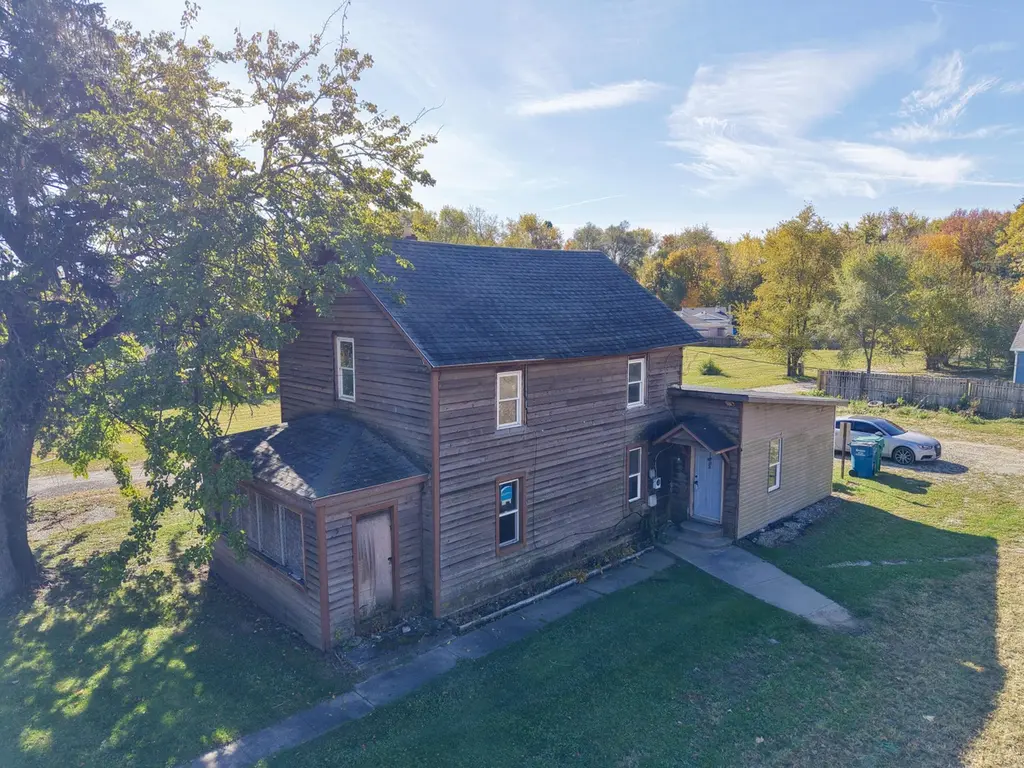
3466 S State Road 104 · Stillwell, IN
Flood risk 1/10 · Minimal
- FEMA flood zone
- X (unshaded)
- Chance of flooding over 30 yrs
- 0.0%
- Est. flood insurance / yr
- $473 – $860
Fire risk 1/10 · Minimal
- Est. fire insurance / yr
- $717 – $1,331
Heat risk 2/10 · Minimal
- Hot days now (above 100°F)
- 7 days/yr
- Hot days in 30 yrs
- 16 days/yr
Wind risk 2/10 · Minimal
- Chance of severe wind over 30 yrs
- —
Air-quality risk 2/10 · Minimal
- Unhealthy air days now
- 2 days/yr
- Unhealthy air days in 30 yrs
- 2 days/yr
Risk factors via First Street. Map © Google.
Why this score? — see what drove the B- grade
The composite is a weighted blend of 9 inputs, each scored 0–100. Each bar is that input's sub-score; the figure is the points it added to the 100-point composite (weight × sub-score).
- Cash flow +30.0/30.0
- 1% rule +10.0/10.0
- DSCR +10.0/10.0
- ARV discount +7.5/15.0
- Schools +3.5/10.0
- Rent growth +2.5/5.0
- Livability +2.5/5.0
- Condition / age +2.5/5.0
- Appreciation +0.0/10.0
$59,000
🖨 Deal sheet 📄 Offer letter ✓ Due diligence
Key facts
- 6,700 sq ft lot
- Built 1910
- Listed 22 days
Property features AI
Finance
- Other: Property currently vacant
Exterior
- Parking: Gravel parking
- Utilities: Other utilities; Other water source; Other electric; Other sewer
- Home design: Two levels; Built in 1910
- Construction: Unfinished basement
- Exterior features: Other exterior features; Other view
Interior
- Kitchen: Other appliances
- Bedrooms: Primary bedroom; Bedroom 2
- Flooring: Other flooring
- Bathrooms: 1 full bathroom
- Heating & cooling: Other heating; Other cooling
- Interior features: Other interior features
- Laundry & utility: Unspecified utilities/appliances
Neighborhood map
What this means for you Summary
Snapshot
- This is a 2-bed/1.0-bath single-family listed at $59k.
Deal economics
- At list price, monthly cash flow is $686 ($8k/yr) — positive.
- The deal already cash-flows at list — no discount required.
- Meets the 1% rule at list price ($1k rent vs $59k).
- Recommended offer: $58k (1.5% below list) — sets the bar for market timing.
Location & tenants
- Location reads: area grade B — affects rentability + tenant quality, not the cash-flow math above.
- Laporte Community School Corporation (urban): math 37% / reading 44% proficiency, ranked #139 of 301 in IN (top 46%) — families likely to look elsewhere, expect single-tenant / working-renter base with shorter leases.
- Market conditions: 260 active listings in the ZIP; 216 units permitted in LaPorte County in 2024 (75 in 5+ unit buildings).
Forward outlook
- Local home prices are declining (-3.0%/yr); year-one equity from $408 of loan paydown is wiped out by about $2k of value loss. Plan a longer hold.
- LaPorte County population projected to shrink 7% by 2050 — rents likely to lag national; underwrite the cash flow, not the appreciation.
- At projected returns (-3.0% appreciation + 3.0% rent growth), your $17k cash investment doubles in ~3 years — after that, you're playing with house money.
Negotiation context
- It's been on market 23 days — a 2% lower offer ($58k) is reasonable based on typical stale-listing flexibility.
- 4 sale attempts with the ask held roughly flat each time — persistent listings suggest the price (not the market) is what's stuck; bring a comps-based counter.
Risks & watch-outs
- Watch-outs: built in 1910 — expect roof / HVAC / electrical / plumbing capex.
Questions for the listing agent
- Built in 1910 — when were the roof, HVAC, electrical panel, plumbing, and water heater last replaced?
- Is there a deadline driving the sale (1031 exchange, divorce, estate, relocation)? That informs how much negotiation room exists.
- What's the average days-on-market for RENTAL listings here right now (not sales)? A rising rental-DOM trend means longer vacancies and softer asking-rent achievability than the comps imply.
- What's the recent tenant-quality profile in this submarket — average credit score on applications, eviction rate, late-payment / NSF rate, and stable-employment percentage? A property-management company in the area should have these aggregated.
- How much new for-sale + rental construction is in the pipeline within 1–3 miles? Heavy new supply typically softens prices + rents 12–24 months out; constrained supply supports both.
Investment metrics
- 1% rule
- 2.21% ✓
- Cap rate
- 20.24%
- Cash-on-cash
- 49.81%
- DSCR
- 3.22
- GRM
- 3.8
CMA / ARV
- ARV (on-the-fly)
- $210,600
- Comps found
- 1
Show comp detail 1 sale within ~0.75 mi
| Address | Dist | Beds/Ba | Sqft | Sold | Price | $/sf | Match |
|---|---|---|---|---|---|---|---|
| 6 W Hupp Rd | 0.02mi | 3/2.0 (+1) | 1,528 (+9%) | 8mo | $229,900 | $150 | 69 |
Match score weights: distance 35% · size 25% · config 20% · recency 20%. Top-matched comps best support the ARV.
Projected returns pro-forma
-3.0% appreciation · 3.0% rent growth · sell at horizon
- IRR
- 47.5%
- Equity multiple
- 3.06×
- Total profit
- $34,092
- Equity at exit
- $8,797
- IRR
- 53.1%
- Equity multiple
- 6.20×
- Total profit
- $85,842
- Equity at exit
- $5,101
Cash invested: $16,520 (down + closing). Projections, not guarantees.
Landlord ↔ Tenant lean methodology
- Overall (STATE)
- 90 Strongly Landlord-Friendly
- State Indiana
- 90 Strongly Landlord-Friendly · R+11
- County
- — inherits STATE
- City
- — inherits STATE
ZIP-level market 46350
- Active inventory
- 260
- Price-to-rent
- 3.8×
Monthly cashflow live
- Estimated rent
- $1,303 medium interval (Pro) →
- Mortgage (P&I)
- −$309
- Tax from tax record
- −$10 /mo · $118/yr
- Insurance
- −$25
- HOA
- −$0
- Vacancy / Maint / Mgmt
- −$274
- Net cashflow
- $686
Break-even live
UW: 25.0% down · 7.5% · 30yr · 1.5% tax · 5.0% vac · 8.0% maint · 8.0% mgmt
Financing live
Cash to close
- Down payment
- $14,750
- Closing costs
- $1,770
- Reserves months
- —
- Total cash needed
- —
Loan-product check · same deal, 3 products live
Conventional
25% down · 7.5% · 30yr
- Down + closing
- —
- Monthly P&I
- —
- Monthly cashflow
- —
- DSCR
- —
- Eligible?
- —
Personal DTI + credit; lowest rate.
DSCR
20% down · 8.5% · 30yr
- Down + closing
- —
- Monthly P&I
- —
- Monthly cashflow
- —
- DSCR
- —
- Eligible?
- —
No personal income docs; deal must DSCR.
Hard money
10% down · 12.0% · 12mo
- Down + closing
- —
- Monthly P&I
- —
- Monthly cashflow
- —
- DSCR
- —
- Eligible?
- —
Short-term bridge; refi at stabilization.
Listing history 24 events
-
2026-06-19days on market $59,000 Active 23 DOM
-
2026-06-18days on market $59,000 Active 22 DOM
-
2026-06-17days on market $59,000 Active 21 DOM
-
2026-06-16days on market $59,000 Active 20 DOM
-
2026-06-15days on market $59,000 Active 19 DOM
-
2026-06-14days on market $59,000 Active 17 DOM
-
2026-06-13days on market $59,000 Active 16 DOM
-
2026-06-10days on market $59,000 Active 14 DOM
-
2026-06-09days on market $59,000 Active 13 DOM
-
2026-06-08days on market $59,000 Active 12 DOM
-
2026-06-07days on market $59,000 Active 11 DOM
-
2026-06-05days on market $59,000 Active 8 DOM
-
2026-06-02days on market $59,000 Active 6 DOM
-
2026-06-01days on market $59,000 Active 5 DOM
-
2026-05-31days on market $59,000 Active 4 DOM
-
2026-05-30days on market $59,000 Active 3 DOM
-
2026-05-27$59,000 Active
-
2026-04-04historical
-
2026-03-17$59,000 Active
-
2026-03-17historical
-
2026-03-04status Active
-
2026-01-14status Pending
-
2025-11-06price $59,000
-
2025-09-16$69,000 Active
ⓘ Source: listings_history table (triggers on properties + properties_extension) + one-shot
backfill from property_details.listing_events for pre-trigger history.
Tax reassessment forecast IN · Partial reset (capped growth)
- Current annual tax
- $118 · $10/mo
- Projected year-2 tax
- $310 · $26/mo
- Expected delta
- +$192/yr (+$16/mo · 162.2%)
ⓘ Screening estimate from a state-policy table — verify with the county assessor before closing.
Climate risk First Street
- Flood 1/10 Low FEMA zone X (unshaded) · 0% chance over 30 yrs
- Wildfire 1/10 Low
- Heat 2/10 Low 7 d/yr ≥100°F today · 16 d/yr by 30 yrs out
- Wind 2/10 Low
- Air quality 2/10 Low 2 unhealthy d/yr today · 2 by 30 yrs out
Nearby sold comps map
Loading sold comps map…
Walkable amenities ~0.75 mi
Loading nearby amenities…
Taxation est. · year 1
- Rental income
- $15,638
- − Mortgage interest
- −$3,305
- − Property taxes
- −$118
- − Insurance
- −$295
- − Repairs & maintenance
- −$1,251
- − Management
- −$1,251
- − Depreciation
- −$1,716
- Taxable income
- $7,702
- Est. tax owed @ 24.0%
- −$1,848
- After-tax cash flow
- $6,380/yr
For passive investors: Depreciation is non-cash, so a rental often shows a tax loss while cash-flowing — sheltering income. Rental losses are passive: they offset passive income freely, and up to $25,000/yr can offset ordinary (W-2) income if you actively participate and your MAGI is under $100k (phasing out to $0 by $150k); unused losses carry forward. On sale, claimed depreciation is recaptured at up to 25%, and gains may owe capital-gains tax (a 1031 exchange can defer both). Figures are a year-1 estimate at your 24.0% rate — not tax advice; consult a CPA.
Schools (NCES district)
- District
- Laporte Community School Corporation
- NCES district ID
- 1805580
- Math proficiency
- 37% ▼ -13.00%
- Reading proficiency
- 44% ▼ -11.00%
- Median HH income
- $46,761
- Composite
- 34.58/100
- National rank
- #5162
- State rank
- #139 of 301 in IN
Livability — Stillwell
No livability data for this city. (Only ~50 U.S. cities are tracked.)
Census & demographics
- Census place
- Stillwell, IN
- County
- La Porte County · 88,580 people
- Metro
- Michigan City-La Porte, IN
- Population (ZIP)
- 44,763
- Household income
- $74,307
- Rent vs Own
- Severe rent burden
- 835.0
Population outlook (LaPorte County) Hauer SSP2
- Today (2025)
- 109,757 people
- By 2030
- 108,288 · -1.3%
- By 2040
- 105,070 · -4.3%
- By 2050
- 102,330 · -6.8%
- By 2075
- 97,009 · -11.6%
- By 2100
- 86,459 · -21.2%
Race, ethnicity, and origin ACS 2023
- Neighborhood character
- Predominantly White (82%)
- Race & ethnicity
- White 82% Two or more races 8% Hispanic / Latino 8% Black 3%
- Hispanic origin (detail)
- Mexican 6%
- Common ancestry
- Romanian 11% Iranian 3% Italian 2%
- Foreign-born
- 4% · Canada
- Languages at home
- 93% English-only · Spanish 4% Russian/Polish/Slavic 1% German/W. Germanic 1%
Political lean MEDSL · LaPorte
- 2024 margin
- R (+14.1) · D 42.1% · R 56.2% · Other 1.7%
- 2008→2024 swing
- -19.1pp toward R · 2008: 5.0pp · 2024: -14.1pp
- All cycles
- 2024: R+14.1 2020: R+7.2 2016: R+6.4 2012: D+12.6 2008: D+5.0
Not yet ingested
- Civics
- —
Market trends
- HPI YoY
- ▼ -142.94%
- Current HPI
- 209.2564
- Rent YoY
- —
- Metro
- Michigan City-La Porte, IN
- State GDP YoY
- ▲ 2.90%
- F500 in state
- 18
Industry mix (Fortune 500 HQ in IN)
| Industry | F500 HQs | Revenue |
|---|---|---|
| Industrial Machinery | 2 | $37B |
|
||
| Healthcare | 1 | $177B |
|
||
| Pharmaceuticals | 1 | $45B |
|
||
| Metals / Steel | 1 | $18B |
|
||
| Agriculture | 1 | $17B |
|
||
| Packaging | 1 | $12B |
|
||
Price history
-14.5% since first listed8 events — show timeline
- 2026-05-27 Listed $59,000 NIRA MLS as Distributed by MLS Grid
- 2026-04-04 Listing Removed — NIRA MLS as Distributed by MLS Grid
- 2026-03-17 Listed $59,000 NIRA MLS as Distributed by MLS Grid
- 2026-03-17 Listing Removed — NIRA MLS as Distributed by MLS Grid
- 2026-03-04 Relisted — NIRA MLS as Distributed by MLS Grid
- 2026-01-14 Pending — NIRA MLS as Distributed by MLS Grid
- 2025-11-06 Price Changed $59,000 NIRA MLS as Distributed by MLS Grid
- 2025-09-16 Listed $69,000 NIRA MLS as Distributed by MLS Grid
Property tax history
-14.1%/yrLatest (2024): $118 · -1.1% YoY. Source: county tax records.
Cash-flow waterfall
monthlySold comps — $/sqft
last 12 mo · ≤1 miLoading sold comps…