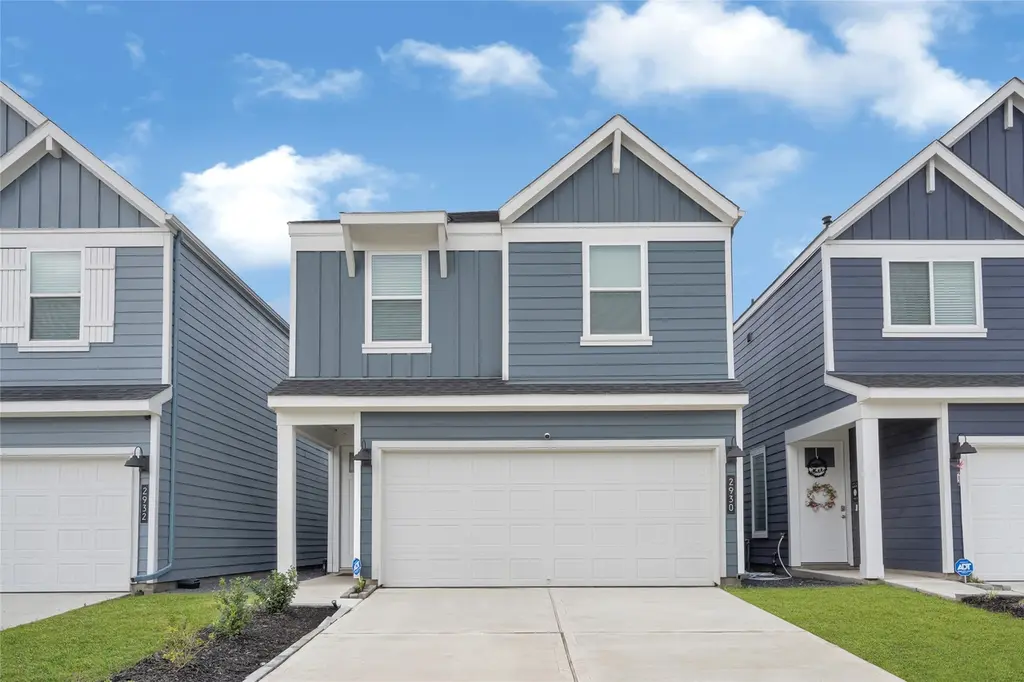
2930 Needham Garden Ln · Houston, TX
Flood risk 4/10 · Minor
- FEMA flood zone
- X (unshaded)
- Chance of flooding over 30 yrs
- 0.22%
- Est. flood insurance / yr
- $507 – $1,088
Fire risk 4/10 · Minor
- Est. fire insurance / yr
- $1,222 – $2,270
Heat risk 9/10 · Severe
- Hot days now (above 109°F)
- 6 days/yr
- Hot days in 30 yrs
- 21 days/yr
Wind risk 9/10 · Severe
- Chance of severe wind over 30 yrs
- 99.0%
Air-quality risk 2/10 · Minimal
- Unhealthy air days now
- 2 days/yr
- Unhealthy air days in 30 yrs
- 2 days/yr
Risk factors via First Street. Map © Google.
Why this score? — see what drove the D grade
The composite is a weighted blend of 9 inputs, each scored 0–100. Each bar is that input's sub-score; the figure is the points it added to the 100-point composite (weight × sub-score).
- Appreciation +10.0/10.0
- ARV discount +8.9/15.0
- Cash flow +6.8/30.0
- Rent growth +3.7/5.0
- Livability +3.7/5.0
- Schools +2.7/10.0
- Condition / age +2.5/5.0
- 1% rule +2.2/10.0
- DSCR +1.0/10.0
$329,900
🖨 Deal sheet (PDF) 📄 Offer letter ✓ Due diligence
Listing remarks
Come look at this well maintained 3 bedroom 2 bathroom home ready for immediate move in. No construction in this part so you wont have to deal with traffic. This home features granite countertops, open kitchen and living area for great entertainment. Nice size fenced backyard for pets and active children. All bedrooms upstairs for privacy along with gameroom. 2 car garage and double driveway for plenty of parking. This home will not last long. Call today for a tour.
Key facts
- Double driveway
- Gameroom
- Granite countertops
Tags
Property features AI
Finance
- Financial info: Lease considered
- HOA & community: Part of Grandwest Residential Community; Community amenities include picnic area, playground, and park; Annual association fee of $1,350; Curbs in community
Exterior
- Parking: Attached garage (2 spaces); Driveway
- Security: Security gate; Smoke detectors
- Utilities: Public water; Public sewer
- Home design: Residential property; North-facing; Built in 2024; Slab foundation
- Construction: Cement siding; Composition roof
- Exterior features: Private yard; Fence (back yard); Subdivision setting; Concrete road surface
Interior
- Kitchen: Dishwasher; Disposal; Gas oven and gas range; Microwave
- Bedrooms: Primary bedroom on second floor (approx. 17 x 15); Two additional bedrooms on second floor (each approx. 12 x 10)
- Flooring: Carpet; Vinyl
- Bathrooms: Two full bathrooms and one half bathroom
- Heating & cooling: Central heating (gas); Central electric air conditioning
- Interior features: High ceilings; Washer hookup and electric dryer hookup
- Laundry & utility: Washer hookup; Electric dryer hookup
Neighborhood map
What this means for you Summary
Snapshot
- This is a 3-bed/2.5-bath single-family listed at $330k.
Deal economics
- At list price, monthly cash flow is $-514 ($-6k/yr) — negative.
- To cash-flow at today's rent, offer at most $239k (27.5% below list).
- To meet the 1% rule (rent ≥ 1% of price), the offer needs to be $238k (27.9% below list).
- Recommended offer: $238k (27.9% below list) — sets the bar for 1% rule.
- Cap rate 4.4% vs local median 3.2% in Houston — top-decile yield for the area; either an underpriced asset or a hidden risk that comps aren't pricing in. Stress-test before assuming the spread holds.
Location & tenants
- Location reads 74/100 on livability (#184 in TX, #4,771 nationally) — a middle-class / working-renter tenant base. Strengths: amenities A+, cost of living A+, housing A+; Watch: crime F.
- Houston ISD (urban): math 27% / reading 35% proficiency, ranked #593 of 826 in TX (top 72%) — families likely to look elsewhere, expect single-tenant / working-renter base with shorter leases; 71% free/reduced lunch — lower-income household profile, screen leases tightly.
- Zoned schools: Reynolds El (math 8% / reading 8%, grade F, #4,301 of 4,322 statewide, top 100%, 334 students, 98% FRL); Attucks Middle (math 15% / reading 22%, grade F, #1,478 of 1,662 statewide, top 90%, 439 students, 98% FRL); Worthing H S (math 22% / reading 21%, grade F, #1,377 of 1,632 statewide, top 85%, 827 students, 96% FRL) — zoned schools average 97% FRL vs 71% district-wide (26 pts higher); higher-poverty schools than district average — tighter screening recommended.
- Zoned-school proficiency averages 16% at this address vs 31% district-wide (-15 pts) — the specific schools serving this property underperform the Houston ISD average; the district grade overstates school quality for this exact location.
- Market conditions: Rents rising fast (+4.8%/yr); 321 active listings in the ZIP; 12 comparable units currently listed for rent nearby; rentals at typical pace (median 20d on market — plan ~3-4 weeks tenant-placement turnaround); lower-income renter base — watch delinquency; 29,883 units permitted in Harris County in 2024 (8,621 in 5+ unit buildings).
- At $2,378/mo this rent would consume 76% of the median local household income ($37k/yr) (locally 1446% of renters already pay >50% of income on rent) — very limited rent-growth headroom before tenants either downsize or default.
Forward outlook
- In year one you build about $35k of equity ($2k loan paydown + $33k appreciation (10.0% local appreciation)).
- Harris County population projected at +47% by 2050 — long-run rental-demand tailwind backs the buy-and-hold thesis.
- By year 2, paydown + projected appreciation supports a ~$57k cash-out refi (75% LTV) — recoverable capital for the next deal without selling this one.
Negotiation context
- Only 11 days on market — expect competitive offers; lowballing is unlikely to land.
Risks & watch-outs
- Climate carrying-cost: severe wind risk, 99% chance of damaging wind over 30y; extreme-heat days projected 6→21/yr by 2055 (HVAC capex compounding) — expect insurance premiums to compound above CPI over the hold.
Questions for the listing agent
- What do current leases actually rent for vs. the listed asking? Can we see a recent rent roll and the last 12 months of T-12 income?
- What does the HOA fee cover, when was the last increase, and are there any pending special assessments or reserve-fund shortfalls?
- Is there a deadline driving the sale (1031 exchange, divorce, estate, relocation)? That informs how much negotiation room exists.
- Schools are D-rated, which usually means shorter tenancies and higher turnover. Who's the typical renter profile here, and what's been the actual vacancy rate?
- Crime grade is F in this area — have there been break-ins, vandalism, or insurance claims at this property in the last 3 years? What carrier currently insures it and at what premium?
- The area grade is low — what's the realistic commute time and amenity access for the typical tenant pool here? Any planned neighborhood developments (good or bad) we should know about?
- What's the average days-on-market for RENTAL listings here right now (not sales)? A rising rental-DOM trend means longer vacancies and softer asking-rent achievability than the comps imply.
- What's the recent tenant-quality profile in this submarket — average credit score on applications, eviction rate, late-payment / NSF rate, and stable-employment percentage? A property-management company in the area should have these aggregated.
- How much new for-sale + rental construction is in the pipeline within 1–3 miles? Heavy new supply typically softens prices + rents 12–24 months out; constrained supply supports both.
Investment metrics
- 1% rule
- 0.72% ✗
- Cap rate
- 4.42%
- Cash-on-cash
- -6.68%
- DSCR
- 0.70
- GRM
- 11.6
CMA / ARV
- ARV (on-the-fly)
- $340,388
- Comps found
- 12
Show comp detail 12 sales within ~0.75 mi
| Address | Dist | Beds/Ba | Sqft | Sold | Price | $/sf | Match |
|---|---|---|---|---|---|---|---|
| 10309 Sylvan Woods Trl | 0.20mi | 4/2.5 (+1) | 2,017 (+2%) | 3mo | $329,990 | $164 | 80 |
| 10313 Lancaster Forest Ln | 0.22mi | 4/2.5 (+1) | 2,017 (+2%) | 2mo | $329,990 | $164 | 80 |
| 2612 Afton Heights Way | 0.26mi | 4/2.5 (+1) | 2,017 (+2%) | 1mo | $345,990 | $172 | 79 |
| 10322 Largent Hollow Trl | 0.30mi | 4/2.5 (+1) | 2,046 (+3%) | 1mo | $339,990 | $166 | 75 |
| 3006 Corksie St | 0.26mi | 3/2.0 | 2,230 (+13%) | 0mo | $350,000 | $157 | 64 |
| 3106 Altus Dr | 0.57mi | 3/2.0 | 2,078 (+5%) | 1mo | $330,000 | $159 | 62 |
| 10307 Sylvan Woods Trl | 0.20mi | 4/2.5 (+1) | 1,719 (-13%) | 2mo | $319,990 | $186 | 62 |
| 2626 Afton Heights Way | 0.24mi | 4/2.5 (+1) | 1,719 (-13%) | 3mo | $319,990 | $186 | 60 |
| 2602 Afton Heights Way | 0.28mi | 4/2.5 (+1) | 1,719 (-13%) | 2mo | $316,990 | $184 | 58 |
| 2610 Afton Heights Way | 0.27mi | 4/2.5 (+1) | 1,719 (-13%) | 3mo | $319,990 | $186 | 58 |
| 10513 Chesterfield Dr | 0.57mi | 3/3.0 | 1,820 (-8%) | 4mo | $299,999 | $165 | 55 |
| 10616 Ashville Dr | 0.61mi | 3/2.5 | 1,800 (-9%) | 4mo | $325,000 | $181 | 53 |
Match score weights: distance 35% · size 25% · config 20% · recency 20%. Top-matched comps best support the ARV.
Projected returns pro-forma
10.0% appreciation · 4.77% rent growth · sell at horizon
- IRR
- 20.1%
- Equity multiple
- 2.64×
- Total profit
- $151,355
- Equity at exit
- $297,200
- IRR
- 18.7%
- Equity multiple
- 6.21×
- Total profit
- $481,060
- Equity at exit
- $640,923
Cash invested: $92,372 (down + closing). Projections, not guarantees.
Landlord ↔ Tenant lean methodology
- Overall (STATE)
- 87 Strongly Landlord-Friendly
- State Texas
- 87 Strongly Landlord-Friendly · R+5
- County
- — inherits STATE
- City
- — inherits STATE
ZIP-level market 77051
- Home prices YoY
- 9.7%
- Rents YoY
- 4.8%
- Active inventory
- 321
- Price-to-rent
- 11.6×
Monthly cashflow live
- Estimated rent
- $2,378 high interval (Pro) →
- Mortgage (P&I)
- −$1,730
- Tax from tax record
- −$412 /mo · $4,941/yr
- Insurance
- −$137
- HOA
- −$113
- Vacancy / Maint / Mgmt
- −$499
- Net cashflow
- $-514
Break-even live
Sensitivity live
| Price | -10% $-327 | -5% $-421 | +0% $-514 | +5% $-607 | +10% $-701 |
|---|---|---|---|---|---|
| Rent | -10% $-702 | -5% $-608 | +0% $-514 | +5% $-420 | +10% $-326 |
| Rate | -1.0pp $-348 | -0.5pp $-430 | base $-514 | +0.5pp $-599 | +1.0pp $-686 |
UW: 25.0% down · 7.5% · 30yr · 1.5% tax · 5.0% vac · 8.0% maint · 8.0% mgmt
Financing live
Cash to close
- Down payment
- $82,475
- Closing costs
- $9,897
- Reserves months
- —
- Total cash needed
- —
Loan-product check · same deal, 3 products live
Conventional
25% down · 7.5% · 30yr
- Down + closing
- —
- Monthly P&I
- —
- Monthly cashflow
- —
- DSCR
- —
- Eligible?
- —
Personal DTI + credit; lowest rate.
DSCR
20% down · 8.5% · 30yr
- Down + closing
- —
- Monthly P&I
- —
- Monthly cashflow
- —
- DSCR
- —
- Eligible?
- —
No personal income docs; deal must DSCR.
Hard money
10% down · 12.0% · 12mo
- Down + closing
- —
- Monthly P&I
- —
- Monthly cashflow
- —
- DSCR
- —
- Eligible?
- —
Short-term bridge; refi at stabilization.
Rent comps 12 comps
| Address | Beds | Baths | Sqft | Rent | $/sqft | DOM | Units | Dist |
|---|---|---|---|---|---|---|---|---|
| 2937 Amherst Meadow Ln Houston, TX | 3.0 | 2.5 | 1820 | $2,450 | $1.35 | 23d | 1 | 0.04mi |
| 2937 Amherst Meadow Ln Unit NA Houston, TX | 3.0 | 2.5 | 1820 | $2,400 | $1.32 | 6d | 1 | 0.04mi |
| 10514 Wellesley Terrace Trl Houston, TX | 3.0 | 3.0 | 1843 | $2,300 | $1.25 | 19d | 1 | 0.08mi |
| 10415 Lancaster Ln Houston, TX | 3.0–4.0 | 2.5 | 1937 | $2,525 | $1.30 | 22d | 1 | 0.21mi |
| 9610 Buffum St Houston, TX | 3.0 | 3.0 | 1605 | $1,799 | $1.12 | 45d | 1 | 0.62mi |
| 9606 Ashville Dr Unit B Houston, TX | 3.0 | 2.0 | 1610 | $1,570 | $0.98 | 45d | 1 | 0.76mi |
| 3710 Rockingham St Houston, TX | 3.0 | 2.0 | 1890 | $1,700 | $0.90 | 45d | 1 | 1.01mi |
| 2889 Reed Rd Houston, TX | 1.0–2.0 | 1.0–2.0 | 997 | $1,648 | $1.65 | 4d | 2 | 1.08mi |
| 12320 Chesney Downs Dr Houston, TX | 4.0 | 2.5 | 2000 | $3,500 | $1.75 | 4d | 1 | 1.11mi |
| 3002 Crown Gate Dr Unit 1568481P Houston, TX | 4.0 | 2.5 | 2195 | $3,345 | $1.52 | 1d | 1 | 1.15mi |
| 3013 Maughan Heights Trl Houston, TX | 4.0 | 2.5 | 2386 | $5,000 | $2.10 | 0d | 1 | 1.42mi |
| 11819 Leitrim Way Houston, TX | 3.0 | 1.0 | 1476 | $1,150 | $0.78 | 7d | 1 | 1.45mi |
HOA detail
- Monthly dues
- $113 · $1,356/yr
Listing history 7 events
-
2026-06-21days on market $329,900 Active 11 DOM
-
2026-06-18days on market $329,900 Active 8 DOM
-
2026-06-17days on market $329,900 Active 7 DOM
-
2026-06-16days on market $329,900 Active 6 DOM
-
2026-06-15days on market $329,900 Active 5 DOM
-
2026-06-13remarks 471-char remark
-
2026-06-13$329,900 Active 3 DOM
ⓘ Source: listings_history table (triggers on properties + properties_extension) + one-shot
backfill from property_details.listing_events for pre-trigger history.
Tax reassessment forecast TX · Resets to sale price
- Current annual tax
- $4,941 · $412/mo
- Projected year-2 tax
- $6,037 · $503/mo
- Expected delta
- +$1,096/yr (+$91/mo · 22.2%)
ⓘ Screening estimate from a state-policy table — verify with the county assessor before closing.
Climate risk First Street
- Flood 4/10 Moderate FEMA zone X (unshaded) · 22% chance over 30 yrs
- Wildfire 4/10 Moderate
- Heat 9/10 Extreme 6 d/yr ≥109°F today · 21 d/yr by 30 yrs out
- Wind 9/10 Extreme 99% chance of damaging wind over 30 yrs
- Air quality 2/10 Low 2 unhealthy d/yr today · 2 by 30 yrs out
Nearby sold comps map
Loading sold comps map…
Walkable amenities ~0.75 mi
Loading nearby amenities…
Taxation est. · year 1
- Rental income
- $28,532
- − Mortgage interest
- −$18,480
- − Property taxes
- −$4,941
- − Insurance
- −$1,650
- − Repairs & maintenance
- −$2,283
- − Management
- −$2,283
- − HOA
- −$1,356
- − Depreciation
- −$9,597
- Taxable loss
- −$12,057
- Est. tax savings @ 24.0%
- +$2,894
- After-tax cash flow
- $-3,273/yr
For passive investors: Depreciation is non-cash, so a rental often shows a tax loss while cash-flowing — sheltering income. Rental losses are passive: they offset passive income freely, and up to $25,000/yr can offset ordinary (W-2) income if you actively participate and your MAGI is under $100k (phasing out to $0 by $150k); unused losses carry forward. On sale, claimed depreciation is recaptured at up to 25%, and gains may owe capital-gains tax (a 1031 exchange can defer both). Figures are a year-1 estimate at your 24.0% rate — not tax advice; consult a CPA.
Schools (NCES district)
- District
- Houston ISD
- NCES district ID
- 4823640
- Math proficiency
- 27% ▼ -18.00%
- Reading proficiency
- 35% ▼ -6.00%
- Median HH income
- $46,054
- Composite
- 26.63/100
- National rank
- #7173
- State rank
- #593 of 826 in TX
Livability — Houston
- Score
- 74/100
- State rank
- #184
- US rank
- #4771
Category grades
Schools grade is shown separately in the Schools card above.
Census & demographics
- Census place
- Houston, TX
- County
- Harris County · 4,702,590 people
- City population
- 3,226,434
- Metro
- Houston-The Woodlands-Sugar Land, TX
- Population (ZIP)
- 19,795
- Household income
- $37,415
- Rent vs Own
- Severe rent burden
- 1446.0
Population outlook (Harris County) Hauer SSP2
- Today (2025)
- 5,571,493 people
- By 2030
- 6,089,821 · +9.3%
- By 2040
- 7,142,806 · +28.2%
- By 2050
- 8,185,864 · +46.9%
- By 2075
- 10,574,329 · +89.8%
- By 2100
- 12,109,958 · +117.4%
Race, ethnicity, and origin ACS 2023
- Neighborhood character
- Predominantly Black (77%)
- Race & ethnicity
- Black 77% Hispanic / Latino 16% Two or more races 11% White 3%
- Hispanic origin (detail)
- Mexican 6% Puerto Rican 1%
- Foreign-born
- 8% · Canada, China
- Languages at home
- 88% English-only · Spanish 10%
Political lean MEDSL · Harris
- 2024 margin
- Lean D (+5.5) · D 52.0% · R 46.4% · Other 1.6%
- 2008→2024 swing
- +3.9pp toward D · 2008: 1.6pp · 2024: 5.5pp
- All cycles
- 2024: D+5.5 2020: D+13.3 2016: D+12.4 2012: D+0.1 2008: D+1.6
Not yet ingested
- Civics
- —
Market trends
- HPI YoY
- ▲ 16.02%
- Current HPI
- 180.4283
- Rent YoY
- ▲ 4.77%
- Metro
- Houston-The Woodlands-Sugar Land, TX
- State GDP YoY
- ▲ 3.95%
- F500 in state
- 110
Industry mix (Fortune 500 HQ in TX)
| Industry | F500 HQs | Revenue |
|---|---|---|
| Energy | 16 | $1,198B |
|
||
| Technology | 5 | $198B |
|
||
| Engineering / Construction | 4 | $72B |
|
||
| Energy Services | 3 | $60B |
|
||
| Utilities | 3 | $41B |
|
||
| Healthcare | 2 | $330B |
|
||
Price history
1 event — show timeline
- 2026-06-10 Listed $329,900 HARMLS
Property tax history
+280.3%/yrLatest (2025): $4,941 · +1075.0% YoY. Source: county tax records.
Cash-flow waterfall
monthlySold comps — $/sqft
last 12 mo · ≤1 miLoading sold comps…