8325 25th St · Lubbock, TX
Flood risk No data
- FEMA flood zone
- —
- Chance of flooding over 30 yrs
- —
- Est. flood insurance / yr
- —
Fire risk No data
- Est. fire insurance / yr
- —
Heat risk No data
- Hot days now (above threshold)
- —
- Hot days in 30 yrs
- —
Wind risk No data
- Chance of severe wind over 30 yrs
- —
Air-quality risk No data
- Unhealthy air days now
- —
- Unhealthy air days in 30 yrs
- —
Risk factors via First Street. Map © Google.
Why this score? — see what drove the D grade
The composite is a weighted blend of 9 inputs, each scored 0–100. Each bar is that input's sub-score; the figure is the points it added to the 100-point composite (weight × sub-score).
- Cash flow +11.4/30.0
- ARV discount +7.5/15.0
- Condition / age +4.8/5.0
- Schools +4.4/10.0
- Livability +4.0/5.0
- DSCR +3.4/10.0
- 1% rule +3.3/10.0
- Rent growth +2.5/5.0
- Appreciation +0.0/10.0
$208,530
🖨 Deal sheet (PDF) 📄 Offer letter ✓ Due diligence
Listing remarks
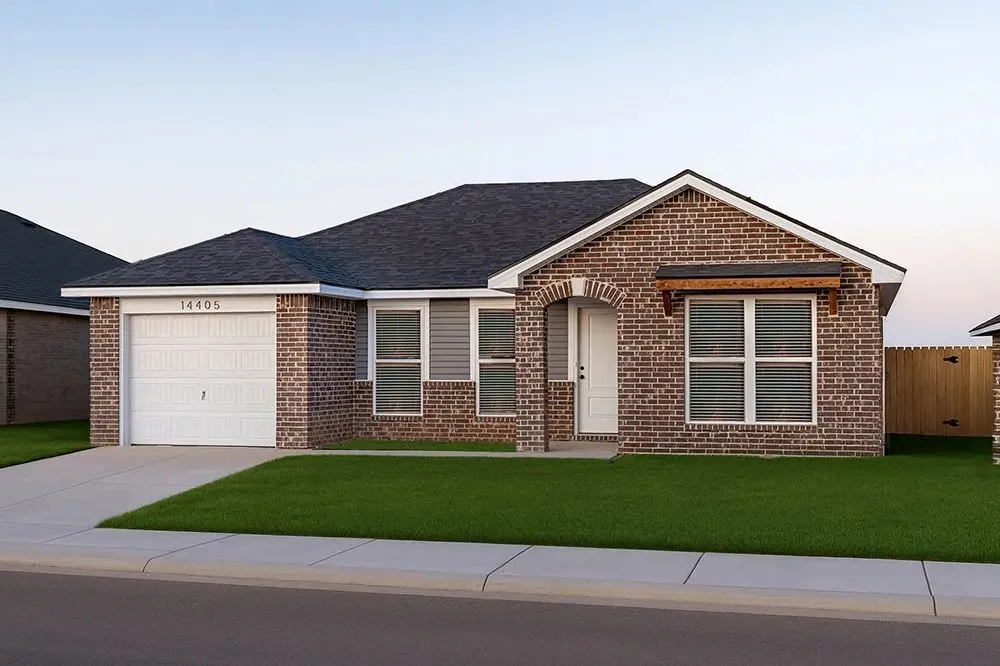
The 1,200 square-foot Briley floor plan is a smart, functional layout with open living and storage where it counts. Brick and vinyl exterior with covered entryLuxury vinyl plank flooring in main areasOpen-concept kitchen and living areaGranite or quartz countertopsKitchen island with bar seatingStainless steel appliancesEnclosed pantryPrivate primary suite with walk-in closet
Key facts
- Briley floor plan
- Open-concept kitchen
- Open living
Tags
Property features AI
Finance
- Other: Living area approximately 1200; Address: 8325 25th St, Lubbock TX 79407; Status: Active; List price: $208,530; Last modified: 2026-05-22
Exterior
- Parking: 1 parking space (total)
- Utilities: Has heating; Has cooling
- Home design: Spec home, Plan: Briley
Interior
- Kitchen: Dishwasher; Disposal; Microwave
- Bedrooms: 3 bedrooms
- Bathrooms: 2 full bathrooms
- Heating & cooling: Forced air heating; Central air conditioning
- Interior features: Dishwasher; Disposal; Microwave; Ceiling fan(s)
Neighborhood map
What this means for you Summary
Snapshot
- This is a 3-bed/2.0-bath single-family listed at $209k. Condition is rated excellent.
Deal economics
- At list price, monthly cash flow is $-71 ($-851/yr) — negative.
- To cash-flow at today's rent, offer at most $198k (4.9% below list).
- To meet the 1% rule (rent ≥ 1% of price), the offer needs to be $173k (16.8% below list).
- Recommended offer: $173k (16.8% below list) — sets the bar for 1% rule.
Location & tenants
- Location reads 80/100 on livability (#37 in TX, #1,749 nationally) — a professional / high-income tenant draw. Strengths: commute A+, cost of living A+, housing A+; Watch: employment C-, crime F.
- Frenship ISD (urban): math 47% / reading 54% proficiency, ranked #162 of 826 in TX (top 20%) — acceptable for families but not a draw, mixed tenant base, ~2y average lease.
- Zoned schools: Willow Bend El (math 34% / reading 41%, grade F, #1,744 of 4,322 statewide, top 41%, 730 students, 74% FRL); Terra Vista Middle (math 37% / reading 44%, grade F, #637 of 1,662 statewide, top 39%, 891 students, 66% FRL); Frenship H S (math 44% / reading 65%, grade C-, #379 of 1,632 statewide, top 26%, 3,247 students, 46% FRL) — zoned schools average 62% FRL vs 36% district-wide (25 pts higher); higher-poverty schools than district average — tighter screening recommended.
- Market conditions: Rents soft (-0.1%/yr); 613 active listings in the ZIP; 37 comparable units currently listed for rent nearby; rentals at typical pace (median 23d on market — plan ~3-4 weeks tenant-placement turnaround); 41% of comp listings sitting > 30 days — soft ceiling on asking rent; 2,219 units permitted in Lubbock County in 2024 (252 in 5+ unit buildings).
- This rent runs 34% of the median local income ($62k/yr) — at the standard rent-burdened threshold; future hikes will face affordability resistance.
Forward outlook
- Local home prices are declining (-3.0%/yr); year-one equity from $1k of loan paydown is wiped out by about $6k of value loss. Plan a longer hold.
- Lubbock County population projected at +39% by 2050 — long-run rental-demand tailwind backs the buy-and-hold thesis.
Negotiation context
- It's been on market 34 days — a 3% lower offer ($202k) is reasonable based on typical stale-listing flexibility.
Questions for the listing agent
- What do current leases actually rent for vs. the listed asking? Can we see a recent rent roll and the last 12 months of T-12 income?
- It's been on market 34 days. Have you received any prior offers? Is the seller open to a 17% concession, seller financing, or rate buy-down credit?
- Is there a deadline driving the sale (1031 exchange, divorce, estate, relocation)? That informs how much negotiation room exists.
- Schools are D-rated, which usually means shorter tenancies and higher turnover. Who's the typical renter profile here, and what's been the actual vacancy rate?
- Crime grade is F in this area — have there been break-ins, vandalism, or insurance claims at this property in the last 3 years? What carrier currently insures it and at what premium?
- The area grade is low — what's the realistic commute time and amenity access for the typical tenant pool here? Any planned neighborhood developments (good or bad) we should know about?
- What's the average days-on-market for RENTAL listings here right now (not sales)? A rising rental-DOM trend means longer vacancies and softer asking-rent achievability than the comps imply.
- What's the recent tenant-quality profile in this submarket — average credit score on applications, eviction rate, late-payment / NSF rate, and stable-employment percentage? A property-management company in the area should have these aggregated.
- How much new for-sale + rental construction is in the pipeline within 1–3 miles? Heavy new supply typically softens prices + rents 12–24 months out; constrained supply supports both.
Investment metrics
- 1% rule
- 0.83% ✗
- Cap rate
- 5.88%
- Cash-on-cash
- -1.46%
- DSCR
- 0.94
- GRM
- 10.0
CMA / ARV
No comps found within radius.
Projected returns pro-forma
-3.0% appreciation · 0.0% rent growth · sell at horizon
- IRR
- -22.1%
- Equity multiple
- 0.26×
- Total profit
- $-43,364
- Equity at exit
- $31,093
- IRR
- -25.9%
- Equity multiple
- -0.08×
- Total profit
- $-63,114
- Equity at exit
- $18,030
Cash invested: $58,388 (down + closing). Projections, not guarantees.
Landlord ↔ Tenant lean methodology
- Overall (STATE)
- 87 Strongly Landlord-Friendly
- State Texas
- 87 Strongly Landlord-Friendly · R+5
- County
- — inherits STATE
- City
- — inherits STATE
ZIP-level market 79407
- Home prices YoY
- -16.3%
- Rents YoY
- -0.1%
- Active inventory
- 613
- Price-to-rent
- 10.0×
Monthly cashflow live
- Estimated rent
- $1,734 high interval (Pro) →
- Mortgage (P&I)
- −$1,094
- Tax est. 1.5%
- −$261 /mo · $3,128/yr
- Insurance
- −$87
- HOA
- −$0
- Vacancy / Maint / Mgmt
- −$364
- Net cashflow
- $-71
Break-even live
Sensitivity live
| Price | -10% $73 | -5% $1 | +0% $-71 | +5% $-143 | +10% $-215 |
|---|---|---|---|---|---|
| Rent | -10% $-208 | -5% $-139 | +0% $-71 | +5% $-2 | +10% $66 |
| Rate | -1.0pp $34 | -0.5pp $-18 | base $-71 | +0.5pp $-125 | +1.0pp $-180 |
UW: 25.0% down · 7.5% · 30yr · 1.5% tax · 5.0% vac · 8.0% maint · 8.0% mgmt
Financing live
Cash to close
- Down payment
- $52,132
- Closing costs
- $6,256
- Reserves months
- —
- Total cash needed
- —
Loan-product check · same deal, 3 products live
Conventional
25% down · 7.5% · 30yr
- Down + closing
- —
- Monthly P&I
- —
- Monthly cashflow
- —
- DSCR
- —
- Eligible?
- —
Personal DTI + credit; lowest rate.
DSCR
20% down · 8.5% · 30yr
- Down + closing
- —
- Monthly P&I
- —
- Monthly cashflow
- —
- DSCR
- —
- Eligible?
- —
No personal income docs; deal must DSCR.
Hard money
10% down · 12.0% · 12mo
- Down + closing
- —
- Monthly P&I
- —
- Monthly cashflow
- —
- DSCR
- —
- Eligible?
- —
Short-term bridge; refi at stabilization.
Rent comps 37 comps
| Address | Beds | Baths | Sqft | Rent | $/sqft | DOM | Units | Dist |
|---|---|---|---|---|---|---|---|---|
| 2603 Harmony Ave Lubbock, TX | 3.0 | 2.0 | 1450 | $1,749 | $1.21 | 22d | 1 | 0.20mi |
| 2603 Harmony Ave Lubbock, TX | 3.0 | 2.0 | 1450 | $1,749 | $1.21 | 15d | 1 | 0.20mi |
| 8607 29th St Lubbock, TX | 3.0 | 2.0 | 1350 | $1,749 | $1.30 | 45d | 1 | 0.22mi |
| 2511 Kenwood Ave Lubbock, TX | 3.0 | 2.0 | 1450 | $2,099 | $1.45 | 22d | 1 | 0.62mi |
| 2509 Kenwood Ave Lubbock, TX | 3.0 | 2.0 | 1450 | $1,699 | $1.17 | 22d | 1 | 0.62mi |
| 2055 Kenwood Ave Lubbock, TX | 3.0 | 2.0 | 1450 | $1,649 | $1.14 | 15d | 1 | 0.64mi |
| 2154 Kokomo Ave Lubbock, TX | 3.0 | 2.0 | 1450 | $1,799 | $1.24 | 22d | 1 | 0.67mi |
| 2168 Langford Ave Lubbock, TX | 3.0 | 2.0 | 1450 | $1,699 | $1.17 | 45d | 1 | 0.69mi |
| 2028 Kenwood Ave Lubbock, TX | 3.0 | 2.0 | 1450 | $1,650 | $1.14 | 15d | 1 | 0.71mi |
| 2125 Kirksey Ave Lubbock, TX | 3.0 | 2.0 | 1450 | $1,650 | $1.14 | 15d | 1 | 0.72mi |
| 2162 Langford Ave Lubbock, TX | 3.0 | 2.0 | 1450 | $1,699 | $1.17 | 45d | 1 | 0.72mi |
| 2147 Langford Ave Lubbock, TX | 3.0 | 2.0 | 1450 | $1,699 | $1.17 | 22d | 1 | 0.74mi |
| 2131 Kokomo Ave Unit A Lubbock, TX | 3.0 | 2.0 | 1360 | $1,500 | $1.10 | 22d | 1 | 0.75mi |
| 2140 Kokomo Ave Lubbock, TX | 4.0 | 2.0 | 1450 | $1,999 | $1.38 | 45d | 1 | 0.75mi |
| 2143 Langford Ave Lubbock, TX | 3.0 | 2.0 | 1450 | $1,750 | $1.21 | 45d | 1 | 0.76mi |
| 2152 Langford Ave Unit Labs Lubbock, TX | 3.0 | 2.0 | 1450 | $1,660 | $1.14 | 22d | 1 | 0.77mi |
| 2139 Langford Ave Lubbock, TX | 3.0 | 2.0 | 1450 | $1,899 | $1.31 | 22d | 1 | 0.78mi |
| 2130 Kokomo Ave Lubbock, TX | 4.0 | 2.0 | 1450 | $2,199 | $1.52 | 22d | 1 | 0.78mi |
| 2137 Langford Ave Lubbock, TX | 3.0 | 2.0 | 1450 | $1,700 | $1.17 | 22d | 1 | 0.79mi |
| 2148 Langford Ave Lubbock, TX | 3.0 | 2.0 | 1450 | $1,699 | $1.17 | 45d | 1 | 0.79mi |
| 2123 Langford Ave Lubbock, TX | 3.0 | 2.0 | 1450 | $1,799 | $1.24 | 22d | 1 | 0.81mi |
| 2138 Langford Ave Lubbock, TX | 3.0 | 2.0 | 1450 | $1,699 | $1.17 | 45d | 1 | 0.82mi |
| 2132 Langford Ave Lubbock, TX | 3.0 | 2.0 | 1450 | $1,699 | $1.17 | 15d | 1 | 0.83mi |
| 2128 Langford Ave Lubbock, TX | 3.0 | 2.0 | 1450 | $1,699 | $1.17 | 15d | 1 | 0.84mi |
| 2122 Langford Ave Lubbock, TX | 3.0 | 2.0 | 1450 | $1,699 | $1.17 | 15d | 1 | 0.85mi |
| 2101 Langford Ave Lubbock, TX | 3.0 | 2.0 | 1500 | $1,400 | $0.93 | 45d | 1 | 0.86mi |
| 1919 Langford Ave Unit A Lubbock, TX | 3.0 | 2.0 | 1500 | $1,399 | $0.93 | 45d | 1 | 0.88mi |
| 1919 Langford Ave Lubbock, TX | 3.0 | 2.0 | 1500 | $1,350 | $0.90 | 45d | 1 | 0.88mi |
| 1918 Langford Ave Unit B Lubbock, TX | 3.0 | 2.0 | 1500 | $1,399 | $0.93 | 15d | 1 | 0.91mi |
| 1903 Langford Ave Unit A Lubbock, TX | 3.0 | 2.0 | 1500 | $1,575 | $1.05 | 45d | 1 | 0.92mi |
| 1903 Langford Ave Unit A Lubbock, TX | 3.0 | 2.0 | 1500 | $1,575 | $1.05 | 15d | 1 | 0.92mi |
| 1903 Langford Ave Unit B Lubbock, TX | 3.0 | 2.0 | 1500 | $1,300 | $0.87 | 45d | 1 | 0.93mi |
| 7541 33rd St Lubbock, TX | 3.0 | 2.0 | 1296 | $1,500 | $1.16 | 22d | 1 | 1.05mi |
| 7535 32nd St Lubbock, TX | 3.0 | 2.0 | 1120 | $1,395 | $1.25 | 45d | 1 | 1.05mi |
| 8704 10th St Lubbock, TX | 3.0 | 2.0 | 1423 | $1,450 | $1.02 | 45d | 1 | 1.23mi |
| 7420 35th St Lubbock, TX | 3.0 | 2.0 | 1247 | $1,500 | $1.20 | 45d | 1 | 1.42mi |
| 7413 35th St Lubbock, TX | 3.0 | 2.0 | 1247 | $1,475 | $1.18 | 22d | 1 | 1.47mi |
Listing history 16 events
-
2026-06-22days on market $208,530 Active 34 DOM
-
2026-06-18days on market $208,530 Active 31 DOM
-
2026-06-17days on market $208,530 Active 30 DOM
-
2026-06-16days on market $208,530 Active 29 DOM
-
2026-06-15days on market $208,530 Active 28 DOM
-
2026-06-13days on market $208,530 Active 25 DOM
-
2026-06-10days on market $208,530 Active 23 DOM
-
2026-06-09days on market $208,530 Active 22 DOM
-
2026-06-08days on market $208,530 Active 21 DOM
-
2026-06-07days on market $208,530 Active 20 DOM
-
2026-06-05days on market $208,530 Active 17 DOM
-
2026-06-03days on market $208,530 Active 16 DOM
-
2026-06-02days on market $208,530 Active 15 DOM
-
2026-06-01days on market $208,530 Active 14 DOM
-
2026-05-31days on market $208,530 Active 13 DOM
-
2026-05-30days on market $208,530 Active 12 DOM
ⓘ Source: listings_history table (triggers on properties + properties_extension) + one-shot
backfill from property_details.listing_events for pre-trigger history.
Nearby sold comps map
Loading sold comps map…
Walkable amenities ~0.75 mi
Loading nearby amenities…
Taxation est. · year 1
- Rental income
- $20,813
- − Mortgage interest
- −$11,681
- − Property taxes
- −$3,128
- − Insurance
- −$1,043
- − Repairs & maintenance
- −$1,665
- − Management
- −$1,665
- − Depreciation
- −$6,066
- Taxable loss
- −$4,435
- Est. tax savings @ 24.0%
- +$1,064
- After-tax cash flow
- $213/yr
For passive investors: Depreciation is non-cash, so a rental often shows a tax loss while cash-flowing — sheltering income. Rental losses are passive: they offset passive income freely, and up to $25,000/yr can offset ordinary (W-2) income if you actively participate and your MAGI is under $100k (phasing out to $0 by $150k); unused losses carry forward. On sale, claimed depreciation is recaptured at up to 25%, and gains may owe capital-gains tax (a 1031 exchange can defer both). Figures are a year-1 estimate at your 24.0% rate — not tax advice; consult a CPA.
Condition & rehab AI · 17 photos
This home is in excellent condition with a smart, functional layout. It is move-in ready and would benefit from minor exterior updates to enhance curb appeal.
Value-add opportunities
- Resale Painting exterior brick — Enhances curb appeal
- Resale Replace light fixtures — Modernizes the space
- Both Install smart home devices — Improves convenience and energy efficiency
Renovation cost estimate screening
Value-add ROI direction
- Resale Painting exterior brick — Enhances curb appeal ↑
- Resale Replace light fixtures — Modernizes the space ↑
- Both Install smart home devices — Improves convenience and energy efficiency ↑
ⓘ Cost ranges are severity-bucket heuristics (US national rule-of-thumb). Get contractor quotes + a written scope before underwriting a rehab budget.
Schools (NCES district)
- District
- Frenship ISD
- NCES district ID
- 4819830
- Math proficiency
- 47% ▼ -8.00%
- Reading proficiency
- 54% ▬ 0.00%
- Median HH income
- $54,376
- Composite
- 43.59/100
- National rank
- #2976
- State rank
- #162 of 826 in TX
Livability — Lubbock
- Score
- 80/100
- State rank
- #37
- US rank
- #1749
Category grades
Schools grade is shown separately in the Schools card above.
Census & demographics
- Census place
- Lubbock, TX
- County
- Lubbock County · 293,542 people
- City population
- 283,030
- Metro
- Lubbock, TX
- Population (ZIP)
- 24,000
- Household income
- $61,509
- Rent vs Own
- Severe rent burden
- 1914.0
Population outlook (Lubbock County) Hauer SSP2
- Today (2025)
- 345,960 people
- By 2030
- 371,449 · +7.4%
- By 2040
- 424,539 · +22.7%
- By 2050
- 481,150 · +39.1%
- By 2075
- 633,467 · +83.1%
- By 2100
- 746,853 · +115.9%
Race, ethnicity, and origin ACS 2023
- Neighborhood character
- Diverse neighborhood (Simpson 0.56)
- Race & ethnicity
- White 58% Hispanic / Latino 31% Two or more races 17% Black 4% Asian 3%
- Hispanic origin (detail)
- Mexican 27%
- Common ancestry
- Italian 2% Lithuanian 1% Slovak 1%
- Foreign-born
- 5% · Canada, South Korea, China
- Languages at home
- 83% English-only · Spanish 13% Other Asian/Pacific 1% Chinese 1%
Political lean MEDSL · Lubbock
- 2024 margin
- Solid R (+39.5) · D 29.7% · R 69.2% · Other 1.0%
- 2008→2024 swing
- -2.8pp toward R · 2008: -36.7pp · 2024: -39.5pp
- All cycles
- 2024: R+39.5 2020: R+32.2 2016: R+38.4 2012: R+40.9 2008: R+36.7
Not yet ingested
- Civics
- —
Market trends
- HPI YoY
- ▼ -44.87%
- Current HPI
- 229.9895
- Rent YoY
- ▼ -0.07%
- Metro
- Lubbock, TX
- State GDP YoY
- ▲ 3.95%
- F500 in state
- 110
Industry mix (Fortune 500 HQ in TX)
| Industry | F500 HQs | Revenue |
|---|---|---|
| Energy | 16 | $1,198B |
|
||
| Technology | 5 | $198B |
|
||
| Engineering / Construction | 4 | $72B |
|
||
| Energy Services | 3 | $60B |
|
||
| Utilities | 3 | $41B |
|
||
| Healthcare | 2 | $330B |
|
||
Cash-flow waterfall
monthlySold comps — $/sqft
last 12 mo · ≤1 miLoading sold comps…