76 Roosevelt Ave · Benwood, WV
Flood risk No data
- FEMA flood zone
- —
- Chance of flooding over 30 yrs
- —
- Est. flood insurance / yr
- —
Fire risk No data
- Est. fire insurance / yr
- —
Heat risk No data
- Hot days now (above threshold)
- —
- Hot days in 30 yrs
- —
Wind risk No data
- Chance of severe wind over 30 yrs
- —
Air-quality risk No data
- Unhealthy air days now
- —
- Unhealthy air days in 30 yrs
- —
Risk factors via First Street. Map © Google.
Why this score? — see what drove the B grade
The composite is a weighted blend of 9 inputs, each scored 0–100. Each bar is that input's sub-score; the figure is the points it added to the 100-point composite (weight × sub-score).
- Cash flow +30.0/30.0
- 1% rule +10.0/10.0
- DSCR +10.0/10.0
- ARV discount +7.5/15.0
- Appreciation +6.9/10.0
- Livability +3.2/5.0
- Schools +2.7/10.0
- Rent growth +2.5/5.0
- Condition / age +1.0/5.0
$55,000
🖨 Deal sheet 📄 Offer letter ✓ Due diligence
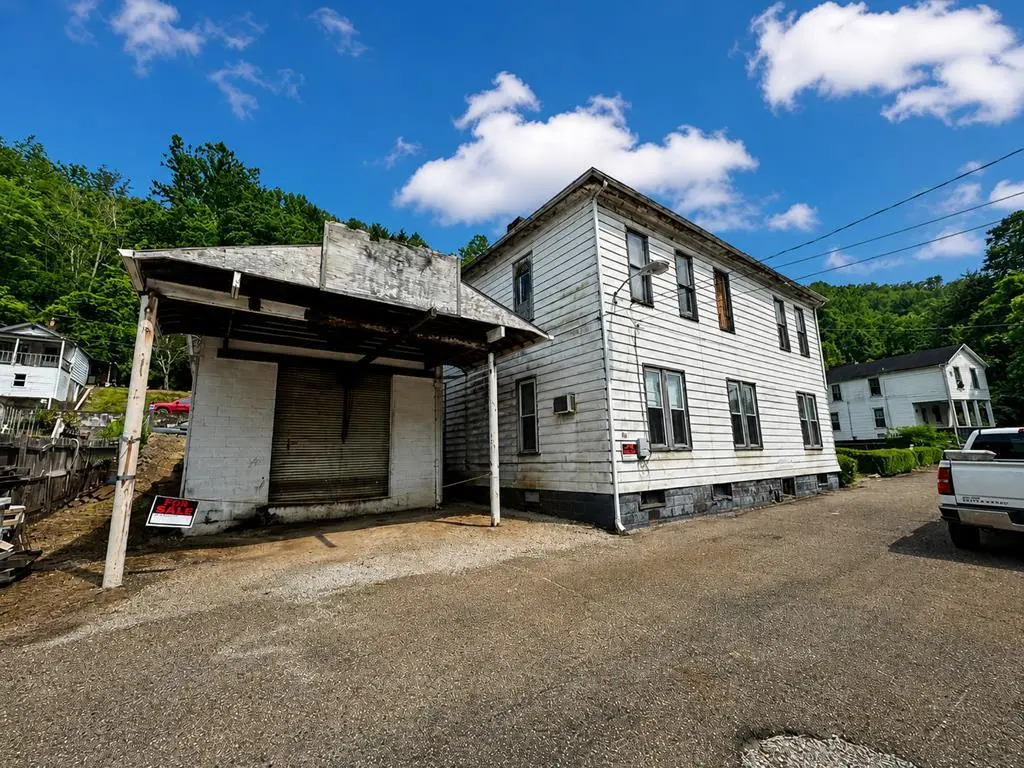
Listing remarks
Great opportunity to own a commercially zoned mixed-use warehouse (previously a machine shop) & in Benwood just off Route 2. Property consists of a residential home (used as an office space, no kitchen) and large commercial shop. Most recently operated as a machine shop. Shop features large door/loading dock area and multiple large work/storage spaces. High ceilings, shop heaters, 3-phase 440V power on site, and much more. Residential structure could be a 3+ bedroom home or could be torn down to accommodate additional parking. Bring your imagination and make this property into your next home or business location! Contact any agent today to schedule your private showing.
Key facts
- 7,405 sq ft lot
- 4 garage spots
- Built 1950
Property features AI
Exterior
- Parking: Attached concrete garage with 4 spaces
- Utilities: Public water; Public sewer
- Home design: Single-family residential (Traditional); 2 stories
- Construction: Wood siding construction
- Exterior features: Shingle roof; Level lot; Outbuilding
Interior
- Flooring: Hardwood flooring
- Bathrooms: 1 full bathroom
- Heating & cooling: Natural gas heating
- Interior features: Gas water heater; Full basement; Total of 10 rooms
Neighborhood map
What this means for you Summary
Snapshot
- This is a 2-bed/1.0-bath single-family listed at $55k. Condition is rated poor.
Deal economics
- At list price, monthly cash flow is $446 ($5k/yr) — positive.
- The deal already cash-flows at list — no discount required.
- Meets the 1% rule at list price ($1k rent vs $55k).
- Recommended offer: $53k (3.0% below list) — sets the bar for market timing.
Location & tenants
- Location reads 64/100 on livability (#145 in WV) — a middle-class / working-renter tenant base. Strengths: crime A+, cost of living A+, housing A+; Watch: schools F, amenities F, commute F.
- Marshall County Schools (suburban): math 28% / reading 36% proficiency, ranked #21 of 55 in WV (top 38%) — families likely to look elsewhere, expect single-tenant / working-renter base with shorter leases.
- Market conditions: 16 active listings in the ZIP; 6 units permitted in Marshall County in 2024 (0 in 5+ unit buildings).
Forward outlook
- In year one you build about $2k of equity ($380 loan paydown + $2k appreciation (3.8% local appreciation)).
- Marshall County population projected at -19% by 2050 — secular population decline; favor cash flow + early exit over multi-decade hold.
- At projected returns (3.8% appreciation + 3.0% rent growth), your $15k cash investment doubles in ~2 years — after that, you're playing with house money.
Negotiation context
- It's been on market 45 days — a 3% lower offer ($53k) is reasonable based on typical stale-listing flexibility.
Risks & watch-outs
- Watch-outs: built in 1950 — expect roof / HVAC / electrical / plumbing capex.
Questions for the listing agent
- It's been on market 45 days. Have you received any prior offers? Is the seller open to a 3% concession, seller financing, or rate buy-down credit?
- Have any recent inspections been done? Can we get a copy of the seller's disclosures and any deferred-maintenance estimates?
- Built in 1950 — when were the roof, HVAC, electrical panel, plumbing, and water heater last replaced?
- Is there a deadline driving the sale (1031 exchange, divorce, estate, relocation)? That informs how much negotiation room exists.
- Schools are F-rated, which usually means shorter tenancies and higher turnover. Who's the typical renter profile here, and what's been the actual vacancy rate?
- What's the average days-on-market for RENTAL listings here right now (not sales)? A rising rental-DOM trend means longer vacancies and softer asking-rent achievability than the comps imply.
- What's the recent tenant-quality profile in this submarket — average credit score on applications, eviction rate, late-payment / NSF rate, and stable-employment percentage? A property-management company in the area should have these aggregated.
- How much new for-sale + rental construction is in the pipeline within 1–3 miles? Heavy new supply typically softens prices + rents 12–24 months out; constrained supply supports both.
Investment metrics
- 1% rule
- 1.90% ✓
- Cap rate
- 16.03%
- Cash-on-cash
- 34.76%
- DSCR
- 2.55
- GRM
- 4.4
CMA / ARV
- ARV (on-the-fly)
- $147,500
- Comps found
- 1
Show comp detail 1 sale within ~0.75 mi
| Address | Dist | Beds/Ba | Sqft | Sold | Price | $/sf | Match |
|---|---|---|---|---|---|---|---|
| 4833 Eoff St | 0.58mi | 3/2.0 (+1) | 2,448 (-2%) | 18mo | $145,000 | $59 | 45 |
Match score weights: distance 35% · size 25% · config 20% · recency 20%. Top-matched comps best support the ARV.
Projected returns pro-forma
3.8% appreciation · 3.0% rent growth · sell at horizon
- IRR
- 41.7%
- Equity multiple
- 3.43×
- Total profit
- $37,415
- Equity at exit
- $27,242
- IRR
- 40.8%
- Equity multiple
- 6.88×
- Total profit
- $90,581
- Equity at exit
- $44,050
Cash invested: $15,400 (down + closing). Projections, not guarantees.
Landlord ↔ Tenant lean methodology
- Overall (STATE)
- 83 Strongly Landlord-Friendly
- State West Virginia
- 83 Strongly Landlord-Friendly · R+22
- County
- — inherits STATE
- City
- — inherits STATE
ZIP-level market 26031
- Home prices YoY
- 2.6%
- Active inventory
- 16
- Price-to-rent
- 4.4×
Monthly cashflow live
- Estimated rent
- $1,046 medium interval (Pro) →
- Mortgage (P&I)
- −$288
- Tax est. 1.5%
- −$69 /mo · $825/yr
- Insurance
- −$23
- HOA
- −$0
- Vacancy / Maint / Mgmt
- −$220
- Net cashflow
- $446
Break-even live
UW: 25.0% down · 7.5% · 30yr · 1.5% tax · 5.0% vac · 8.0% maint · 8.0% mgmt
Financing live
Cash to close
- Down payment
- $13,750
- Closing costs
- $1,650
- Reserves months
- —
- Total cash needed
- —
Loan-product check · same deal, 3 products live
Conventional
25% down · 7.5% · 30yr
- Down + closing
- —
- Monthly P&I
- —
- Monthly cashflow
- —
- DSCR
- —
- Eligible?
- —
Personal DTI + credit; lowest rate.
DSCR
20% down · 8.5% · 30yr
- Down + closing
- —
- Monthly P&I
- —
- Monthly cashflow
- —
- DSCR
- —
- Eligible?
- —
No personal income docs; deal must DSCR.
Hard money
10% down · 12.0% · 12mo
- Down + closing
- —
- Monthly P&I
- —
- Monthly cashflow
- —
- DSCR
- —
- Eligible?
- —
Short-term bridge; refi at stabilization.
Listing history 17 events
-
2026-06-19days on market $55,000 Active 45 DOM
-
2026-06-18days on market $55,000 Active 44 DOM
-
2026-06-17days on market $55,000 Active 43 DOM
-
2026-06-16days on market $55,000 Active 42 DOM
-
2026-06-15days on market $55,000 Active 41 DOM
-
2026-06-14days on market $55,000 Active 39 DOM
-
2026-06-12days on market $55,000 Active 38 DOM
-
2026-06-09days on market $55,000 Active 35 DOM
-
2026-06-08days on market $55,000 Active 34 DOM
-
2026-06-07days on market $55,000 Active 33 DOM
-
2026-06-02days on market $55,000 Active 28 DOM
-
2026-06-01days on market $55,000 Active 27 DOM
-
2026-05-31days on market $55,000 Active 26 DOM
-
2026-05-30days on market $55,000 Active 25 DOM
-
2026-05-05$55,000 Active
-
2024-12-03price $79,900
-
2024-08-27price $89,000
ⓘ Source: listings_history table (triggers on properties + properties_extension) + one-shot
backfill from property_details.listing_events for pre-trigger history.
Nearby sold comps map
Loading sold comps map…
Walkable amenities ~0.75 mi
Loading nearby amenities…
Taxation est. · year 1
- Rental income
- $12,550
- − Mortgage interest
- −$3,081
- − Property taxes
- −$825
- − Insurance
- −$275
- − Repairs & maintenance
- −$1,004
- − Management
- −$1,004
- − Depreciation
- −$1,600
- Taxable income
- $4,761
- Est. tax owed @ 24.0%
- −$1,143
- After-tax cash flow
- $4,211/yr
For passive investors: Depreciation is non-cash, so a rental often shows a tax loss while cash-flowing — sheltering income. Rental losses are passive: they offset passive income freely, and up to $25,000/yr can offset ordinary (W-2) income if you actively participate and your MAGI is under $100k (phasing out to $0 by $150k); unused losses carry forward. On sale, claimed depreciation is recaptured at up to 25%, and gains may owe capital-gains tax (a 1031 exchange can defer both). Figures are a year-1 estimate at your 24.0% rate — not tax advice; consult a CPA.
Condition & rehab AI · 12 photos
This property requires extensive repairs and renovations to bring it up to a livable condition. Significant investment is needed to address the structural issues, exterior damage, and interior improvements.
Repairs flagged
- Major roof — Severe weathering and damage
- Major exterior siding — Peeling and damaged
- Major flooring — Cracked and worn
- Major interior walls — Bare and unfinished
- Major windows — Old and some broken
- Major foundation — Visible cracks and unstable
- Major HVAC system — No system visible
Value-add opportunities
- Resale Paint exterior siding — Enhances curb appeal and property value
- Resale Replace flooring — Improves living space and adds value
- Resale Repair windows — Enhances property value and safety
- Resale Stabilize foundation — Ensures structural integrity and adds value
Renovation cost estimate screening
| Repair item | Severity | Est. cost |
|---|---|---|
| roof · Severe weathering and damage | Major | $15,000–50,000 |
| exterior siding · Peeling and damaged | Major | $15,000–50,000 |
| flooring · Cracked and worn | Major | $15,000–50,000 |
| interior walls · Bare and unfinished | Major | $15,000–50,000 |
| windows · Old and some broken | Major | $15,000–50,000 |
| foundation · Visible cracks and unstable | Major | $15,000–50,000 |
| HVAC system · No system visible | Major | $15,000–50,000 |
| Total estimated repair cost · 7 items | $105,000–350,000 |
Value-add ROI direction
- Resale Paint exterior siding — Enhances curb appeal and property value ↑
- Resale Replace flooring — Improves living space and adds value ↑
- Resale Repair windows — Enhances property value and safety ↑
- Resale Stabilize foundation — Ensures structural integrity and adds value ↑
ⓘ Cost ranges are severity-bucket heuristics (US national rule-of-thumb). Get contractor quotes + a written scope before underwriting a rehab budget.
Schools (NCES district)
- District
- Marshall County Schools
- NCES district ID
- 5400750
- Math proficiency
- 28% ▼ -6.00%
- Reading proficiency
- 36% ▼ -4.00%
- Median HH income
- $40,289
- Composite
- 26.91/100
- National rank
- #7086
- State rank
- #21 of 55 in WV
Livability — Benwood
- Score
- 64/100
- State rank
- #145
- US rank
- #14454
Category grades
Schools grade is shown separately in the Schools card above.
Census & demographics
- Census place
- Benwood, WV
- Population (ZIP)
- 1,556
Population outlook (Marshall County) Hauer SSP2
- Today (2025)
- 30,387 people
- By 2030
- 29,242 · -3.8%
- By 2040
- 26,806 · -11.8%
- By 2050
- 24,627 · -19.0%
- By 2075
- 19,846 · -34.7%
- By 2100
- 15,169 · -50.1%
Race, ethnicity, and origin ACS 2023
- Neighborhood character
- Predominantly White (91%)
- Race & ethnicity
- White 91% Two or more races 7%
- Common ancestry
- Romanian 11% Iranian 3% Subsaharan African 2%
- Foreign-born
- 1% · Canada
- Languages at home
- 98% English-only · German/W. Germanic 1% Spanish 1%
Political lean MEDSL · Marshall
- 2024 margin
- Solid R (+50.0) · D 24.1% · R 74.1% · Other 1.8%
- 2008→2024 swing
- -37.5pp toward R · 2008: -12.6pp · 2024: -50.0pp
- All cycles
- 2024: R+50.0 2020: R+49.6 2016: R+51.0 2012: R+28.6 2008: R+12.6
Not yet ingested
- Civics
- —
Market trends
- HPI YoY
- ▲ 3.80%
- Current HPI
- 150.8599
- Rent YoY
- —
- Metro
- —
- State GDP YoY
- —
- F500 in state
- 0
Price history
-38.2% since first listed3 events — show timeline
- 2026-05-05 Listed $55,000 WBOR
- 2024-12-03 Price Changed $79,900 WBOR
- 2024-08-27 Price Changed $89,000 WBOR
Cash-flow waterfall
monthlySold comps — $/sqft
last 12 mo · ≤1 miLoading sold comps…