 Multi-family
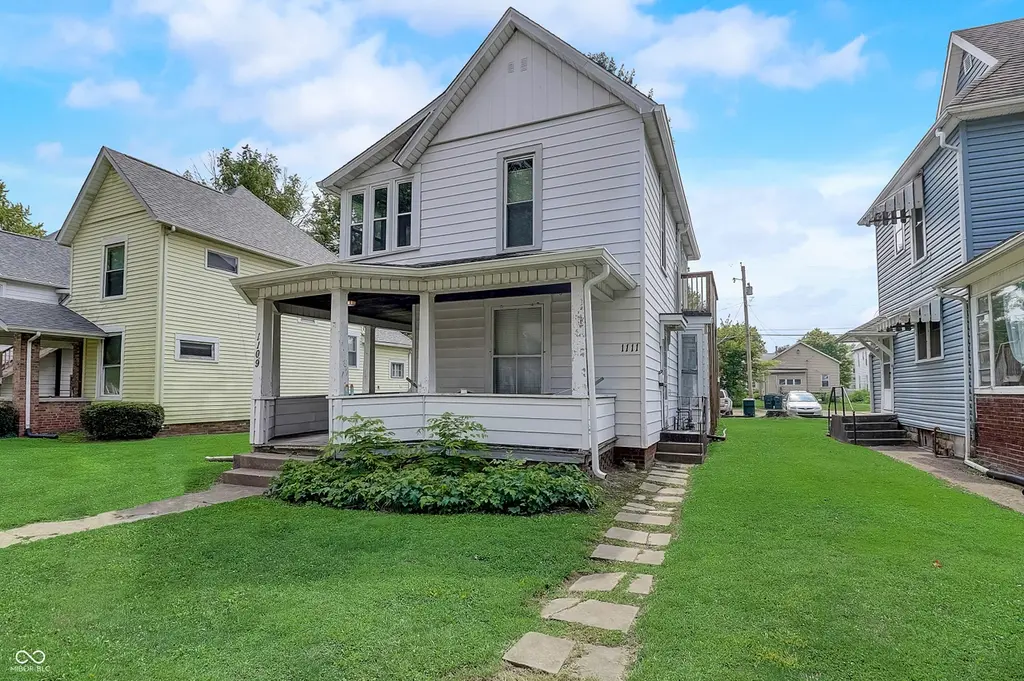
1109 W Ashland Ave · Muncie, IN
Flood risk 4/10 · Minor
- FEMA flood zone
- X (unshaded)
- Chance of flooding over 30 yrs
- 0.21%
- Est. flood insurance / yr
- $473 – $860
Fire risk 1/10 · Minimal
- Est. fire insurance / yr
- $717 – $1,331
Heat risk 3/10 · Minor
- Hot days now (above 100°F)
- 7 days/yr
- Hot days in 30 yrs
- 18 days/yr
Wind risk 2/10 · Minimal
- Chance of severe wind over 30 yrs
- 0.0%
Air-quality risk 3/10 · Minor
- Unhealthy air days now
- 2 days/yr
- Unhealthy air days in 30 yrs
- 3 days/yr
Risk factors via First Street. Map © Google.
Why this score? — see what drove the F grade
The composite is a weighted blend of 9 inputs, each scored 0–100. Each bar is that input's sub-score; the figure is the points it added to the 100-point composite (weight × sub-score).
- Cash flow +4.5/30.0
- Rent growth +4.5/5.0
- Livability +4.0/5.0
- Condition / age +2.5/5.0
- Schools +1.7/10.0
- 1% rule +0.4/10.0
- DSCR +0.0/10.0
- ARV discount +0.0/15.0
- Appreciation +0.0/10.0
$209,000
🖨 Deal sheet (PDF) 📄 Offer letter ✓ Due diligence
Multi-family units
County records classify this as Multi-Family (2-4 Unit). Listing-text estimate: 1 unit. estimate disagrees with records
Listing remarks
A captivating single-family residence built in 1895 offers 1622 square feet of living space, ready for its next chapter. The living room provides a welcoming atmosphere, thoughtfully appointed with built-in shelves, perfect for displaying cherished collections or housing a personal library. One of the full bathrooms features a walk-in shower, offering convenience and a contemporary touch. The upstairs primary bedroom and second bedroom showcase elegant hardwood flooring, adding warmth and character. The property also includes a charming porch, providing an inviting space for relaxation and enjoyment of the outdoors. This distinctive property invites you to envision a life of comfort and cha
Key facts
- 5,625 sq ft lot
- Built 1895
Property features AI
Finance
- Other: Property on approximately 0.13 acre (< 1/4 acre)
Exterior
- Utilities: Public water; Municipal sewer
- Home design: Single family residence; Two levels
- Construction: Vinyl siding; Concrete perimeter foundation
- Exterior features: Wrap-around porch
Interior
- Kitchen: Dishwasher; Gas oven; Microwave with hood; Refrigerator
- Bedrooms: 5 bedrooms total (3 on the main level, 2 on the upper level)
- Flooring: Hardwood floors
- Bathrooms: 2 full bathrooms (1 on the main level, 1 on the upper level)
- Heating & cooling: Natural gas heating; Central air conditioning
- Interior features: Hardwood floors; Finished basement
- Laundry & utility: Washer; Dryer; Gas water heater
Neighborhood map
What this means for you Summary
Snapshot
- This is a 3-bed/2.0-bath multifamily listed at $209k.
Deal economics
- At list price, monthly cash flow is $-538 ($-6k/yr) — negative.
- To cash-flow at today's rent, offer at most $114k (45.5% below list).
- To meet the 1% rule (rent ≥ 1% of price), the offer needs to be $112k (46.4% below list).
- Recommended offer: $112k (46.4% below list) — sets the bar for 1% rule.
- Cap rate 3.2% vs local median 6.0% in Muncie — below-typical yield; the buyer is paying a premium for something (appreciation thesis, condition, location) that the cap rate doesn't capture.
Location & tenants
- Location reads 80/100 on livability (#18 in IN, #1,654 nationally) — a professional / high-income tenant draw. Strengths: amenities A+, commute A+, cost of living A+; Watch: schools D+, crime F, employment F.
- Muncie Community Schools (urban): math 18% / reading 25% proficiency, ranked #275 of 301 in IN (top 91%) — low school quality limits family demand, transient renter base, plan for 1-2y turnover; 68% free/reduced lunch — lower-income household profile, screen leases tightly.
- Market conditions: Rents rising fast (+7.8%/yr); 112 active listings in the ZIP; 25 comparable units currently listed for rent nearby; rentals lingering (median 45d on market — plan ~5-8 weeks vacancy on turnover, expect pricing pressure); 100% of comp listings sitting > 30 days — soft ceiling on asking rent; 171 units permitted in Delaware County in 2024 (57 in 5+ unit buildings).
Forward outlook
- Local home prices are declining (-3.0%/yr); year-one equity from $1k of loan paydown is wiped out by about $6k of value loss. Plan a longer hold.
- Delaware County population projected at -11% by 2050 — secular population decline; favor cash flow + early exit over multi-decade hold.
Negotiation context
- Only 1 days on market — expect competitive offers; lowballing is unlikely to land.
Risks & watch-outs
- Watch-outs: built in 1895 — expect roof / HVAC / electrical / plumbing capex.
Questions for the listing agent
- What do current leases actually rent for vs. the listed asking? Can we see a recent rent roll and the last 12 months of T-12 income?
- Built in 1895 — when were the roof, HVAC, electrical panel, plumbing, and water heater last replaced?
- Is there a deadline driving the sale (1031 exchange, divorce, estate, relocation)? That informs how much negotiation room exists.
- Schools are D-rated, which usually means shorter tenancies and higher turnover. Who's the typical renter profile here, and what's been the actual vacancy rate?
- Crime grade is F in this area — have there been break-ins, vandalism, or insurance claims at this property in the last 3 years? What carrier currently insures it and at what premium?
- The area grade is low — what's the realistic commute time and amenity access for the typical tenant pool here? Any planned neighborhood developments (good or bad) we should know about?
- What's the average days-on-market for RENTAL listings here right now (not sales)? A rising rental-DOM trend means longer vacancies and softer asking-rent achievability than the comps imply.
- What's the recent tenant-quality profile in this submarket — average credit score on applications, eviction rate, late-payment / NSF rate, and stable-employment percentage? A property-management company in the area should have these aggregated.
- How much new apartment / multifamily construction is in the pipeline within 1–3 miles? Heavy new supply (>2% of stock underway) typically softens rents 12–24 months out; light construction supports rent growth.
Investment metrics
- 1% rule
- 0.54% ✗
- Cap rate
- 3.20%
- Cash-on-cash
- -11.03%
- DSCR
- 0.51
- GRM
- 15.6
CMA / ARV
- ARV (on-the-fly)
- $170,310
- Comps found
- 4
Show comp detail 4 sales within ~0.75 mi
| Address | Dist | Beds/Ba | Sqft | Sold | Price | $/sf | Match |
|---|---|---|---|---|---|---|---|
| 822 N Walnut St | 0.71mi | 4/2.0 (+1) | 1,604 (-1%) | 16mo | $33,000 | $21 | 46 |
| 817 W Main St | 0.37mi | 4/3.0 (+1) | 1,792 (+10%) | 14mo | $135,000 | $75 | 45 |
| 826 W Main St | 0.33mi | 3/3.0 | 1,828 (+13%) | 18mo | $260,000 | $142 | 44 |
| 1119 W Bethel Ave | 0.63mi | 4/2.0 (+1) | 1,434 (-12%) | 7mo | $150,000 | $105 | 41 |
Match score weights: distance 35% · size 25% · config 20% · recency 20%. Top-matched comps best support the ARV.
Projected returns pro-forma
-3.0% appreciation · 7.8% rent growth · sell at horizon
- IRR
- -31.4%
- Equity multiple
- -0.07×
- Total profit
- $-62,451
- Equity at exit
- $31,163
- IRR
- -19.8%
- Equity multiple
- -0.24×
- Total profit
- $-72,786
- Equity at exit
- $18,071
Cash invested: $58,520 (down + closing). Projections, not guarantees.
Landlord ↔ Tenant lean methodology
- Overall (STATE)
- 90 Strongly Landlord-Friendly
- State Indiana
- 90 Strongly Landlord-Friendly · R+11
- County
- — inherits STATE
- City
- — inherits STATE
ZIP-level market 47303
- Home prices YoY
- -18.0%
- Rents YoY
- 7.8%
- Active inventory
- 112
- Price-to-rent
- 15.6×
Monthly cashflow live
- Estimated rent
- $1,120 high interval (Pro) →
- Mortgage (P&I)
- −$1,096
- Tax from tax record
- −$239 /mo · $2,870/yr
- Insurance
- −$87
- HOA
- −$0
- Vacancy / Maint / Mgmt
- −$235
- Net cashflow
- $-538
Break-even live
Sensitivity live
| Price | -10% $-420 | -5% $-479 | +0% $-538 | +5% $-597 | +10% $-656 |
|---|---|---|---|---|---|
| Rent | -10% $-626 | -5% $-582 | +0% $-538 | +5% $-494 | +10% $-449 |
| Rate | -1.0pp $-433 | -0.5pp $-485 | base $-538 | +0.5pp $-592 | +1.0pp $-647 |
UW: 25.0% down · 7.5% · 30yr · 1.5% tax · 5.0% vac · 8.0% maint · 8.0% mgmt
Financing live
Cash to close
- Down payment
- $52,250
- Closing costs
- $6,270
- Reserves months
- —
- Total cash needed
- —
Loan-product check · same deal, 3 products live
Conventional
25% down · 7.5% · 30yr
- Down + closing
- —
- Monthly P&I
- —
- Monthly cashflow
- —
- DSCR
- —
- Eligible?
- —
Personal DTI + credit; lowest rate.
DSCR
20% down · 8.5% · 30yr
- Down + closing
- —
- Monthly P&I
- —
- Monthly cashflow
- —
- DSCR
- —
- Eligible?
- —
No personal income docs; deal must DSCR.
Hard money
10% down · 12.0% · 12mo
- Down + closing
- —
- Monthly P&I
- —
- Monthly cashflow
- —
- DSCR
- —
- Eligible?
- —
Short-term bridge; refi at stabilization.
Rent comps 25 comps
| Address | Beds | Baths | Sqft | Rent | $/sqft | DOM | Units | Dist |
|---|---|---|---|---|---|---|---|---|
| 808 W Beechwood Ave Muncie, IN | 4.0 | 2.0 | 1261 | $900 | $0.71 | 44d | 1 | 0.19mi |
| 816 N New York Ave Muncie, IN | 3.0–4.0 | 1.0 | 1200 | $1,000 | $0.83 | 44d | 10 | 0.25mi |
| 1001 W Wayne St Muncie, IN | 3.0 | 2.0 | 1100 | $1,200 | $1.09 | 44d | 1 | 0.28mi |
| 519 N Dill St Muncie, IN | 1.0–2.0 | 1.0 | 900 | $1,125 | $1.25 | 44d | 7 | 0.36mi |
| 522 W Adams St Muncie, IN | 2.0 | 1.0 | 750 | $810 | $1.08 | 44d | 6 | 0.51mi |
| 514 W Charles St Muncie, IN | 2.0 | 1.0 | 1062 | $800 | $0.75 | 44d | 1 | 0.57mi |
| 417 S Council St Muncie, IN | 3.0 | 1.0 | 1132 | $1,025 | $0.91 | 44d | 1 | 0.59mi |
| 1719 W Adams St Muncie, IN | 2.0 | 1.0 | 1159 | $1,000 | $0.86 | 44d | 1 | 0.61mi |
| 312 S Calvert St Muncie, IN | 3.0 | 1.0 | 1813 | $1,500 | $0.83 | 44d | 1 | 0.62mi |
| 412 W Howard St Muncie, IN | 3.0 | 1.0 | 1300 | $1,000 | $0.77 | 44d | 1 | 0.66mi |
| 1200 W Bethel Ave Muncie, IN | 3.0 | 2.0 | 1100 | $1,300 | $1.18 | 44d | 13 | 0.70mi |
| 1001 W 1st St Unit 1 Muncie, IN | 3.0 | 1.5 | 1098 | $875 | $0.80 | 44d | 1 | 0.72mi |
| 711 W Centennial Ave Muncie, IN | 3.0 | 2.0 | 1372 | $1,200 | $0.87 | 44d | 1 | 0.77mi |
| 328 S Talley Ave Muncie, IN | 2.0 | 1.0 | 1770 | $1,400 | $0.79 | 44d | 1 | 0.77mi |
| 720 W Centennial Ave Muncie, IN | 2.0–3.0 | 1.0–2.0 | 1034 | $1,099 | $1.06 | 44d | 1 | 0.84mi |
| 1801 N Glenwood Ave Muncie, IN | 2.0 | 1.0 | 1096 | $1,250 | $1.14 | 44d | 1 | 0.91mi |
| 2201 W Euclid Ave Muncie, IN | 3.0 | 1.0 | 1844 | $1,200 | $0.65 | 44d | 1 | 0.96mi |
| 1901 N Maplewood Ave Muncie, IN | 4.0 | 1.5 | 1887 | $1,700 | $0.90 | 44d | 1 | 0.99mi |
| 305 N Pershing Dr Muncie, IN | 3.0 | 1.0 | 1062 | $1,100 | $1.04 | 44d | 1 | 1.04mi |
| 2600 N Wheeling Ave Muncie, IN | 2.0–3.0 | 1.0 | 1024 | $1,035 | $1.01 | 44d | 1 | 1.14mi |
| 623 W 9th St Muncie, IN | 3.0 | 1.0 | 1574 | $1,499 | $0.95 | 44d | 1 | 1.21mi |
| 605 W 10th St Muncie, IN | 3.0 | 1.0 | 1688 | $1,150 | $0.68 | 44d | 1 | 1.26mi |
| 1109 E Kirby Ave Muncie, IN | 2.0–3.0 | 1.0 | 971 | $975 | $1.00 | 44d | 2 | 1.41mi |
| 2112 W 11th St Muncie, IN | 3.0 | 2.0 | 1646 | $1,000 | $0.61 | 44d | 1 | 1.44mi |
| 1414 E Highland Ave Muncie, IN | 2.0 | 1.5 | 1056 | $900 | $0.85 | 44d | 1 | 1.48mi |
Listing history 2 events
-
2026-05-20status Pending
-
2026-05-17$209,000 Active
ⓘ Source: listings_history table (triggers on properties + properties_extension) + one-shot
backfill from property_details.listing_events for pre-trigger history.
Tax reassessment forecast IN · Partial reset (capped growth)
- Current annual tax
- $2,870 · $239/mo
- Projected year-2 tax
- $2,870 · $239/mo
- Expected delta
- $0/yr ($0/mo · 0.0%)
ⓘ Screening estimate from a state-policy table — verify with the county assessor before closing.
Climate risk First Street
- Flood 4/10 Moderate FEMA zone X (unshaded) · 21% chance over 30 yrs
- Wildfire 1/10 Low
- Heat 3/10 Moderate 7 d/yr ≥100°F today · 18 d/yr by 30 yrs out
- Wind 2/10 Low 0% chance of damaging wind over 30 yrs
- Air quality 3/10 Moderate 2 unhealthy d/yr today · 3 by 30 yrs out
Nearby sold comps map
Loading sold comps map…
Walkable amenities ~0.75 mi
Loading nearby amenities…
Taxation est. · year 1
- Rental income
- $13,434
- − Mortgage interest
- −$11,707
- − Property taxes
- −$2,870
- − Insurance
- −$1,045
- − Repairs & maintenance
- −$1,075
- − Management
- −$1,075
- − Depreciation
- −$6,080
- Taxable loss
- −$10,417
- Est. tax savings @ 24.0%
- +$2,500
- After-tax cash flow
- $-3,954/yr
For passive investors: Depreciation is non-cash, so a rental often shows a tax loss while cash-flowing — sheltering income. Rental losses are passive: they offset passive income freely, and up to $25,000/yr can offset ordinary (W-2) income if you actively participate and your MAGI is under $100k (phasing out to $0 by $150k); unused losses carry forward. On sale, claimed depreciation is recaptured at up to 25%, and gains may owe capital-gains tax (a 1031 exchange can defer both). Figures are a year-1 estimate at your 24.0% rate — not tax advice; consult a CPA.
Schools (NCES district)
- District
- Muncie Community Schools
- NCES district ID
- 1807320
- Math proficiency
- 18% ▼ -9.00%
- Reading proficiency
- 25% ▼ -4.00%
- Median HH income
- $30,052
- Composite
- 17.22/100
- National rank
- #9099
- State rank
- #275 of 301 in IN
Livability — Muncie
- Score
- 80/100
- State rank
- #18
- US rank
- #1654
Category grades
Schools grade is shown separately in the Schools card above.
Census & demographics
- Census place
- Muncie, IN
- County
- Delaware County · 84,658 people
- City population
- 84,658
- Metro
- Muncie, IN
- Population (ZIP)
- 24,392
- Household income
- $47,674
- Rent vs Own
- Severe rent burden
- 1434.0
Population outlook (Delaware County) Hauer SSP2
- Today (2025)
- 113,036 people
- By 2030
- 111,313 · -1.5%
- By 2040
- 106,432 · -5.8%
- By 2050
- 100,747 · -10.9%
- By 2075
- 91,000 · -19.5%
- By 2100
- 80,687 · -28.6%
Race, ethnicity, and origin ACS 2023
- Neighborhood character
- Predominantly White (82%)
- Race & ethnicity
- White 82% Black 9% Two or more races 5% Hispanic / Latino 3%
- Common ancestry
- Italian 4% Slovak 3% Lithuanian 2%
- Foreign-born
- 2% · Canada
- Languages at home
- 97% English-only · Spanish 1%
Political lean MEDSL · Delaware
- 2024 margin
- R (+15.8) · D 41.2% · R 57.0% · Other 1.8%
- 2008→2024 swing
- -30.8pp toward R · 2008: 15.0pp · 2024: -15.8pp
- All cycles
- 2024: R+15.8 2020: R+13.2 2016: R+13.7 2012: D+3.1 2008: D+15.0
Not yet ingested
- Civics
- —
Market trends
- HPI YoY
- ▼ -50.45%
- Current HPI
- 229.8654
- Rent YoY
- ▲ 7.80%
- Metro
- Muncie, IN
- State GDP YoY
- ▲ 2.90%
- F500 in state
- 18
Industry mix (Fortune 500 HQ in IN)
| Industry | F500 HQs | Revenue |
|---|---|---|
| Industrial Machinery | 2 | $37B |
|
||
| Healthcare | 1 | $177B |
|
||
| Pharmaceuticals | 1 | $45B |
|
||
| Metals / Steel | 1 | $18B |
|
||
| Agriculture | 1 | $17B |
|
||
| Packaging | 1 | $12B |
|
||
Price history
2 events — show timeline
- 2026-05-20 Pending — MIBOR as Distributed by MLS Grid
- 2026-05-17 Listed $209,000 MIBOR as Distributed by MLS Grid
Property tax history
-1.1%/yrLatest (2024): $2,870 · +19.1% YoY. Source: county tax records.
Cash-flow waterfall
monthlySold comps — $/sqft
last 12 mo · ≤1 miLoading sold comps…