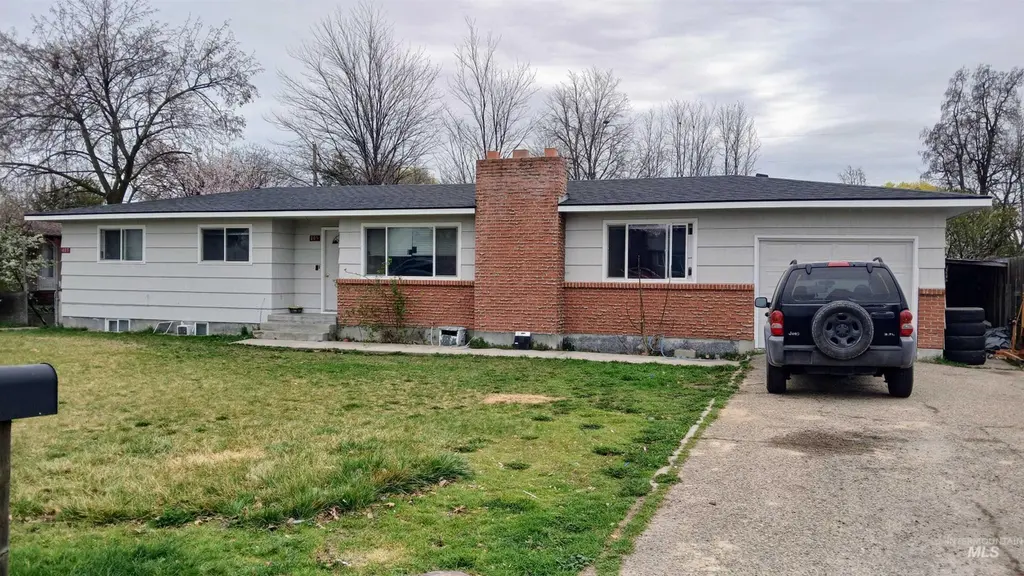
403 - 405 W Hazel St · Caldwell, ID
Flood risk 4/10 · Minor
- FEMA flood zone
- X (unshaded)
- Chance of flooding over 30 yrs
- 0.22%
- Est. flood insurance / yr
- $473 – $860
Fire risk 1/10 · Minimal
- Est. fire insurance / yr
- $584 – $1,086
Heat risk 4/10 · Minor
- Hot days now (above 98°F)
- 7 days/yr
- Hot days in 30 yrs
- 18 days/yr
Wind risk 1/10 · Minimal
- Chance of severe wind over 30 yrs
- —
Air-quality risk 7/10 · Major
- Unhealthy air days now
- 11 days/yr
- Unhealthy air days in 30 yrs
- 18 days/yr
Risk factors via First Street. Map © Google.
Why this score? — see what drove the C grade
The composite is a weighted blend of 9 inputs, each scored 0–100. Each bar is that input's sub-score; the figure is the points it added to the 100-point composite (weight × sub-score).
- Cash flow +21.2/30.0
- ARV discount +7.5/15.0
- DSCR +6.7/10.0
- Appreciation +5.0/10.0
- 1% rule +4.7/10.0
- Livability +3.4/5.0
- Rent growth +2.5/5.0
- Condition / age +2.5/5.0
- Schools +2.0/10.0
$420,000
🖨 Deal sheet 📄 Offer letter ✓ Due diligence
Listing remarks
Seller offering $10,000 credit at closing with acceptable offer. Versatile investment opportunity! This property can function as a duplex or a single-family home and is conveniently located near West Valley Medical Center, just minutes from downtown Caldwell and the College of Idaho. The home features a brand new roof, fresh exterior paint, and spacious living areas throughout. The upstairs level offers a large living room with a fireplace, three spacious bedrooms, a formal dining area, a separate breakfast area, and a one-car garage. The lower level includes four additional spacious bedrooms. The partially fenced yard with alley access provides added convenience and potential.
Key facts
- Large living room
- Fresh exterior paint
- New roof
Tags
Property features AI
Finance
- Financial info: Property used as other (currently other); 2 units total
Exterior
- Parking: Attached 1-car garage; Finished driveway; 2 total parking spaces (1 covered)
- Utilities: City water service; Sewer connected; Separate electric meters for Unit 1 and Unit 2
- Home design: Duplex; Built in 1960
- Construction: Frame construction; Composition roof
- Exterior features: Garden; Lot about 10,000 sq ft (.49 acre)
Interior
- Kitchen: Stove/Range (all units); Refrigerator (all units)
- Bedrooms: 7 bedrooms total
- Flooring: Laminate flooring; Vinyl sheet flooring
- Bathrooms: 3 bathrooms total
- Heating & cooling: Electric baseboard heating
- Interior features: Multi-unit property (duplex)
- Laundry & utility: Washer/Dryer hookups in all units
Neighborhood map
What this means for you Summary
Snapshot
- This is a 6-bed/2.5-bath other listed at $420k.
Deal economics
- At list price, monthly cash flow is $604 ($7k/yr) — positive.
- The deal already cash-flows at list — no discount required.
- To meet the 1% rule (rent ≥ 1% of price), the offer needs to be $408k (2.9% below list).
- Recommended offer: $395k (6.0% below list) — sets the bar for market timing.
- Cap rate 8.0% vs local median 3.1% in Caldwell — top-decile yield for the area; either an underpriced asset or a hidden risk that comps aren't pricing in. Stress-test before assuming the spread holds.
Location & tenants
- Location reads 67/100 on livability (#88 in ID) — a middle-class / working-renter tenant base. Strengths: cost of living A+, housing A+; Watch: crime C-, employment D+, amenities F.
- Caldwell District (suburban): math 17% / reading 31% proficiency, ranked #90 of 92 in ID (top 98%) — low school quality limits family demand, transient renter base, plan for 1-2y turnover; 72% free/reduced lunch — lower-income household profile, screen leases tightly.
- Zoned schools: Wilson Elementary School (math 15% / reading 26%, grade F, #343 of 357 statewide, top 96%, 466 students, 72% FRL); Caldwell Senior High School (math 16% / reading 38%, grade F, #131 of 169 statewide, top 77%, 1,474 students, 76% FRL) — zoned schools at 74% FRL track the district average.
- Market conditions: 1 active listings in the ZIP; 2 comparable units currently listed for rent nearby; 3,620 units permitted in Canyon County in 2024 (196 in 5+ unit buildings).
Forward outlook
- In year one you build about $16k of equity ($3k loan paydown + $13k appreciation (3.0% local appreciation)).
- Canyon County population projected at +41% by 2050 — long-run rental-demand tailwind backs the buy-and-hold thesis.
- At projected returns (3.0% appreciation + 3.0% rent growth), your $118k cash investment doubles in ~5 years — after that, you're playing with house money.
- By year 3, paydown + projected appreciation supports a ~$39k cash-out refi (75% LTV) — recoverable capital for the next deal without selling this one.
Negotiation context
- It's been on market 85 days — a 6% lower offer ($395k) is reasonable based on typical stale-listing flexibility.
- 8 sale attempts since 24y ago with the ask held roughly flat each time — persistent listings suggest the price (not the market) is what's stuck; bring a comps-based counter.
Questions for the listing agent
- It's been on market 85 days. Have you received any prior offers? Is the seller open to a 6% concession, seller financing, or rate buy-down credit?
- Built in 1960 — when were the roof, HVAC, electrical panel, plumbing, and water heater last replaced?
- Why hasn't it sold? Are there any deal-killer items the seller is aware of (foundation, flood, title, zoning, code violations)?
- Is there a deadline driving the sale (1031 exchange, divorce, estate, relocation)? That informs how much negotiation room exists.
- Schools are D-rated, which usually means shorter tenancies and higher turnover. Who's the typical renter profile here, and what's been the actual vacancy rate?
- What's the average days-on-market for RENTAL listings here right now (not sales)? A rising rental-DOM trend means longer vacancies and softer asking-rent achievability than the comps imply.
- What's the recent tenant-quality profile in this submarket — average credit score on applications, eviction rate, late-payment / NSF rate, and stable-employment percentage? A property-management company in the area should have these aggregated.
- How much new for-sale + rental construction is in the pipeline within 1–3 miles? Heavy new supply typically softens prices + rents 12–24 months out; constrained supply supports both.
Investment metrics
- 1% rule
- 0.97% ✗
- Cap rate
- 8.02%
- Cash-on-cash
- 6.16%
- DSCR
- 1.27
- GRM
- 8.6
CMA / ARV
No comps found within radius.
Projected returns pro-forma
3.0% appreciation · 3.0% rent growth · sell at horizon
- IRR
- 13.2%
- Equity multiple
- 1.76×
- Total profit
- $88,951
- Equity at exit
- $188,850
- IRR
- 15.2%
- Equity multiple
- 3.23×
- Total profit
- $262,651
- Equity at exit
- $291,041
Cash invested: $117,600 (down + closing). Projections, not guarantees.
Landlord ↔ Tenant lean methodology
- Overall (STATE)
- 91 Strongly Landlord-Friendly
- State Idaho
- 91 Strongly Landlord-Friendly · R+18
- County
- — inherits STATE
- City
- — inherits STATE
ZIP-level market 83605-4723
- Active inventory
- 1
- Price-to-rent
- 8.6×
Monthly cashflow live
- Estimated rent
- $4,077 medium interval (Pro) →
- Mortgage (P&I)
- −$2,203
- Tax from tax record
- −$239 /mo · $2,868/yr
- Insurance
- −$175
- HOA
- −$0
- Vacancy / Maint / Mgmt
- −$856
- Net cashflow
- $604
Break-even live
UW: 25.0% down · 7.5% · 30yr · 1.5% tax · 5.0% vac · 8.0% maint · 8.0% mgmt
Financing live
Cash to close
- Down payment
- $105,000
- Closing costs
- $12,600
- Reserves months
- —
- Total cash needed
- —
Loan-product check · same deal, 3 products live
Conventional
25% down · 7.5% · 30yr
- Down + closing
- —
- Monthly P&I
- —
- Monthly cashflow
- —
- DSCR
- —
- Eligible?
- —
Personal DTI + credit; lowest rate.
DSCR
20% down · 8.5% · 30yr
- Down + closing
- —
- Monthly P&I
- —
- Monthly cashflow
- —
- DSCR
- —
- Eligible?
- —
No personal income docs; deal must DSCR.
Hard money
10% down · 12.0% · 12mo
- Down + closing
- —
- Monthly P&I
- —
- Monthly cashflow
- —
- DSCR
- —
- Eligible?
- —
Short-term bridge; refi at stabilization.
Rent comps 2 comps
| Address | Beds | Baths | Sqft | Rent | $/sqft | DOM | Units | Dist |
|---|---|---|---|---|---|---|---|---|
| 1502 Ellis Ave Caldwell, ID | 6.0 | 2.5 | 2312 | $2,900 | $1.25 | 21d | 1 | 0.42mi |
| 1601 Dearborn St Unit 1509799P Caldwell, ID | 5.0 | 2.5 | 2992 | $6,448 | $2.16 | 11d | 1 | 1.09mi |
Listing history 38 events
-
2026-06-18days on market $420,000 Active 85 DOM
-
2026-06-17days on market $420,000 Active 84 DOM
-
2026-06-16days on market $420,000 Active 83 DOM
-
2026-06-15days on market $420,000 Active 82 DOM
-
2026-06-13days on market $420,000 Active 80 DOM
-
2026-06-13pricedays on market $420,000 Active 79 DOM
-
2026-06-10days on market $429,999 Active 77 DOM
-
2026-06-09days on market $429,999 Active 76 DOM
-
2026-06-08days on market $429,999 Active 75 DOM
-
2026-06-07days on market $429,999 Active 74 DOM
-
2026-06-03days on market $429,999 Active 70 DOM
-
2026-06-03days on market $429,999 Active 69 DOM
-
2026-06-01days on market $429,999 Active 68 DOM
-
2026-05-31days on market $429,999 Active 67 DOM
-
2026-05-13price $429,999
-
2026-04-23price $430,000
-
2026-03-25$440,000 Active
-
2024-12-18historical $1,500
-
2024-12-17historical $1,500
-
2024-12-11price $1,500
-
2024-12-11price $1,500
-
2024-12-05price $1,550
-
2024-12-05price $1,550
-
2024-10-19price $1,600
-
2024-10-19price $1,600
-
2024-09-10$1,700
-
2024-09-07$1,700
-
2024-08-18historical $1,700
-
2024-08-18historical $1,700
-
2024-08-16$1,700
-
2024-08-16$1,700
-
2023-06-11historical
-
2015-05-15soldstatus
-
2015-03-03$169,900
-
2015-03-03$169,900
-
2002-07-16soldstatus
-
2002-07-10soldstatus
-
2002-01-04$94,900
ⓘ Source: listings_history table (triggers on properties + properties_extension) + one-shot
backfill from property_details.listing_events for pre-trigger history.
Tax reassessment forecast ID · Resets to sale price
- Current annual tax
- $2,868 · $239/mo
- Projected year-2 tax
- $2,898 · $242/mo
- Expected delta
- +$30/yr (+$2/mo · 1.0%)
ⓘ Screening estimate from a state-policy table — verify with the county assessor before closing.
Climate risk First Street
- Flood 4/10 Moderate FEMA zone X (unshaded) · 22% chance over 30 yrs
- Wildfire 1/10 Low
- Heat 4/10 Moderate 7 d/yr ≥98°F today · 18 d/yr by 30 yrs out
- Wind 1/10 Low
- Air quality 7/10 Severe 11 unhealthy d/yr today · 18 by 30 yrs out
Nearby sold comps map
Loading sold comps map…
Walkable amenities ~0.75 mi
Loading nearby amenities…
Taxation est. · year 1
- Rental income
- $48,920
- − Mortgage interest
- −$23,527
- − Property taxes
- −$2,868
- − Insurance
- −$2,100
- − Repairs & maintenance
- −$3,914
- − Management
- −$3,914
- − Depreciation
- −$12,218
- Taxable income
- $380
- Est. tax owed @ 24.0%
- −$91
- After-tax cash flow
- $7,157/yr
For passive investors: Depreciation is non-cash, so a rental often shows a tax loss while cash-flowing — sheltering income. Rental losses are passive: they offset passive income freely, and up to $25,000/yr can offset ordinary (W-2) income if you actively participate and your MAGI is under $100k (phasing out to $0 by $150k); unused losses carry forward. On sale, claimed depreciation is recaptured at up to 25%, and gains may owe capital-gains tax (a 1031 exchange can defer both). Figures are a year-1 estimate at your 24.0% rate — not tax advice; consult a CPA.
Schools (NCES district)
- District
- Caldwell District
- NCES district ID
- 1600510
- Math proficiency
- 17% ▼ -11.00%
- Reading proficiency
- 31% ▼ -4.00%
- Median HH income
- $36,116
- Composite
- 19.85/100
- National rank
- #8694
- State rank
- #90 of 92 in ID
Livability — Caldwell
- Score
- 67/100
- State rank
- #88
- US rank
- #10145
Category grades
Schools grade is shown separately in the Schools card above.
Census & demographics
- Census place
- Caldwell, ID
Population outlook (Canyon County) Hauer SSP2
- Today (2025)
- 248,853 people
- By 2030
- 269,596 · +8.3%
- By 2040
- 311,081 · +25.0%
- By 2050
- 350,809 · +41.0%
- By 2075
- 441,884 · +77.6%
- By 2100
- 505,641 · +103.2%
Not yet ingested
- Political lean
- —
- Race & ethnicity
- —
- Common origin
- —
- Civics
- —
Market trends
- HPI YoY
- —
- Current HPI
- —
- Rent YoY
- —
- Metro
- —
- State GDP YoY
- ▲ 4.51%
- F500 in state
- 6
Industry mix (Fortune 500 HQ in ID)
| Industry | F500 HQs | Revenue |
|---|---|---|
| Retail | 1 | $79B |
|
||
| Technology | 1 | $25B |
|
||
| Food / Agriculture | 1 | $6B |
|
||
Price history
+353.1% since first listed24 events — show timeline
- 2026-05-13 Price Changed $429,999 IMLS
- 2026-04-23 Price Changed $430,000 IMLS
- 2026-03-25 Listed $440,000 IMLS
- 2024-12-18 Rental Removed $1,500 SHOWMOJO
- 2024-12-17 Rental Removed $1,500 RENT.
- 2024-12-11 Price Changed $1,500 RENT.
- 2024-12-11 Price Changed $1,500 SHOWMOJO
- 2024-12-05 Price Changed $1,550 RENT.
- 2024-12-05 Price Changed $1,550 SHOWMOJO
- 2024-10-19 Price Changed $1,600 RENT.
- 2024-10-19 Price Changed $1,600 SHOWMOJO
- 2024-09-10 Listed for Rent $1,700 SHOWMOJO
- 2024-09-07 Listed for Rent $1,700 RENT.
- 2024-08-18 Rental Removed $1,700 SHOWMOJO
- 2024-08-18 Rental Removed $1,700 APPFOLIO
- 2024-08-16 Listed for Rent $1,700 APPFOLIO
- 2024-08-16 Listed for Rent $1,700 SHOWMOJO
- 2023-06-11 Rental Removed — RENT.
- 2015-05-15 Sold (Public Records) — Public Records
- 2015-03-03 Listed $169,900 IMLS
- 2015-03-03 Listed $169,900 IMLS
- 2002-07-16 Sold (Public Records) — Public Records
- 2002-07-10 Sold (MLS) — IMLS
- 2002-01-04 Listed $94,900 IMLS
Property tax history
+1.2%/yrLatest (2025): $2,868 · +15.3% YoY. Source: county tax records.
Cash-flow waterfall
monthlySold comps — $/sqft
last 12 mo · ≤1 miLoading sold comps…