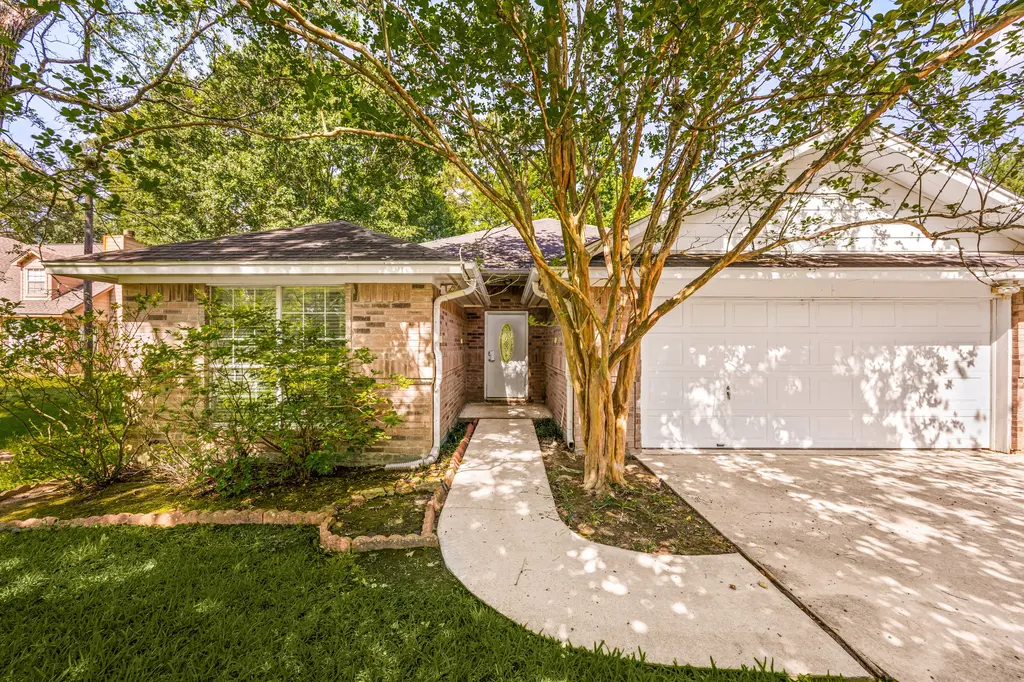
811 Carson Dr · The Woodlands, TX
Flood risk 1/10 · Minimal
- FEMA flood zone
- X (unshaded)
- Chance of flooding over 30 yrs
- 0.0%
- Est. flood insurance / yr
- $507 – $1,088
Fire risk 3/10 · Minor
- Est. fire insurance / yr
- $1,222 – $2,270
Heat risk 8/10 · Major
- Hot days now (above 111°F)
- 7 days/yr
- Hot days in 30 yrs
- 24 days/yr
Wind risk 8/10 · Major
- Chance of severe wind over 30 yrs
- 99.0%
Air-quality risk 2/10 · Minimal
- Unhealthy air days now
- 2 days/yr
- Unhealthy air days in 30 yrs
- 2 days/yr
Risk factors via First Street. Map © Google.
Why this score? — see what drove the C- grade
The composite is a weighted blend of 9 inputs, each scored 0–100. Each bar is that input's sub-score; the figure is the points it added to the 100-point composite (weight × sub-score).
- Cash flow +12.8/30.0
- Appreciation +10.0/10.0
- ARV discount +9.6/15.0
- Livability +4.5/5.0
- Schools +3.9/10.0
- 1% rule +3.8/10.0
- DSCR +3.8/10.0
- Rent growth +2.6/5.0
- Condition / age +2.5/5.0
$275,000
🖨 Deal sheet (PDF) 📄 Offer letter ✓ Due diligence
Listing remarks
Welcome to this charming 3 bed/2 bath single family home in a quiet neighborhood with wildlife and great amentities including a swimming pool, tennis court, playground & more! From the curb there is a sense of calm and certainly pride of ownership. As you enter the formal foyer the high ceilings and wide hall way is warm & welcoming, pulling you into the semi-open concept living space. The split floor plan features two secondary bedrooms flanked to the left of the front door split by a full bath. The living room is light & bright, joining the large dining space & kitchen all anchored by the cozy corner gas fireplace. Large primary bedroom features an en-suite bath wi
Key facts
- 0.28 acre lot
- 2 garage spots
- Community pool
Property features AI
Finance
- HOA & community: Woodland Oaks POA; Annual association fee of $384; Community pool
Exterior
- Parking: Attached garage with 2 spaces
- Security: Prewired for security; Owned security system; Smoke detectors
- Utilities: Public water; Public sewer
- Home design: Residential property facing east; Single-story entry (all main rooms listed on first floor)
- Construction: Brick construction; Composition roof; Slab foundation; Built in 2000
- Exterior features: Covered patio; Patio; Deck; Subdivision lot
Interior
- Kitchen: Dishwasher; Gas cooktop; Gas oven; Microwave; Disposal; ENERGY STAR qualified appliances
- Bedrooms: Primary bedroom on the first floor; Two additional bedrooms on the first floor (3 total bedrooms)
- Flooring: Carpet; Laminate
- Bathrooms: 2 full bathrooms
- Heating & cooling: Central heating (gas); Central air conditioning (electric)
- Interior features: Solid surface counters; Separate shower; Gas and wood-burning fireplace (1)
- Laundry & utility: Washer hookup; Gas dryer hookup
Neighborhood map
What this means for you Summary
Snapshot
- This is a 3-bed/2.0-bath single-family listed at $275k.
Deal economics
- At list price, monthly cash flow is $-25 ($-294/yr) — negative.
- To cash-flow at today's rent, offer at most $271k (1.6% below list).
- To meet the 1% rule (rent ≥ 1% of price), the offer needs to be $242k (11.8% below list).
- Recommended offer: $242k (11.8% below list) — sets the bar for 1% rule.
- Cap rate 6.2% vs local median 2.3% in The Woodlands — top-decile yield for the area; either an underpriced asset or a hidden risk that comps aren't pricing in. Stress-test before assuming the spread holds.
Location & tenants
- Location reads 91/100 on livability (#1 in TX, #47 nationally) — a professional / high-income tenant draw. Strengths: amenities A+, commute A+, employment A+; Watch: cost of living D-.
- Magnolia ISD (rural): math 42% / reading 45% proficiency, ranked #247 of 826 in TX (top 30%) — families likely to look elsewhere, expect single-tenant / working-renter base with shorter leases.
- Zoned schools: Tom R Ellisor El (math 44% / reading 44%, grade F, #1,243 of 4,322 statewide, top 29%, 492 students, 40% FRL); Bear Branch J H (math 44% / reading 46%, grade D, #479 of 1,662 statewide, top 29%, 1,076 students, 37% FRL); Magnolia H S (math 47% / reading 62%, grade C-, #379 of 1,632 statewide, top 26%, 2,248 students, 31% FRL) — zoned schools at 36% FRL track the district average.
- Market conditions: Rents flat; 1621 active listings in the ZIP; 4 comparable units currently listed for rent nearby; rentals lingering (median 45d on market — plan ~5-8 weeks vacancy on turnover, expect pricing pressure); 50% of comp listings sitting > 30 days — soft ceiling on asking rent; high-income renter base; 13,259 units permitted in Montgomery County in 2024 (1,402 in 5+ unit buildings).
Forward outlook
- In year one you build about $29k of equity ($2k loan paydown + $28k appreciation (10.0% local appreciation)).
- Montgomery County population projected at +65% by 2050 — long-run rental-demand tailwind backs the buy-and-hold thesis.
- At projected returns (10.0% appreciation + 0.3% rent growth), your $77k cash investment doubles in ~3 years — after that, you're playing with house money.
- By year 2, paydown + projected appreciation supports a ~$47k cash-out refi (75% LTV) — recoverable capital for the next deal without selling this one.
Negotiation context
- It's been on market 46 days — a 3% lower offer ($267k) is reasonable based on typical stale-listing flexibility.
Risks & watch-outs
- Climate carrying-cost: severe wind risk, 99% chance of damaging wind over 30y; extreme-heat days projected 7→24/yr by 2055 (HVAC capex compounding) — expect insurance premiums to compound above CPI over the hold.
Questions for the listing agent
- What do current leases actually rent for vs. the listed asking? Can we see a recent rent roll and the last 12 months of T-12 income?
- It's been on market 46 days. Have you received any prior offers? Is the seller open to a 12% concession, seller financing, or rate buy-down credit?
- What does the HOA fee cover, when was the last increase, and are there any pending special assessments or reserve-fund shortfalls?
- Is there a deadline driving the sale (1031 exchange, divorce, estate, relocation)? That informs how much negotiation room exists.
- Schools are A-rated — typically a magnet for longer-tenancy family renters. What's the average tenant stay here, and is there a school-zone premium baked into asking?
- What's the average days-on-market for RENTAL listings here right now (not sales)? A rising rental-DOM trend means longer vacancies and softer asking-rent achievability than the comps imply.
- What's the recent tenant-quality profile in this submarket — average credit score on applications, eviction rate, late-payment / NSF rate, and stable-employment percentage? A property-management company in the area should have these aggregated.
- How much new for-sale + rental construction is in the pipeline within 1–3 miles? Heavy new supply typically softens prices + rents 12–24 months out; constrained supply supports both.
Investment metrics
- 1% rule
- 0.88% ✗
- Cap rate
- 6.19%
- Cash-on-cash
- -0.38%
- DSCR
- 0.98
- GRM
- 9.5
CMA / ARV
- ARV (median comp)
- $288,719
- List price
- $275,000
- Delta
- -4.75%
- Verdict
- FAIR
- Comps
- 20 within 1.0 mi
Show comp detail 12 sales within ~0.75 mi
| Address | Dist | Beds/Ba | Sqft | Sold | Price | $/sf | Match |
|---|---|---|---|---|---|---|---|
| 33515 Forest West St | 0.22mi | 3/2.0 | 1,521 (-10%) | 1mo | $235,000 | $155 | 73 |
| 7127 Hayden Dr | 0.12mi | 4/2.5 (+1) | 1,869 (+11%) | 4mo | $315,000 | $169 | 66 |
| 7119 Durango Dr | 0.08mi | 4/2.0 (+1) | 1,906 (+13%) | 6mo | $299,000 | $157 | 64 |
| 7022 Dillon Dr | 0.34mi | 4/2.0 (+1) | 1,867 (+11%) | 4mo | $300,000 | $161 | 58 |
| 6626 Grant Dr | 0.67mi | 3/2.0 | 1,570 (-7%) | 5mo | $255,000 | $162 | 53 |
| 7023 Casita Dr | 0.46mi | 3/2.0 | 1,485 (-12%) | 8mo | $270,000 | $182 | 52 |
| 723 Hinsdale | 0.59mi | 4/2.0 (+1) | 1,841 (+9%) | 3mo | $299,000 | $162 | 50 |
| 33127 Cottonwood Bnd | 0.61mi | 4/2.5 (+1) | 1,834 (+9%) | 1mo | $225,000 | $123 | 49 |
| 6846 Durango Creek Dr | 0.63mi | 3/2.0 | 1,910 (+13%) | 3mo | $285,000 | $149 | 46 |
| 6835 Durango Creek Dr | 0.66mi | 3/2.0 | 1,495 (-11%) | 8mo | $254,900 | $171 | 43 |
| 6622 Dillon Dr | 0.70mi | 3/3.0 | 1,896 (+12%) | 0mo | $318,000 | $168 | 42 |
| 6626 Dillon Dr | 0.69mi | 3/2.0 | 1,488 (-12%) | 9mo | $255,000 | $171 | 41 |
Match score weights: distance 35% · size 25% · config 20% · recency 20%. Top-matched comps best support the ARV.
Projected returns pro-forma
10.0% appreciation · 0.32% rent growth · sell at horizon
- IRR
- 23.1%
- Equity multiple
- 2.84×
- Total profit
- $141,903
- Equity at exit
- $247,742
- IRR
- 20.0%
- Equity multiple
- 6.29×
- Total profit
- $407,674
- Equity at exit
- $534,265
Cash invested: $77,000 (down + closing). Projections, not guarantees.
Landlord ↔ Tenant lean methodology
- Overall (STATE)
- 87 Strongly Landlord-Friendly
- State Texas
- 87 Strongly Landlord-Friendly · R+5
- County
- — inherits STATE
- City
- — inherits STATE
ZIP-level market 77354
- Home prices YoY
- 2.4%
- Rents YoY
- 0.3%
- Active inventory
- 1621
- Price-to-rent
- 9.5×
Monthly cashflow live
- Estimated rent
- $2,425 medium interval (Pro) →
- Mortgage (P&I)
- −$1,442
- Tax from tax record
- −$351 /mo · $4,214/yr
- Insurance
- −$115
- HOA
- −$32
- Vacancy / Maint / Mgmt
- −$509
- Net cashflow
- $-25
Break-even live
Sensitivity live
| Price | -10% $131 | -5% $53 | +0% $-25 | +5% $-102 | +10% $-180 |
|---|---|---|---|---|---|
| Rent | -10% $-216 | -5% $-120 | +0% $-25 | +5% $71 | +10% $167 |
| Rate | -1.0pp $114 | -0.5pp $45 | base $-25 | +0.5pp $-96 | +1.0pp $-168 |
UW: 25.0% down · 7.5% · 30yr · 1.5% tax · 5.0% vac · 8.0% maint · 8.0% mgmt
Financing live
Cash to close
- Down payment
- $68,750
- Closing costs
- $8,250
- Reserves months
- —
- Total cash needed
- —
Loan-product check · same deal, 3 products live
Conventional
25% down · 7.5% · 30yr
- Down + closing
- —
- Monthly P&I
- —
- Monthly cashflow
- —
- DSCR
- —
- Eligible?
- —
Personal DTI + credit; lowest rate.
DSCR
20% down · 8.5% · 30yr
- Down + closing
- —
- Monthly P&I
- —
- Monthly cashflow
- —
- DSCR
- —
- Eligible?
- —
No personal income docs; deal must DSCR.
Hard money
10% down · 12.0% · 12mo
- Down + closing
- —
- Monthly P&I
- —
- Monthly cashflow
- —
- DSCR
- —
- Eligible?
- —
Short-term bridge; refi at stabilization.
Rent comps 4 comps
| Address | Beds | Baths | Sqft | Rent | $/sqft | DOM | Units | Dist |
|---|---|---|---|---|---|---|---|---|
| 7210 Alava Dr Magnolia, TX | 4.0 | 3.0 | 2031 | $2,235 | $1.10 | 44d | 1 | 0.39mi |
| 33200 Forest West St Magnolia, TX | 1.0–3.0 | 1.5–2.5 | 1307 | $4,065 | $3.11 | 2d | 22 | 0.59mi |
| 33124 Magnolia Cir Magnolia, TX | 2.0 | 2.0 | 1122 | $1,875 | $1.67 | 44d | 1 | 0.76mi |
| 39300 Cimarron Way Magnolia, TX | 2.0 | 2.0 | 1172 | $1,353 | $1.15 | 12d | 1 | 0.95mi |
HOA detail
- Monthly dues
- $32 · $384/yr
- Likely covers
- gaspool
Listing history 17 events
-
2026-06-21days on market $275,000 Active 46 DOM
-
2026-06-18days on market $275,000 Active 43 DOM
-
2026-06-17days on market $275,000 Active 42 DOM
-
2026-06-16days on market $275,000 Active 41 DOM
-
2026-06-15days on market $275,000 Active 40 DOM
-
2026-06-13days on market $275,000 Active 38 DOM
-
2026-06-09days on market $275,000 Active 34 DOM
-
2026-06-08days on market $275,000 Active 33 DOM
-
2026-06-07days on market $275,000 Active 32 DOM
-
2026-06-04days on market $275,000 Active 29 DOM
-
2026-06-03days on market $275,000 Active 28 DOM
-
2026-06-02days on market $275,000 Active 27 DOM
-
2026-06-01days on market $275,000 Active 26 DOM
-
2026-05-31days on market $275,000 Active 25 DOM
-
2026-05-06$275,000 Active 1012-char remark
-
2026-05-04historical $275,000 1012-char remark
-
2000-01-31soldstatus
ⓘ Source: listings_history table (triggers on properties + properties_extension) + one-shot
backfill from property_details.listing_events for pre-trigger history.
Tax reassessment forecast TX · Resets to sale price
- Current annual tax
- $4,214 · $351/mo
- Projected year-2 tax
- $5,032 · $419/mo
- Expected delta
- +$818/yr (+$68/mo · 19.4%)
ⓘ Screening estimate from a state-policy table — verify with the county assessor before closing.
Climate risk First Street
- Flood 1/10 Low FEMA zone X (unshaded) · 0% chance over 30 yrs
- Wildfire 3/10 Moderate
- Heat 8/10 Severe 7 d/yr ≥111°F today · 24 d/yr by 30 yrs out
- Wind 8/10 Severe 99% chance of damaging wind over 30 yrs
- Air quality 2/10 Low 2 unhealthy d/yr today · 2 by 30 yrs out
Nearby sold comps map
Loading sold comps map…
Walkable amenities ~0.75 mi
Loading nearby amenities…
Taxation est. · year 1
- Rental income
- $29,094
- − Mortgage interest
- −$15,404
- − Property taxes
- −$4,214
- − Insurance
- −$1,375
- − Repairs & maintenance
- −$2,328
- − Management
- −$2,328
- − HOA
- −$384
- − Depreciation
- −$8,000
- Taxable loss
- −$4,938
- Est. tax savings @ 24.0%
- +$1,185
- After-tax cash flow
- $891/yr
For passive investors: Depreciation is non-cash, so a rental often shows a tax loss while cash-flowing — sheltering income. Rental losses are passive: they offset passive income freely, and up to $25,000/yr can offset ordinary (W-2) income if you actively participate and your MAGI is under $100k (phasing out to $0 by $150k); unused losses carry forward. On sale, claimed depreciation is recaptured at up to 25%, and gains may owe capital-gains tax (a 1031 exchange can defer both). Figures are a year-1 estimate at your 24.0% rate — not tax advice; consult a CPA.
Schools (NCES district)
- District
- Magnolia ISD
- NCES district ID
- 4828740
- Math proficiency
- 42% ▼ -7.00%
- Reading proficiency
- 45% ▼ -4.00%
- Median HH income
- $71,692
- Composite
- 39.46/100
- National rank
- #3958
- State rank
- #247 of 826 in TX
Livability — The Woodlands
- Score
- 91/100
- State rank
- #1
- US rank
- #47
Category grades
Schools grade is shown separately in the Schools card above.
Census & demographics
- County
- Montgomery County · 663,713 people
- City population
- 106,505
- Metro
- Houston-The Woodlands-Sugar Land, TX
- Population (ZIP)
- 44,900
- Household income
- $112,504
- Rent vs Own
- Severe rent burden
- 586.0
Population outlook (Montgomery County) Hauer SSP2
- Today (2025)
- 713,896 people
- By 2030
- 805,263 · +12.8%
- By 2040
- 992,708 · +39.1%
- By 2050
- 1,179,590 · +65.2%
- By 2075
- 1,628,084 · +128.1%
- By 2100
- 1,937,880 · +171.5%
Race, ethnicity, and origin ACS 2023
- Neighborhood character
- Predominantly White (66%)
- Race & ethnicity
- White 66% Hispanic / Latino 25% Two or more races 18% Black 3% Asian 1%
- Hispanic origin (detail)
- Mexican 14% Puerto Rican 1%
- Common ancestry
- Lithuanian 4% Slovak 2% Italian 2%
- Foreign-born
- 11% · Canada, Vietnam
- Languages at home
- 83% English-only · Spanish 15% Other Indo-European 1% German/W. Germanic 1%
Political lean MEDSL · Montgomery
- 2024 margin
- Solid R (+45.5) · D 26.8% · R 72.3%
- 2008→2024 swing
- +7.2pp toward D · 2008: -52.7pp · 2024: -45.5pp
- All cycles
- 2024: R+45.5 2020: R+43.8 2016: R+51.4 2012: R+60.7 2008: R+52.7
Not yet ingested
- Civics
- —
Market trends
- HPI YoY
- ▲ 12.09%
- Current HPI
- 512.87
- Rent YoY
- ▲ 0.32%
- Metro
- Houston-The Woodlands-Sugar Land, TX
- State GDP YoY
- ▲ 3.95%
- F500 in state
- 110
Industry mix (Fortune 500 HQ in TX)
| Industry | F500 HQs | Revenue |
|---|---|---|
| Energy | 16 | $1,198B |
|
||
| Technology | 5 | $198B |
|
||
| Engineering / Construction | 4 | $72B |
|
||
| Energy Services | 3 | $60B |
|
||
| Utilities | 3 | $41B |
|
||
| Healthcare | 2 | $330B |
|
||
Price history
+0.0% since first listed3 events — show timeline
- 2026-05-06 Listed $275,000 HARMLS
- 2026-05-04 Coming Soon $275,000 HARMLS
- 2000-01-31 Sold (Public Records) — Public Records
Property tax history
+3.1%/yrLatest (2025): $4,214 · -1.7% YoY. Source: county tax records.
Cash-flow waterfall
monthlySold comps — $/sqft
last 12 mo · ≤1 miLoading sold comps…