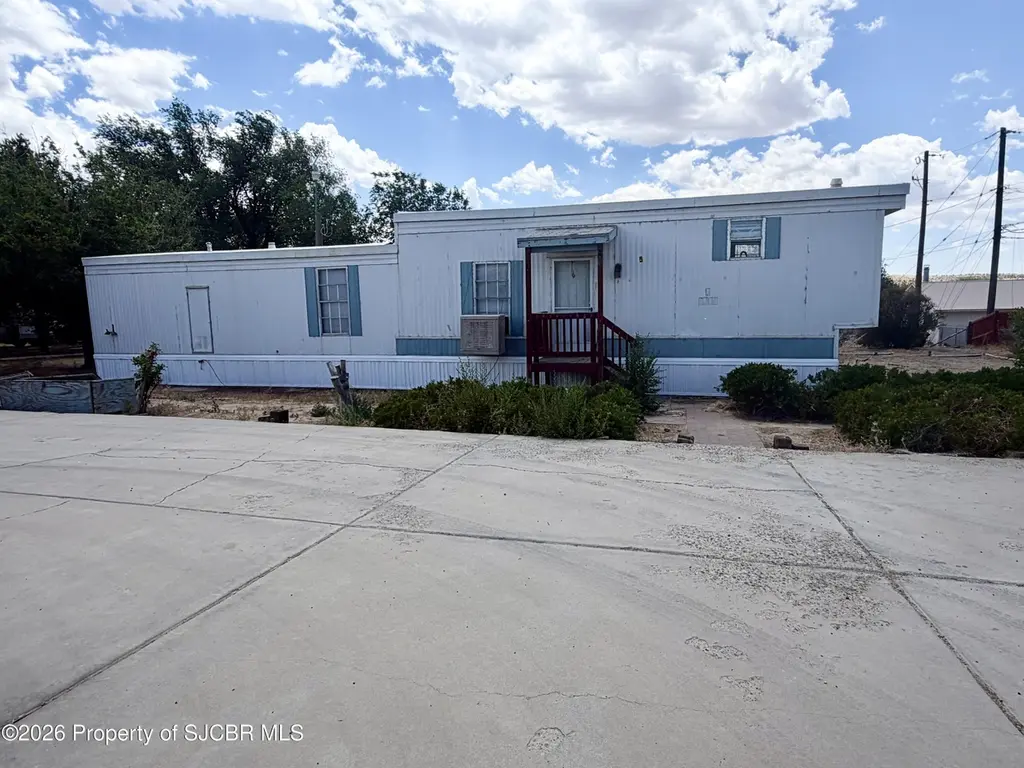
5 Road 5457 · Lee Acres, NM
Flood risk 1/10 · Minimal
- FEMA flood zone
- X (unshaded)
- Chance of flooding over 30 yrs
- 0.0%
- Est. flood insurance / yr
- $507 – $1,088
Fire risk 3/10 · Minor
- Est. fire insurance / yr
- $706 – $1,312
Heat risk 4/10 · Minor
- Hot days now (above 94°F)
- 7 days/yr
- Hot days in 30 yrs
- 18 days/yr
Wind risk 1/10 · Minimal
- Chance of severe wind over 30 yrs
- —
Air-quality risk 2/10 · Minimal
- Unhealthy air days now
- 0 days/yr
- Unhealthy air days in 30 yrs
- 1 days/yr
Risk factors via First Street. Map © Google.
Why this score? — see what drove the B- grade
The composite is a weighted blend of 9 inputs, each scored 0–100. Each bar is that input's sub-score; the figure is the points it added to the 100-point composite (weight × sub-score).
- Cash flow +30.0/30.0
- DSCR +10.0/10.0
- 1% rule +7.9/10.0
- ARV discount +7.5/15.0
- Rent growth +3.8/5.0
- Schools +3.2/10.0
- Livability +2.7/5.0
- Condition / age +2.5/5.0
- Appreciation +0.0/10.0
$85,000
🖨 Deal sheet (PDF) 📄 Offer letter ✓ Due diligence
Listing remarks
Welcome to this cozy and clean 2-bedroom, 1-bath mobile home, perfectly nestled on a spacious 0.38-acre lot. Previously cared for under professional property management, this home has been consistently maintained, giving you peace of mind and a move-in-ready feel from day one. Whether you're searching for an affordable starter home, a slice of land with all utilities already in place, or a smart addition to your investment portfolio, this property checks all the boxes. With its inviting layout and outdoor space, there's room here to live, grow, and create something truly your own. It did have all new skirting placed and a new roof will be installed prior to closing Opportunities like this d
Key facts
- Utilities in place
- Spacious lot
- Outdoor space
Tags
Property features AI
Exterior
- Home design: Single family residential property
- Exterior features: Covered patio/porch; Chain link fencing
Interior
- Bathrooms: 1 full bathroom
- Heating & cooling: Forced air heating; Has heating
- Interior features: Eat-in kitchen
Neighborhood map
What this means for you Summary
Snapshot
- This is a 2-bed/1.0-bath other listed at $85k.
Deal economics
- At list price, monthly cash flow is $365 ($4k/yr) — positive.
- The deal already cash-flows at list — no discount required.
- Meets the 1% rule at list price ($1k rent vs $85k).
Location & tenants
- Location reads 53/100 on livability (#249 in NM) — a working-class tenant base; expect higher turnover. Strengths: cost of living A+, housing A+; Watch: employment D, crime F, amenities F.
- Farmington Municipal Schools (urban): math 23% / reading 43% proficiency, ranked #23 of 95 in NM (top 24%) — families likely to look elsewhere, expect single-tenant / working-renter base with shorter leases.
- Zoned schools: Bluffview Elementary (371 students, 100% FRL); Mesa View Middle School (488 students, 100% FRL); Piedra Vista High (math 27% / reading 52%, grade F, #68 of 110 statewide, top 62%, 1,578 students, 47% FRL) — zoned schools average 82% FRL vs 48% district-wide (35 pts higher); higher-poverty schools than district average — tighter screening recommended.
- Market conditions: Rents rising fast (+5.1%/yr); 238 active listings in the ZIP; 78 units permitted in San Juan County in 2024 (8 in 5+ unit buildings).
Forward outlook
- Local home prices are declining (-3.0%/yr); year-one equity from $588 of loan paydown is wiped out by about $3k of value loss. Plan a longer hold.
- San Juan County population projected at -51% by 2050 — secular population decline; favor cash flow + early exit over multi-decade hold.
- At projected returns (-3.0% appreciation + 5.1% rent growth), your $24k cash investment doubles in ~6 years — after that, you're playing with house money.
Negotiation context
- Only 3 days on market — expect competitive offers; lowballing is unlikely to land.
- 2 sale attempts since 3y ago with the ask held roughly flat each time — persistent listings suggest the price (not the market) is what's stuck; bring a comps-based counter.
Questions for the listing agent
- Is there a deadline driving the sale (1031 exchange, divorce, estate, relocation)? That informs how much negotiation room exists.
- Schools are F-rated, which usually means shorter tenancies and higher turnover. Who's the typical renter profile here, and what's been the actual vacancy rate?
- Crime grade is F in this area — have there been break-ins, vandalism, or insurance claims at this property in the last 3 years? What carrier currently insures it and at what premium?
- What's the average days-on-market for RENTAL listings here right now (not sales)? A rising rental-DOM trend means longer vacancies and softer asking-rent achievability than the comps imply.
- What's the recent tenant-quality profile in this submarket — average credit score on applications, eviction rate, late-payment / NSF rate, and stable-employment percentage? A property-management company in the area should have these aggregated.
- How much new for-sale + rental construction is in the pipeline within 1–3 miles? Heavy new supply typically softens prices + rents 12–24 months out; constrained supply supports both.
Investment metrics
- 1% rule
- 1.29% ✓
- Cap rate
- 11.45%
- Cash-on-cash
- 18.42%
- DSCR
- 1.82
- GRM
- 6.4
CMA / ARV
No comps found within radius.
Projected returns pro-forma
-3.0% appreciation · 5.08% rent growth · sell at horizon
- IRR
- 12.2%
- Equity multiple
- 1.50×
- Total profit
- $11,808
- Equity at exit
- $12,674
- IRR
- 22.6%
- Equity multiple
- 3.11×
- Total profit
- $50,159
- Equity at exit
- $7,349
Cash invested: $23,800 (down + closing). Projections, not guarantees.
Landlord ↔ Tenant lean methodology
- Overall (STATE)
- 55 Moderately Landlord-Leaning
- State New Mexico
- 55 Moderately Landlord-Leaning · D+3
- County
- — inherits STATE
- City
- — inherits STATE
ZIP-level market 87401
- Rents YoY
- 5.1%
- Active inventory
- 238
- Price-to-rent
- 6.4×
Monthly cashflow live
- Estimated rent
- $1,100 medium interval (Pro) →
- Mortgage (P&I)
- −$446
- Tax from tax record
- −$22 /mo · $267/yr
- Insurance
- −$35
- HOA
- −$0
- Vacancy / Maint / Mgmt
- −$231
- Net cashflow
- $365
Break-even live
Sensitivity live
| Price | -10% $413 | -5% $389 | +0% $365 | +5% $341 | +10% $317 |
|---|---|---|---|---|---|
| Rent | -10% $278 | -5% $322 | +0% $365 | +5% $409 | +10% $452 |
| Rate | -1.0pp $408 | -0.5pp $387 | base $365 | +0.5pp $343 | +1.0pp $321 |
UW: 25.0% down · 7.5% · 30yr · 1.5% tax · 5.0% vac · 8.0% maint · 8.0% mgmt
Financing live
Cash to close
- Down payment
- $21,250
- Closing costs
- $2,550
- Reserves months
- —
- Total cash needed
- —
Loan-product check · same deal, 3 products live
Conventional
25% down · 7.5% · 30yr
- Down + closing
- —
- Monthly P&I
- —
- Monthly cashflow
- —
- DSCR
- —
- Eligible?
- —
Personal DTI + credit; lowest rate.
DSCR
20% down · 8.5% · 30yr
- Down + closing
- —
- Monthly P&I
- —
- Monthly cashflow
- —
- DSCR
- —
- Eligible?
- —
No personal income docs; deal must DSCR.
Hard money
10% down · 12.0% · 12mo
- Down + closing
- —
- Monthly P&I
- —
- Monthly cashflow
- —
- DSCR
- —
- Eligible?
- —
Short-term bridge; refi at stabilization.
Listing history 3 events
-
2026-06-13status $85,000 Pending 3 DOM
-
2026-06-12remarks 699-char remark
-
2026-06-12$85,000 Active 3 DOM
ⓘ Source: listings_history table (triggers on properties + properties_extension) + one-shot
backfill from property_details.listing_events for pre-trigger history.
Tax reassessment forecast NM · Resets to sale price
- Current annual tax
- $267 · $22/mo
- Projected year-2 tax
- $680 · $57/mo
- Expected delta
- +$413/yr (+$34/mo · 154.2%)
ⓘ Screening estimate from a state-policy table — verify with the county assessor before closing.
Climate risk First Street
- Flood 1/10 Low FEMA zone X (unshaded) · 0% chance over 30 yrs
- Wildfire 3/10 Moderate
- Heat 4/10 Moderate 7 d/yr ≥94°F today · 18 d/yr by 30 yrs out
- Wind 1/10 Low
- Air quality 2/10 Low 0 unhealthy d/yr today · 1 by 30 yrs out
Nearby sold comps map
Loading sold comps map…
Walkable amenities ~0.75 mi
Loading nearby amenities…
Taxation est. · year 1
- Rental income
- $13,197
- − Mortgage interest
- −$4,761
- − Property taxes
- −$267
- − Insurance
- −$425
- − Repairs & maintenance
- −$1,056
- − Management
- −$1,056
- − Depreciation
- −$2,473
- Taxable income
- $3,159
- Est. tax owed @ 24.0%
- −$758
- After-tax cash flow
- $3,626/yr
For passive investors: Depreciation is non-cash, so a rental often shows a tax loss while cash-flowing — sheltering income. Rental losses are passive: they offset passive income freely, and up to $25,000/yr can offset ordinary (W-2) income if you actively participate and your MAGI is under $100k (phasing out to $0 by $150k); unused losses carry forward. On sale, claimed depreciation is recaptured at up to 25%, and gains may owe capital-gains tax (a 1031 exchange can defer both). Figures are a year-1 estimate at your 24.0% rate — not tax advice; consult a CPA.
Schools (NCES district)
- District
- Farmington Municipal Schools
- NCES district ID
- 3500990
- Math proficiency
- 23% —
- Reading proficiency
- 43% —
- Median HH income
- $51,365
- Composite
- 31.5/100
- National rank
- #11178
- State rank
- #23 of 95 in NM
Livability — Lee Acres
- Score
- 53/100
- State rank
- #249
- US rank
- #24588
Category grades
Schools grade is shown separately in the Schools card above.
Census & demographics
- Census place
- Lee Acres, NM
- County
- San Juan County · 45,229 people
- Metro
- Farmington, NM
- Population (ZIP)
- 45,229
- Household income
- $61,886
- Rent vs Own
- Severe rent burden
- 1190.0
Population outlook (San Juan County) Hauer SSP2
- Today (2025)
- 95,201 people
- By 2030
- 84,154 · -11.6%
- By 2040
- 63,810 · -33.0%
- By 2050
- 46,929 · -50.7%
- By 2075
- 21,097 · -77.8%
- By 2100
- 9,410 · -90.1%
Race, ethnicity, and origin ACS 2023
- Neighborhood character
- Highly diverse neighborhood (Simpson 0.80)
- Race & ethnicity
- White 38% Native American 32% Hispanic / Latino 24% Two or more races 12% Asian 1%
- Hispanic origin (detail)
- Mexican 14%
- Common ancestry
- Lithuanian 2% Slovak 2% Italian 2%
- Foreign-born
- 4% · Canada
- Languages at home
- 72% English-only · Spanish 13%
Political lean MEDSL · San Juan
- 2024 margin
- Solid R (+31.7) · D 33.0% · R 64.7% · Other 2.3%
- 2008→2024 swing
- -10.6pp toward R · 2008: -21.2pp · 2024: -31.7pp
- All cycles
- 2024: R+31.7 2020: R+28.3 2016: R+33.1 2012: R+28.5 2008: R+21.2
Not yet ingested
- Civics
- —
Market trends
- HPI YoY
- ▼ -224.62%
- Current HPI
- 170.162
- Rent YoY
- ▲ 5.08%
- Metro
- Farmington, NM
- State GDP YoY
- —
- F500 in state
- 0
Price history
+8400.0% since first listed4 events — show timeline
- 2026-06-09 Listed $85,000 SJCMLS
- 2024-01-13 Rental Removed $1,100 APPFOLIO
- 2023-12-15 Listed for Rent $1,100 APPFOLIO
- 2022-07-25 Price Changed $1,000 APPFOLIO
Property tax history
+3.5%/yrLatest (2025): $267 · +2.2% YoY. Source: county tax records.
Cash-flow waterfall
monthlySold comps — $/sqft
last 12 mo · ≤1 miLoading sold comps…