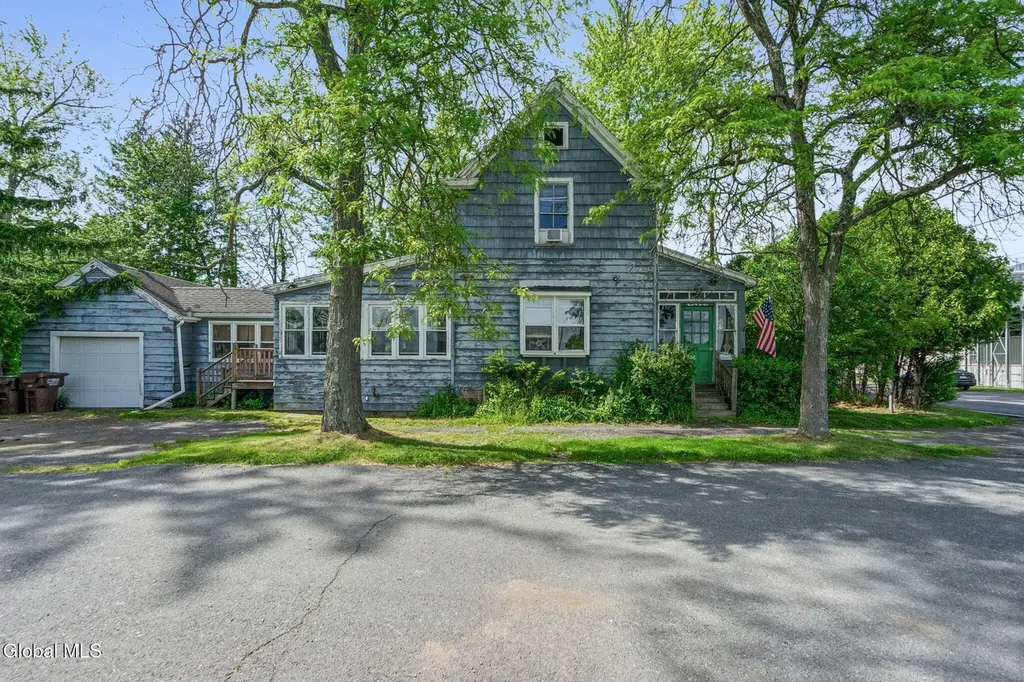
55 Van Dyke Rd · Albany, NY
Flood risk 1/10 · Minimal
- FEMA flood zone
- X (unshaded)
- Chance of flooding over 30 yrs
- 0.0%
- Est. flood insurance / yr
- $473 – $860
Fire risk 3/10 · Minor
- Est. fire insurance / yr
- $691 – $1,283
Heat risk 4/10 · Minor
- Hot days now (above 98°F)
- 7 days/yr
- Hot days in 30 yrs
- 16 days/yr
Wind risk 3/10 · Minor
- Chance of severe wind over 30 yrs
- 7.0%
Air-quality risk 1/10 · Minimal
- Unhealthy air days now
- 0 days/yr
- Unhealthy air days in 30 yrs
- 0 days/yr
Risk factors via First Street. Map © Google.
Why this score? — see what drove the C+ grade
The composite is a weighted blend of 9 inputs, each scored 0–100. Each bar is that input's sub-score; the figure is the points it added to the 100-point composite (weight × sub-score).
- Cash flow +23.3/30.0
- DSCR +7.5/10.0
- ARV discount +7.5/15.0
- 1% rule +6.8/10.0
- Schools +6.5/10.0
- Livability +4.0/5.0
- Rent growth +2.5/5.0
- Condition / age +2.5/5.0
- Appreciation +0.0/10.0
$250,000
🖨 Deal sheet (PDF) 📄 Offer letter ✓ Due diligence
Listing remarks MLS
8 ROOM OLDER HOME W/HIGH CEILINGS, COUNTRY KITCHEN, ENC. FRONT PORCH, BACK BREEZEWAY AND DECK, .65 ACRE PRIVATE BACK YARD. NEAR BCHS W/ATHLETIC FIELDS, TRACK & TENNIS COURTS. COME INSIDE YOU'LL FEEL THE SPACE & LIGHT. TAX * -- Very Good Condition
Key facts
- Delmar location
- Full attic
- Enclosed front porch
Tags
Property features AI
Exterior
- Parking: One garage space; Three parking spaces total; Off-street parking and driveway
- Utilities: Public sewer; Circuit breaker electric; Cable available
- Home design: Single family residence; Fixer condition
- Construction: Wood siding; Asphalt roof
- Exterior features: Deck; Enclosed porch; Front porch; Level lot
Interior
- Kitchen: Range; Range hood; Refrigerator; Dishwasher
- Bedrooms: Primary bedroom (second level); Bedrooms on first and second levels
- Flooring: Wood flooring
- Bathrooms: Two full bathrooms (one on first level, one on second level)
- Heating & cooling: Natural gas heating; Steam heating
- Interior features: High speed internet; Interior entry unfinished basement
- Laundry & utility: Washer; Dryer; Laundry on main level
Neighborhood map
What this means for you Summary
Snapshot
- This is a 4-bed/1.0-bath single-family listed at $250k.
Deal economics
- At list price, monthly cash flow is $460 ($6k/yr) — positive.
- The deal already cash-flows at list — no discount required.
- Meets the 1% rule at list price ($3k rent vs $250k).
- Cap rate 8.5% vs local median 5.7% in Albany — top-decile yield for the area; either an underpriced asset or a hidden risk that comps aren't pricing in. Stress-test before assuming the spread holds.
Location & tenants
- Location reads 79/100 on livability (#129 in NY, #2,083 nationally) — a middle-class / working-renter tenant base. Strengths: amenities A+, commute A+, housing A+; Watch: employment C-, crime F.
- Bethlehem Central School District (suburban): math 70% / reading 74% proficiency, ranked #90 of 590 in NY (top 15%) — strong family-tenant draw, lease renewals of 3-5y typical; only 7% free/reduced lunch — higher-income household profile.
- Zoned schools: Bethlehem Central Senior High School (math 100% / reading 87%, grade A+, #141 of 1,100 statewide, top 13%, 1,364 students, 13% FRL).
- Zoned-school proficiency averages 93% at this address vs 72% district-wide (+21 pts) — the actual schools serving this property are materially stronger than the Bethlehem Central School District average implies; a family-tenant draw the district grade alone would hide.
- Market conditions: 70 active listings in the ZIP; high-income renter base; 675 units permitted in Albany County in 2024 (451 in 5+ unit buildings).
Forward outlook
- Local home prices are declining (-3.0%/yr); year-one equity from $2k of loan paydown is wiped out by about $8k of value loss. Plan a longer hold.
- Albany County population projected at +9% by 2050 — modest demand growth; plan on rents tracking national, not racing it.
Negotiation context
- Only 2 days on market — expect competitive offers; lowballing is unlikely to land.
- 2 sale attempts since 27y ago with the ask held roughly flat each time — persistent listings suggest the price (not the market) is what's stuck; bring a comps-based counter.
- Current owner paid $85k; list at $250k implies a 194% gain — meaningful room to come down on a strong offer.
Risks & watch-outs
- Watch-outs: built in 1907 — expect roof / HVAC / electrical / plumbing capex.
Questions for the listing agent
- Built in 1907 — when were the roof, HVAC, electrical panel, plumbing, and water heater last replaced?
- Is there a deadline driving the sale (1031 exchange, divorce, estate, relocation)? That informs how much negotiation room exists.
- Crime grade is F in this area — have there been break-ins, vandalism, or insurance claims at this property in the last 3 years? What carrier currently insures it and at what premium?
- What's the average days-on-market for RENTAL listings here right now (not sales)? A rising rental-DOM trend means longer vacancies and softer asking-rent achievability than the comps imply.
- What's the recent tenant-quality profile in this submarket — average credit score on applications, eviction rate, late-payment / NSF rate, and stable-employment percentage? A property-management company in the area should have these aggregated.
- How much new for-sale + rental construction is in the pipeline within 1–3 miles? Heavy new supply typically softens prices + rents 12–24 months out; constrained supply supports both.
Investment metrics
- 1% rule
- 1.18% ✓
- Cap rate
- 8.50%
- Cash-on-cash
- 7.88%
- DSCR
- 1.35
- GRM
- 7.1
CMA / ARV
- ARV (on-the-fly)
- $567,276
- Comps found
- 6
Show comp detail 6 sales within ~0.75 mi
| Address | Dist | Beds/Ba | Sqft | Sold | Price | $/sf | Match |
|---|---|---|---|---|---|---|---|
| 44 Grantwood Rd | 0.46mi | 4/3.0 | 2,331 (+1%) | 15mo | $565,000 | $242 | 56 |
| 21 Heather Ln | 0.65mi | 4/2.5 | 2,259 (-2%) | 7mo | $545,000 | $241 | 54 |
| 116 Elm Ave | 0.68mi | 5/3.5 (+1) | 2,307 (0%) | 7mo | $825,000 | $358 | 47 |
| 48 Wakefield Ct | 0.36mi | 4/2.5 | 2,490 (+8%) | 21mo | $440,000 | $177 | 46 |
| 78 Mosher Rd | 0.73mi | 4/2.5 | 2,496 (+8%) | 11mo | $675,000 | $270 | 37 |
| 32 Tierney Dr | 0.64mi | 4/2.5 | 2,542 (+10%) | 24mo | $625,000 | $246 | 27 |
Match score weights: distance 35% · size 25% · config 20% · recency 20%. Top-matched comps best support the ARV.
Projected returns pro-forma
-3.0% appreciation · 3.0% rent growth · sell at horizon
- IRR
- -4.2%
- Equity multiple
- 0.84×
- Total profit
- $-11,102
- Equity at exit
- $37,276
- IRR
- 5.5%
- Equity multiple
- 1.41×
- Total profit
- $28,563
- Equity at exit
- $21,615
Cash invested: $70,000 (down + closing). Projections, not guarantees.
Landlord ↔ Tenant lean methodology
- Overall (STATE)
- 15 Strongly Tenant-Friendly
- State New York
- 15 Strongly Tenant-Friendly · D+10
- County
- — inherits STATE
- City
- — inherits STATE
ZIP-level market 12054
- Active inventory
- 70
- Price-to-rent
- 7.1×
Monthly cashflow live
- Estimated rent
- $2,945 medium interval (Pro) →
- Mortgage (P&I)
- −$1,311
- Tax from tax record
- −$452 /mo · $5,421/yr
- Insurance
- −$104
- HOA
- −$0
- Vacancy / Maint / Mgmt
- −$618
- Net cashflow
- $460
Break-even live
Sensitivity live
| Price | -10% $601 | -5% $530 | +0% $460 | +5% $389 | +10% $318 |
|---|---|---|---|---|---|
| Rent | -10% $227 | -5% $343 | +0% $460 | +5% $576 | +10% $692 |
| Rate | -1.0pp $586 | -0.5pp $523 | base $460 | +0.5pp $395 | +1.0pp $329 |
UW: 25.0% down · 7.5% · 30yr · 1.5% tax · 5.0% vac · 8.0% maint · 8.0% mgmt
Financing live
Cash to close
- Down payment
- $62,500
- Closing costs
- $7,500
- Reserves months
- —
- Total cash needed
- —
Loan-product check · same deal, 3 products live
Conventional
25% down · 7.5% · 30yr
- Down + closing
- —
- Monthly P&I
- —
- Monthly cashflow
- —
- DSCR
- —
- Eligible?
- —
Personal DTI + credit; lowest rate.
DSCR
20% down · 8.5% · 30yr
- Down + closing
- —
- Monthly P&I
- —
- Monthly cashflow
- —
- DSCR
- —
- Eligible?
- —
No personal income docs; deal must DSCR.
Hard money
10% down · 12.0% · 12mo
- Down + closing
- —
- Monthly P&I
- —
- Monthly cashflow
- —
- DSCR
- —
- Eligible?
- —
Short-term bridge; refi at stabilization.
Listing history 3 events
-
2026-06-07statusdays on market $250,000 Pending 2 DOM
-
2026-06-03remarks 695-char remark
-
2026-06-03$250,000 Active 1 DOM
ⓘ Source: listings_history table (triggers on properties + properties_extension) + one-shot
backfill from property_details.listing_events for pre-trigger history.
Tax reassessment forecast NY · Partial reset (capped growth)
- Current annual tax
- $5,421 · $452/mo
- Projected year-2 tax
- $5,421 · $452/mo
- Expected delta
- $0/yr ($0/mo · 0.0%)
ⓘ Screening estimate from a state-policy table — verify with the county assessor before closing.
Climate risk First Street
- Flood 1/10 Low FEMA zone X (unshaded) · 0% chance over 30 yrs
- Wildfire 3/10 Moderate
- Heat 4/10 Moderate 7 d/yr ≥98°F today · 16 d/yr by 30 yrs out
- Wind 3/10 Moderate 7% chance of damaging wind over 30 yrs
- Air quality 1/10 Low 0 unhealthy d/yr today · 0 by 30 yrs out
Nearby sold comps map
Loading sold comps map…
Walkable amenities ~0.75 mi
Loading nearby amenities…
Taxation est. · year 1
- Rental income
- $35,342
- − Mortgage interest
- −$14,004
- − Property taxes
- −$5,421
- − Insurance
- −$1,250
- − Repairs & maintenance
- −$2,827
- − Management
- −$2,827
- − Depreciation
- −$7,273
- Taxable income
- $1,739
- Est. tax owed @ 24.0%
- −$417
- After-tax cash flow
- $5,099/yr
For passive investors: Depreciation is non-cash, so a rental often shows a tax loss while cash-flowing — sheltering income. Rental losses are passive: they offset passive income freely, and up to $25,000/yr can offset ordinary (W-2) income if you actively participate and your MAGI is under $100k (phasing out to $0 by $150k); unused losses carry forward. On sale, claimed depreciation is recaptured at up to 25%, and gains may owe capital-gains tax (a 1031 exchange can defer both). Figures are a year-1 estimate at your 24.0% rate — not tax advice; consult a CPA.
Schools (NCES district)
- District
- Bethlehem Central School District
- NCES district ID
- 3604710
- Math proficiency
- 70% ▼ -8.00%
- Reading proficiency
- 74% ▲ 7.00%
- Median HH income
- $94,967
- Composite
- 65.31/100
- National rank
- #488
- State rank
- #90 of 590 in NY
Livability — Albany
- Score
- 79/100
- State rank
- #129
- US rank
- #2083
Category grades
Schools grade is shown separately in the Schools card above.
Census & demographics
- County
- Albany County · 196,626 people
- City population
- 116,921
- Metro
- Albany-Schenectady-Troy, NY
- Population (ZIP)
- 17,436
- Household income
- $129,583
- Rent vs Own
- Severe rent burden
- 410.0
Population outlook (Albany County) Hauer SSP2
- Today (2025)
- 320,794 people
- By 2030
- 327,401 · +2.1%
- By 2040
- 338,218 · +5.4%
- By 2050
- 348,467 · +8.6%
- By 2075
- 381,693 · +19.0%
- By 2100
- 393,809 · +22.8%
Race, ethnicity, and origin ACS 2023
- Neighborhood character
- Predominantly White (92%)
- Race & ethnicity
- White 92% Two or more races 4% Hispanic / Latino 3% Asian 2%
- Common ancestry
- Romanian 4% Lithuanian 4% Slovak 3%
- Foreign-born
- 5% · Canada, South Korea
- Languages at home
- 94% English-only · Other Asian/Pacific 2% German/W. Germanic 1% Other Indo-European 1%
Political lean MEDSL · Albany
- 2024 margin
- Strong D (+25.8) · D 62.9% · R 37.1%
- 2008→2024 swing
- -3.6pp toward R · 2008: 29.4pp · 2024: 25.8pp
- All cycles
- 2024: D+25.8 2020: D+31.4 2016: D+24.3 2012: D+31.0 2008: D+29.4
Not yet ingested
- Civics
- —
Market trends
- HPI YoY
- ▼ -295.31%
- Current HPI
- 286.6343
- Rent YoY
- —
- Metro
- Albany-Schenectady-Troy, NY
- State GDP YoY
- ▲ 2.60%
- F500 in state
- 92
Industry mix (Fortune 500 HQ in NY)
| Industry | F500 HQs | Revenue |
|---|---|---|
| Financial Services | 10 | $950B |
|
||
| Consumer Goods | 9 | $162B |
|
||
| Insurance | 4 | $225B |
|
||
| Telecommunications | 2 | $144B |
|
||
| Pharmaceuticals | 2 | $112B |
|
||
| Media / Entertainment | 2 | $69B |
|
||
Price history
+178.1% since first listed5 events — show timeline
- 2026-06-03 Listed $250,000 Global MLS
- 2000-06-30 Sold (Public Records) $85,000 Public Records
- 2000-06-30 Sold (MLS) $85,000 Global MLS
- 2000-05-19 Listing Removed — Global MLS
- 1999-09-27 Listed $89,900 Global MLS
Property tax history
-1.3%/yrLatest (2025): $5,421 · +1.9% YoY. Source: county tax records.
Cash-flow waterfall
monthlySold comps — $/sqft
last 12 mo · ≤1 miLoading sold comps…