 🌊 Lakefront
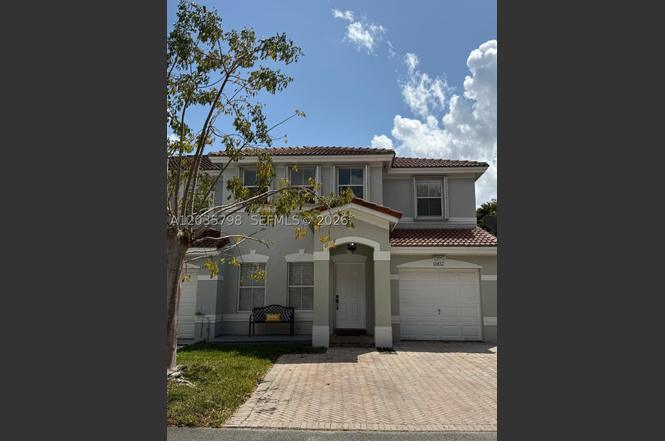
16432 SW 47th Ter · Kendall West, FL
Flood risk 1/10 · Minimal
- FEMA flood zone
- X (unshaded)
- Chance of flooding over 30 yrs
- 0.0%
- Est. flood insurance / yr
- $507 – $1,088
Fire risk 8/10 · Major
- Est. fire insurance / yr
- $947 – $1,759
Heat risk 10/10 · Severe
- Hot days now (above 106°F)
- 7 days/yr
- Hot days in 30 yrs
- 27 days/yr
Wind risk 10/10 · Severe
- Chance of severe wind over 30 yrs
- 99.0%
Air-quality risk 2/10 · Minimal
- Unhealthy air days now
- 1 days/yr
- Unhealthy air days in 30 yrs
- 1 days/yr
Risk factors via First Street. Map © Google.
Why this score? — see what drove the D+ grade
The composite is a weighted blend of 9 inputs, each scored 0–100. Each bar is that input's sub-score; the figure is the points it added to the 100-point composite (weight × sub-score).
- ARV discount +15.0/15.0
- Cash flow +7.6/30.0
- Appreciation +5.4/10.0
- Schools +4.2/10.0
- Rent growth +3.8/5.0
- Livability +3.8/5.0
- Condition / age +2.5/5.0
- 1% rule +2.1/10.0
- DSCR +1.7/10.0
$560,000
🖨 Deal sheet (PDF) 📄 Offer letter ✓ Due diligence
Listing remarks
Fully renovated lakefront townhouse featuring 3 bedrooms, 2.5 bathrooms, and a versatile den that can be used as a home office, playroom, or guest space. Enjoy outdoor living on the spacious backyard and covered terrace, perfect for entertaining or taking in the tranquil waterfront views. The home includes a one-car garage and is situated within a peaceful, secure community.
Key facts
- Lakefront townhouse
- Versatile den
- Spacious backyard
Tags
Property features AI
Finance
- Financial info: Pets allowed
- HOA & community: Monthly association fee (includes grounds and structure maintenance, security, and trash); Community clubhouse
Exterior
- Parking: Attached covered garage; 1 garage space; Guest parking; Two or more parking spaces
- Security: Complex fenced
- Utilities: Waterfront utilities available
- Home design: 2-story property; Entry level is 1; Property has attached units
- Construction: Block construction; Effective year built
- Exterior features: Awning(s); Fence; Patio; Storm/security shutters; Lakefront waterfront; Has a view; Faces southwest
Interior
- Kitchen: Electric range; Microwave; Dishwasher; Refrigerator
- Bedrooms: Primary bedroom located on the upper level
- Flooring: Vinyl flooring
- Bathrooms: 2 full bathrooms; 1 half bathroom
- Heating & cooling: Central heating; Central air conditioning
- Interior features: Blinds on windows; Entrance foyer; First-floor entry; Living/dining room; Upper-level primary bedroom; Vaulted ceilings; Den
- Laundry & utility: Washer; Dryer
Neighborhood map
What this means for you Summary
Snapshot
- This is a 3-bed/2.0-bath townhouse listed at $560k.
Deal economics
- At list price, monthly cash flow is $-675 ($-8k/yr) — negative.
- To cash-flow at today's rent, offer at most $441k (21.3% below list).
- To meet the 1% rule (rent ≥ 1% of price), the offer needs to be $399k (28.8% below list).
- Recommended offer: $399k (28.8% below list) — sets the bar for 1% rule.
- Cap rate 4.8% vs local median 3.5% in Kendall West — top-decile yield for the area; either an underpriced asset or a hidden risk that comps aren't pricing in. Stress-test before assuming the spread holds.
Location & tenants
- Location reads 75/100 on livability (#255 in FL, #4,028 nationally) — a middle-class / working-renter tenant base. Strengths: housing A+, health & safety A+, crime A-; Watch: amenities F.
- Miami-Dade (suburban): math 45% / reading 54% proficiency, ranked #40 of 73 in FL (top 55%) — families likely to look elsewhere, expect single-tenant / working-renter base with shorter leases; 64% free/reduced lunch — lower-income household profile, screen leases tightly.
- Zoned schools: Dr. Manuel C. Barreiro Elementary School (math 64% / reading 72%, grade B+, #425 of 2,144 statewide, top 20%, 612 students, 50% FRL); Lamar Louise Curry Middle School (math 51% / reading 63%, grade B, #164 of 571 statewide, top 30%, 804 students, 50% FRL); John A. Ferguson Senior High (math 36% / reading 64%, grade D+, #175 of 667 statewide, top 27%, 4,368 students, 49% FRL).
- Market conditions: Rents rising fast (+5.4%/yr); 134 active listings in the ZIP; 40 comparable units currently listed for rent nearby; rentals at typical pace (median 26d on market — plan ~3-4 weeks tenant-placement turnaround); high-income renter base; 10,051 units permitted in Miami-Dade County in 2024 (7,758 in 5+ unit buildings).
- This rent runs 42% of the median local income ($114k/yr) — at the standard rent-burdened threshold; future hikes will face affordability resistance.
Forward outlook
- In year one you build about $8k of equity ($4k loan paydown + $4k appreciation (0.8% local appreciation)).
- Miami-Dade County population projected at +28% by 2050 — long-run rental-demand tailwind backs the buy-and-hold thesis.
- By year 5, paydown + projected appreciation supports a ~$40k cash-out refi (75% LTV) — recoverable capital for the next deal without selling this one.
Negotiation context
- Only 9 days on market — expect competitive offers; lowballing is unlikely to land.
- 3 sale attempts since 3y ago with the ask held roughly flat each time — persistent listings suggest the price (not the market) is what's stuck; bring a comps-based counter.
Risks & watch-outs
- Climate carrying-cost: severe wind risk, 99% chance of damaging wind over 30y; severe wildfire risk; extreme-heat days projected 7→27/yr by 2055 (HVAC capex compounding) — expect insurance premiums to compound above CPI over the hold.
Questions for the listing agent
- What do current leases actually rent for vs. the listed asking? Can we see a recent rent roll and the last 12 months of T-12 income?
- Is there a deadline driving the sale (1031 exchange, divorce, estate, relocation)? That informs how much negotiation room exists.
- The area grade is low — what's the realistic commute time and amenity access for the typical tenant pool here? Any planned neighborhood developments (good or bad) we should know about?
- This sits on a lake — are riparian / water-frontage rights deeded with the parcel? Any dock permits, shoreline easements, or HOA water-use restrictions?
- What's the documented flood / surge / shoreline-erosion history here (FEMA AND non-FEMA — e.g., storm surge, creek backup, septic-field saturation)?
- Any water-quality or seasonal algae-bloom issues that affect tenant satisfaction or short-term-rental demand?
- What's the average days-on-market for RENTAL listings here right now (not sales)? A rising rental-DOM trend means longer vacancies and softer asking-rent achievability than the comps imply.
- What's the recent tenant-quality profile in this submarket — average credit score on applications, eviction rate, late-payment / NSF rate, and stable-employment percentage? A property-management company in the area should have these aggregated.
- How much new for-sale + rental construction is in the pipeline within 1–3 miles? Heavy new supply typically softens prices + rents 12–24 months out; constrained supply supports both.
Investment metrics
- 1% rule
- 0.71% ✗
- Cap rate
- 4.85%
- Cash-on-cash
- -5.16%
- DSCR
- 0.77
- GRM
- 11.7
CMA / ARV
- ARV (on-the-fly)
- $740,730
- Comps found
- 2
Show comp detail 2 sales within ~0.75 mi
| Address | Dist | Beds/Ba | Sqft | Sold | Price | $/sf | Match |
|---|---|---|---|---|---|---|---|
| 16226 SW 57th Ln | 0.63mi | 4/2.5 (+1) | 1,823 (+4%) | 12mo | $550,000 | $302 | 47 |
| 5938 SW 163rd Ave | 0.70mi | 4/3.0 (+1) | 1,756 (+0%) | 22mo | $550,000 | $313 | 40 |
Match score weights: distance 35% · size 25% · config 20% · recency 20%. Top-matched comps best support the ARV.
Projected returns pro-forma
0.8% appreciation · 5.36% rent growth · sell at horizon
- IRR
- -3.6%
- Equity multiple
- 0.82×
- Total profit
- $-28,234
- Equity at exit
- $185,368
- IRR
- 3.1%
- Equity multiple
- 1.39×
- Total profit
- $60,449
- Equity at exit
- $241,909
Cash invested: $156,800 (down + closing). Projections, not guarantees.
Landlord ↔ Tenant lean methodology
- Overall (STATE)
- 87 Strongly Landlord-Friendly
- State Florida
- 87 Strongly Landlord-Friendly · R+3
- County
- — inherits STATE
- City
- — inherits STATE
ZIP-level market 33185
- Home prices YoY
- 0.1%
- Rents YoY
- 5.4%
- Active inventory
- 134
- Price-to-rent
- 11.7×
Monthly cashflow live
- Estimated rent
- $3,988 high interval (Pro) →
- Mortgage (P&I)
- −$2,937
- Tax from tax record
- −$655 /mo · $7,860/yr
- Insurance
- −$233
- HOA
- −$0
- Vacancy / Maint / Mgmt
- −$837
- Net cashflow
- $-675
Break-even live
Sensitivity live
| Price | -10% $-358 | -5% $-516 | +0% $-675 | +5% $-833 | +10% $-992 |
|---|---|---|---|---|---|
| Rent | -10% $-990 | -5% $-832 | +0% $-675 | +5% $-517 | +10% $-360 |
| Rate | -1.0pp $-393 | -0.5pp $-532 | base $-675 | +0.5pp $-820 | +1.0pp $-967 |
UW: 25.0% down · 7.5% · 30yr · 1.5% tax · 5.0% vac · 8.0% maint · 8.0% mgmt
Financing live
Cash to close
- Down payment
- $140,000
- Closing costs
- $16,800
- Reserves months
- —
- Total cash needed
- —
Loan-product check · same deal, 3 products live
Conventional
25% down · 7.5% · 30yr
- Down + closing
- —
- Monthly P&I
- —
- Monthly cashflow
- —
- DSCR
- —
- Eligible?
- —
Personal DTI + credit; lowest rate.
DSCR
20% down · 8.5% · 30yr
- Down + closing
- —
- Monthly P&I
- —
- Monthly cashflow
- —
- DSCR
- —
- Eligible?
- —
No personal income docs; deal must DSCR.
Hard money
10% down · 12.0% · 12mo
- Down + closing
- —
- Monthly P&I
- —
- Monthly cashflow
- —
- DSCR
- —
- Eligible?
- —
Short-term bridge; refi at stabilization.
Rent comps 40 comps
| Address | Beds | Baths | Sqft | Rent | $/sqft | DOM | Units | Dist |
|---|---|---|---|---|---|---|---|---|
| 16432 SW 47th Ter Unit 16432 Miami, FL | 3.0 | 2.5 | 1753 | $3,600 | $2.05 | 26d | 1 | 0.03mi |
| 16432 SW 47th Ter Miami, FL | 3.0 | 2.5 | 1753 | $3,700 | $2.11 | 26d | 1 | 0.03mi |
| 16355 SW 46th Ter Miami, FL | 3.0 | 2.0 | 1525 | $3,550 | $2.33 | 3d | 1 | 0.07mi |
| 16355 SW 46th Ter Unit 16355 Miami, FL | 3.0 | 2.0 | 1525 | $3,550 | $2.33 | 4d | 1 | 0.07mi |
| 16336 SW 48th Ter Unit 16336 Miami, FL | 4.0 | 3.0 | 1846 | $3,900 | $2.11 | 22d | 1 | 0.11mi |
| 16336 SW 48th Ter Unit 16336 Miami, FL | 4.0 | 3.0 | 1846 | $3,800 | $2.06 | 0d | 1 | 0.11mi |
| 16336 SW 48th Ter Miami, FL | 4.0 | 3.0 | 1846 | $3,900 | $2.11 | 20d | 1 | 0.11mi |
| 4604 SW 164th Pl Miami, FL | 3.0 | 2.0 | 1472 | $3,300 | $2.24 | 26d | 1 | 0.14mi |
| 4452 SW 163rd Ct Unit 4452 Miami, FL | 4.0 | 2.0 | 1490 | $3,450 | $2.32 | 15d | 1 | 0.20mi |
| 16628 SW 47th Ter Miami, FL | 3.0 | 2.5 | 1753 | $3,400 | $1.94 | 18d | 1 | 0.23mi |
| 16628 SW 47th Ter Miami, FL | 3.0 | 2.5 | 1753 | $3,400 | $1.94 | 3d | 1 | 0.23mi |
| 4760 SW 166th Ct Miami, FL | 3.0 | 2.0 | 1327 | $2,900 | $2.19 | 26d | 1 | 0.26mi |
| 16303 SW 44th Ter Unit 16303 Miami, FL | 3.0 | 2.5 | 1400 | $3,300 | $2.36 | 9d | 1 | 0.28mi |
| 16479 SW 53rd St Miami, FL | 4.0 | 2.0 | 1953 | $4,500 | $2.30 | 26d | 1 | 0.29mi |
| 5282 SW 164th Pl Miami, FL | 4.0 | 2.0 | 1865 | $3,999 | $2.14 | 26d | 1 | 0.31mi |
| 16061 SW 45th Ter Unit 16061 Miami, FL | 4.0 | 3.0 | 2554 | $4,200 | $1.64 | 26d | 1 | 0.33mi |
| 16266 SW 54th Ter Miami, FL | 4.0 | 2.0 | 1708 | $3,700 | $2.17 | 13d | 1 | 0.41mi |
| 16266 SW 54th Ter Miami, FL | 4.0 | 2.0 | 1708 | $3,700 | $2.17 | 26d | 1 | 0.41mi |
| 16266 SW 54th Ter Miami, FL | 4.0 | 2.0 | 1708 | $3,700 | $2.17 | 18d | 1 | 0.41mi |
| 16568 SW 54th St Miami, FL | 4.0 | 3.0 | 2280 | $4,200 | $1.84 | 26d | 1 | 0.42mi |
| 4451 SW 159th Path Unit NA Miami, FL | 4.0 | 3.5 | 2306 | $5,900 | $2.56 | 23d | 1 | 0.44mi |
| 5060 SW 159th Ave Miami, FL | 3.0 | 2.5 | 1717 | $3,600 | $2.10 | 0d | 1 | 0.50mi |
| 5060 SW 159th Ave Miami, FL | 3.0 | 2.5 | 1717 | $3,600 | $2.10 | 26d | 1 | 0.50mi |
| 16001 SW 43rd Ter Miami, FL | 4.0 | 2.5 | 2552 | $5,200 | $2.04 | 21d | 1 | 0.51mi |
| 16001 SW 43rd Ter Miami, FL | 4.0 | 2.5 | 2552 | $5,200 | $2.04 | 12d | 1 | 0.51mi |
| 16001 SW 43rd Ter Unit 16001 Miami, FL | 4.0 | 2.5 | 2552 | $5,200 | $2.04 | 4d | 1 | 0.51mi |
| 16001 SW 43rd Ter Unit 16001 Miami, FL | 4.0 | 2.5 | 2552 | $5,200 | $2.04 | 16d | 1 | 0.51mi |
| 16550 SW 42nd Ter #16550 Miami, FL | 4.0 | 3.5 | 2025 | $3,750 | $1.85 | 26d | 1 | 0.53mi |
| 5776 SW 166th Ct Miami, FL | 4.0 | 3.0 | 2476 | $4,000 | $1.62 | 0d | 1 | 0.64mi |
| 5776 SW 166th Ct Miami, FL | 4.0 | 3.0 | 2476 | $4,000 | $1.62 | 26d | 1 | 0.64mi |
| 15873 SW 43rd St Miami, FL | 4.0 | 2.5 | 1851 | $3,900 | $2.11 | 26d | 1 | 0.66mi |
| 15716 SW 43rd St Miami, FL | 4.0 | 2.0 | 2039 | $3,800 | $1.86 | 26d | 1 | 0.79mi |
| 4671 SW 155th Pl Miami, FL | 4.0 | 3.0 | 2060 | $4,600 | $2.23 | 26d | 1 | 0.87mi |
| 15481 SW 47th Ter Unit 15481 Miami, FL | 3.0 | 3.0 | 2000 | $5,900 | $2.95 | 26d | 1 | 0.93mi |
| 4128 SW 156th Ct Miami, FL | 3.0 | 1.0 | 1819 | $4,000 | $2.20 | 26d | 1 | 0.94mi |
| 4128 SW 156th Ct Unit NA Miami, FL | 3.0 | 1.0 | 1819 | $4,000 | $2.20 | 9d | 1 | 0.94mi |
| 15428 SW 50th Ter Miami, FL | 3.0 | 3.0 | 1895 | $4,500 | $2.37 | 23d | 1 | 0.95mi |
| 6352 SW 164th Path Miami, FL | 4.0 | 2.5 | 1665 | $3,100 | $1.86 | 26d | 1 | 0.95mi |
| 4668 SW 153rd Ct Miami, FL | 3.0 | 2.5 | 1815 | $4,000 | $2.20 | 26d | 1 | 1.04mi |
| 16012 SW 64th Ter Miami, FL | 4.0 | 2.0 | 1862 | $4,150 | $2.23 | 26d | 1 | 1.09mi |
Listing history 7 events
-
2026-06-21days on market $560,000 Active 9 DOM
-
2026-06-18days on market $560,000 Active 6 DOM
-
2026-06-17days on market $560,000 Active 5 DOM
-
2026-06-16days on market $560,000 Active 4 DOM
-
2026-06-15days on market $560,000 Active 3 DOM
-
2026-06-13remarks 377-char remark
-
2026-06-13$560,000 Active 1 DOM
ⓘ Source: listings_history table (triggers on properties + properties_extension) + one-shot
backfill from property_details.listing_events for pre-trigger history.
Tax reassessment forecast FL · Resets to sale price
- Current annual tax
- $7,860 · $655/mo
- Projected year-2 tax
- $7,860 · $655/mo
- Expected delta
- $0/yr ($0/mo · 0.0%)
ⓘ Screening estimate from a state-policy table — verify with the county assessor before closing.
Climate risk First Street
- Flood 1/10 Low FEMA zone X (unshaded) · 0% chance over 30 yrs
- Wildfire 8/10 Severe
- Heat 10/10 Extreme 7 d/yr ≥106°F today · 27 d/yr by 30 yrs out
- Wind 10/10 Extreme 99% chance of damaging wind over 30 yrs
- Air quality 2/10 Low 1 unhealthy d/yr today · 1 by 30 yrs out
Nearby sold comps map
Loading sold comps map…
Walkable amenities ~0.75 mi
Loading nearby amenities…
Taxation est. · year 1
- Rental income
- $47,853
- − Mortgage interest
- −$31,369
- − Property taxes
- −$7,860
- − Insurance
- −$2,800
- − Repairs & maintenance
- −$3,828
- − Management
- −$3,828
- − Depreciation
- −$16,291
- Taxable loss
- −$18,123
- Est. tax savings @ 24.0%
- +$4,350
- After-tax cash flow
- $-3,747/yr
For passive investors: Depreciation is non-cash, so a rental often shows a tax loss while cash-flowing — sheltering income. Rental losses are passive: they offset passive income freely, and up to $25,000/yr can offset ordinary (W-2) income if you actively participate and your MAGI is under $100k (phasing out to $0 by $150k); unused losses carry forward. On sale, claimed depreciation is recaptured at up to 25%, and gains may owe capital-gains tax (a 1031 exchange can defer both). Figures are a year-1 estimate at your 24.0% rate — not tax advice; consult a CPA.
Schools (NCES district)
- District
- Miami-Dade
- NCES district ID
- 1200390
- Math proficiency
- 45% ▼ -16.00%
- Reading proficiency
- 54% ▼ -5.00%
- Median HH income
- $43,928
- Composite
- 41.76/100
- National rank
- #3397
- State rank
- #40 of 73 in FL
Livability — Kendall West
- Score
- 75/100
- State rank
- #255
- US rank
- #4028
Category grades
Schools grade is shown separately in the Schools card above.
Census & demographics
- County
- Miami-Dade County · 2,697,751 people
- Metro
- Miami-Fort Lauderdale-Pompano Beach, FL
- Population (ZIP)
- 28,555
- Household income
- $114,206
- Rent vs Own
- Severe rent burden
- 396.0
Population outlook (Miami-Dade County) Hauer SSP2
- Today (2025)
- 3,126,439 people
- By 2030
- 3,325,765 · +6.4%
- By 2040
- 3,697,561 · +18.3%
- By 2050
- 4,012,134 · +28.3%
- By 2075
- 4,605,612 · +47.3%
- By 2100
- 4,866,598 · +55.7%
Race, ethnicity, and origin ACS 2023
- Neighborhood character
- Predominantly Hispanic (84%)
- Race & ethnicity
- Hispanic / Latino 84% Two or more races 45% White 11% Asian 3%
- Hispanic origin (detail)
- Puerto Rican 4% Cuban 52% Dominican 2%
- Common ancestry
- Lithuanian 1% Russian 1%
- Foreign-born
- 54% · Canada, Jamaica, Dominican Republic
- Languages at home
- 13% English-only · Spanish 82% Other Indo-European 2% Chinese 1%
Political lean MEDSL · Miami-Dade
- 2024 margin
- R (+11.4) · D 43.9% · R 55.4%
- 2008→2024 swing
- -27.6pp toward R · 2008: 16.1pp · 2024: -11.4pp
- All cycles
- 2024: R+11.4 2020: D+7.3 2016: D+29.6 2012: D+23.7 2008: D+16.1
Not yet ingested
- Civics
- —
Market trends
- HPI YoY
- ▲ 0.80%
- Current HPI
- 572.21
- Rent YoY
- ▲ 5.36%
- Metro
- Miami-Fort Lauderdale-Pompano Beach, FL
- State GDP YoY
- ▲ 3.28%
- F500 in state
- 36
Industry mix (Fortune 500 HQ in FL)
| Industry | F500 HQs | Revenue |
|---|---|---|
| Industrial Technology | 2 | $29B |
|
||
| Insurance | 2 | $17B |
|
||
| Retail | 1 | $60B |
|
||
| Technology Distribution | 1 | $58B |
|
||
| Homebuilding | 1 | $35B |
|
||
| Technology Manufacturing | 1 | $35B |
|
||
Price history
+16370.6% since first listed5 events — show timeline
- 2026-06-12 Listed $560,000 MARMLS
- 2026-04-21 Price Changed $3,700 MARMLS
- 2026-03-28 Listed for Rent $3,900 MARMLS
- 2023-09-11 Rental Removed $3,400 MARMLS
- 2023-08-17 Listed for Rent $3,400 MARMLS
Property tax history
+6.7%/yrLatest (2025): $7,860 · +5.1% YoY. Source: county tax records.
Cash-flow waterfall
monthlySold comps — $/sqft
last 12 mo · ≤1 miLoading sold comps…