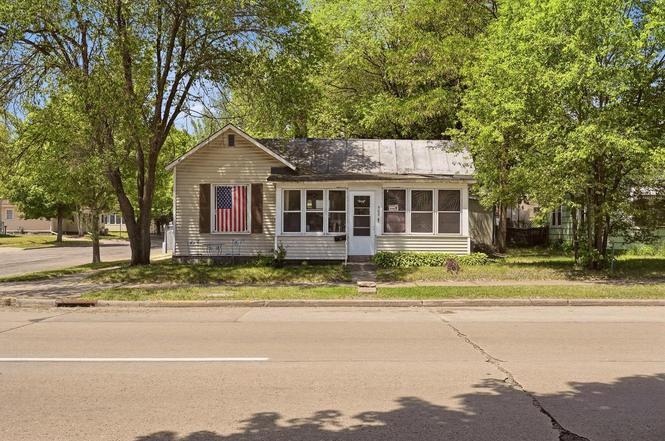
303 Rose St · La Crosse, WI
Flood risk 4/10 · Minor
- FEMA flood zone
- X (shaded)
- Chance of flooding over 30 yrs
- 0.24%
- Est. flood insurance / yr
- $507 – $1,088
Fire risk 1/10 · Minimal
- Est. fire insurance / yr
- $636 – $1,182
Heat risk 2/10 · Minimal
- Hot days now (above 100°F)
- 7 days/yr
- Hot days in 30 yrs
- 14 days/yr
Wind risk 2/10 · Minimal
- Chance of severe wind over 30 yrs
- —
Air-quality risk 1/10 · Minimal
- Unhealthy air days now
- 0 days/yr
- Unhealthy air days in 30 yrs
- 0 days/yr
Risk factors via First Street. Map © Google.
Why this score? — see what drove the C+ grade
The composite is a weighted blend of 9 inputs, each scored 0–100. Each bar is that input's sub-score; the figure is the points it added to the 100-point composite (weight × sub-score).
- Cash flow +27.7/30.0
- DSCR +9.8/10.0
- ARV discount +7.5/15.0
- 1% rule +7.4/10.0
- Livability +3.5/5.0
- Schools +2.7/10.0
- Rent growth +2.5/5.0
- Condition / age +2.5/5.0
- Appreciation +0.0/10.0
$115,000
🖨 Deal sheet 📄 Offer letter ✓ Due diligence
Listing remarks MLS
Great opportunity to add to your investment portfolio or make improvements and build equity with this 1-story home conveniently located on Car and Rose Streets, just a short drive to Festival Foods and downtown La Crosse! Highly functional floor plan with 9-foot ceiling, hardwood floors, large kitchen (12 x15) with room to add a breakfast bar, & large master bedroom (17 x 11) w/ walk-in closet (8 x 3)! Add instant value by remodeling the kitchen, replacing the bathroom & refinishing floors! Off-street parking for 2 cars behind house. Walls professionally painted and in great condition. 2nd bedroom does not have a closet. Large front porch and storage shed behind home. 2 windows recently replaced.
Key facts
- 2,613 sq ft lot
- Parking
- Built 1901
Neighborhood map
What this means for you Summary
Snapshot
- This is a 2-bed/1.0-bath other listed at $115k.
Deal economics
- At list price, monthly cash flow is $349 ($4k/yr) — positive.
- The deal already cash-flows at list — no discount required.
- Meets the 1% rule at list price ($1k rent vs $115k).
- Cap rate 9.9% vs local median 3.0% in La Crosse — top-decile yield for the area; either an underpriced asset or a hidden risk that comps aren't pricing in. Stress-test before assuming the spread holds.
Location & tenants
- Location reads 69/100 on livability (#339 in WI) — a middle-class / working-renter tenant base. Strengths: cost of living A+, housing A+; Watch: employment C-, schools D+, health & safety D.
- La Crosse School District (urban): math 29% / reading 34% proficiency, ranked #267 of 342 in WI (top 78%) — families likely to look elsewhere, expect single-tenant / working-renter base with shorter leases.
- Market conditions: 59 active listings in the ZIP; 7 comparable units currently listed for rent nearby; rentals lingering (median 44d on market — plan ~5-8 weeks vacancy on turnover, expect pricing pressure); 100% of comp listings sitting > 30 days — soft ceiling on asking rent; 268 units permitted in La Crosse County in 2024 (10 in 5+ unit buildings).
- This rent runs 33% of the median local income ($52k/yr) — at the standard rent-burdened threshold; future hikes will face affordability resistance.
Forward outlook
- Local home prices are declining (-3.0%/yr); year-one equity from $795 of loan paydown is wiped out by about $3k of value loss. Plan a longer hold.
- La Crosse County population projected at +14% by 2050 — modest demand growth; plan on rents tracking national, not racing it.
- At projected returns (-3.0% appreciation + 3.0% rent growth), your $32k cash investment doubles in ~9 years — after that, you're playing with house money.
Negotiation context
- Only 0 days on market — expect competitive offers; lowballing is unlikely to land.
- 8 sale attempts since 13y ago with the ask held roughly flat each time — persistent listings suggest the price (not the market) is what's stuck; bring a comps-based counter.
- Current owner paid $74k; list at $115k implies a 56% gain — meaningful room to come down on a strong offer.
Risks & watch-outs
- Watch-outs: built in 1901 — expect roof / HVAC / electrical / plumbing capex.
Questions for the listing agent
- Built in 1901 — when were the roof, HVAC, electrical panel, plumbing, and water heater last replaced?
- Is there a deadline driving the sale (1031 exchange, divorce, estate, relocation)? That informs how much negotiation room exists.
- Schools are D-rated, which usually means shorter tenancies and higher turnover. Who's the typical renter profile here, and what's been the actual vacancy rate?
- Crime grade is F in this area — have there been break-ins, vandalism, or insurance claims at this property in the last 3 years? What carrier currently insures it and at what premium?
- What's the average days-on-market for RENTAL listings here right now (not sales)? A rising rental-DOM trend means longer vacancies and softer asking-rent achievability than the comps imply.
- What's the recent tenant-quality profile in this submarket — average credit score on applications, eviction rate, late-payment / NSF rate, and stable-employment percentage? A property-management company in the area should have these aggregated.
- How much new for-sale + rental construction is in the pipeline within 1–3 miles? Heavy new supply typically softens prices + rents 12–24 months out; constrained supply supports both.
Investment metrics
- 1% rule
- 1.24% ✓
- Cap rate
- 9.93%
- Cash-on-cash
- 12.99%
- DSCR
- 1.58
- GRM
- 6.7
CMA / ARV
No comps found within radius.
Projected returns pro-forma
-3.0% appreciation · 3.0% rent growth · sell at horizon
- IRR
- 2.9%
- Equity multiple
- 1.11×
- Total profit
- $3,586
- Equity at exit
- $17,147
- IRR
- 12.5%
- Equity multiple
- 1.99×
- Total profit
- $31,775
- Equity at exit
- $9,943
Cash invested: $32,200 (down + closing). Projections, not guarantees.
Landlord ↔ Tenant lean methodology
- Overall (STATE)
- 73 Landlord-Friendly
- State Wisconsin
- 73 Landlord-Friendly · R+2
- County
- — inherits STATE
- City
- — inherits STATE
ZIP-level market 54603
- Active inventory
- 59
- Price-to-rent
- 6.7×
Monthly cashflow live
- Estimated rent
- $1,431 high interval (Pro) →
- Mortgage (P&I)
- −$603
- Tax from tax record
- −$131 /mo · $1,574/yr
- Insurance
- −$48
- HOA
- −$0
- Vacancy / Maint / Mgmt
- −$301
- Net cashflow
- $349
Break-even live
UW: 25.0% down · 7.5% · 30yr · 1.5% tax · 5.0% vac · 8.0% maint · 8.0% mgmt
Financing live
Cash to close
- Down payment
- $28,750
- Closing costs
- $3,450
- Reserves months
- —
- Total cash needed
- —
Loan-product check · same deal, 3 products live
Conventional
25% down · 7.5% · 30yr
- Down + closing
- —
- Monthly P&I
- —
- Monthly cashflow
- —
- DSCR
- —
- Eligible?
- —
Personal DTI + credit; lowest rate.
DSCR
20% down · 8.5% · 30yr
- Down + closing
- —
- Monthly P&I
- —
- Monthly cashflow
- —
- DSCR
- —
- Eligible?
- —
No personal income docs; deal must DSCR.
Hard money
10% down · 12.0% · 12mo
- Down + closing
- —
- Monthly P&I
- —
- Monthly cashflow
- —
- DSCR
- —
- Eligible?
- —
Short-term bridge; refi at stabilization.
Rent comps 7 comps
| Address | Beds | Baths | Sqft | Rent | $/sqft | DOM | Units | Dist |
|---|---|---|---|---|---|---|---|---|
| 55 River Bend Rd Unit 509 La Crosse, WI | 1.0 | 1.0 | 736 | $1,525 | $2.07 | 43d | 1 | 0.55mi |
| 55 River Bend Rd Unit 610 La Crosse, WI | 1.0 | 1.0 | 803 | $1,700 | $2.12 | 43d | 1 | 0.55mi |
| 55 River Bend Rd Unit 304 La Crosse, WI | 1.0 | 1.0 | 1017 | $2,100 | $2.06 | 43d | 1 | 0.55mi |
| 27 Riverpoint Ct La Crosse, WI | 1.0 | 1.0 | 692 | $1,488 | $2.15 | 43d | 21 | 0.57mi |
| 1346 George St #1348 La Crosse, WI | 3.0 | 1.0 | 1080 | $995 | $0.92 | 43d | 1 | 0.98mi |
| 1642 Bainbridge St Apt 23 La Crosse, WI | 2.0 | 1.0 | 710 | $1,350 | $1.90 | 43d | 1 | 1.37mi |
| 816 Cass St Apt 103 La Crosse, WI | 1.0 | 1.0 | 538 | $895 | $1.66 | 43d | 1 | 1.49mi |
Listing history 2 events
-
2026-06-13remarks 308-char remark
-
2026-06-13$115,000 Pending
ⓘ Source: listings_history table (triggers on properties + properties_extension) + one-shot
backfill from property_details.listing_events for pre-trigger history.
Tax reassessment forecast WI · Partial reset (capped growth)
- Current annual tax
- $1,574 · $131/mo
- Projected year-2 tax
- $1,851 · $154/mo
- Expected delta
- +$277/yr (+$23/mo · 17.6%)
ⓘ Screening estimate from a state-policy table — verify with the county assessor before closing.
Climate risk First Street
- Flood 4/10 Moderate FEMA zone X (shaded) · 24% chance over 30 yrs
- Wildfire 1/10 Low
- Heat 2/10 Low 7 d/yr ≥100°F today · 14 d/yr by 30 yrs out
- Wind 2/10 Low
- Air quality 1/10 Low 0 unhealthy d/yr today · 0 by 30 yrs out
Nearby sold comps map
Loading sold comps map…
Walkable amenities ~0.75 mi
Loading nearby amenities…
Taxation est. · year 1
- Rental income
- $17,178
- − Mortgage interest
- −$6,442
- − Property taxes
- −$1,574
- − Insurance
- −$575
- − Repairs & maintenance
- −$1,374
- − Management
- −$1,374
- − Depreciation
- −$3,345
- Taxable income
- $2,493
- Est. tax owed @ 24.0%
- −$598
- After-tax cash flow
- $3,586/yr
For passive investors: Depreciation is non-cash, so a rental often shows a tax loss while cash-flowing — sheltering income. Rental losses are passive: they offset passive income freely, and up to $25,000/yr can offset ordinary (W-2) income if you actively participate and your MAGI is under $100k (phasing out to $0 by $150k); unused losses carry forward. On sale, claimed depreciation is recaptured at up to 25%, and gains may owe capital-gains tax (a 1031 exchange can defer both). Figures are a year-1 estimate at your 24.0% rate — not tax advice; consult a CPA.
Schools (NCES district)
- District
- La Crosse School District
- NCES district ID
- 5507530
- Math proficiency
- 29% ▼ -8.00%
- Reading proficiency
- 34% ▼ -4.00%
- Median HH income
- $42,924
- Composite
- 26.76/100
- National rank
- #7135
- State rank
- #267 of 342 in WI
Livability — La Crosse
- Score
- 69/100
- State rank
- #339
- US rank
- #8671
Category grades
Schools grade is shown separately in the Schools card above.
Census & demographics
- Census place
- La Crosse, WI
- County
- La Crosse County · 89,439 people
- City population
- 64,135
- Metro
- La Crosse-Onalaska, WI-MN
- Population (ZIP)
- 13,738
- Household income
- $52,012
- Rent vs Own
- Severe rent burden
- 526.0
Population outlook (La Crosse County) Hauer SSP2
- Today (2025)
- 126,082 people
- By 2030
- 130,161 · +3.2%
- By 2040
- 137,231 · +8.8%
- By 2050
- 143,506 · +13.8%
- By 2075
- 160,149 · +27.0%
- By 2100
- 166,408 · +32.0%
Race, ethnicity, and origin ACS 2023
- Neighborhood character
- Predominantly White (84%)
- Race & ethnicity
- White 84% Two or more races 6% Asian 5% Hispanic / Latino 3% Black 2%
- Common ancestry
- Portuguese 14% Romanian 3% Lithuanian 2%
- Foreign-born
- 3% · China
- Languages at home
- 94% English-only · Other Asian/Pacific 5% Spanish 1%
Political lean MEDSL · La Crosse
- 2024 margin
- Lean D (+9.4) · D 54.0% · R 44.6% · Other 1.4%
- 2008→2024 swing
- -14.1pp toward R · 2008: 23.4pp · 2024: 9.4pp
- All cycles
- 2024: D+9.4 2020: D+13.5 2016: D+9.6 2012: D+17.3 2008: D+23.4
Not yet ingested
- Civics
- —
Market trends
- HPI YoY
- ▼ -166.91%
- Current HPI
- 270.8554
- Rent YoY
- —
- Metro
- La Crosse-Onalaska, WI-MN
- State GDP YoY
- ▲ 2.10%
- F500 in state
- 20
Industry mix (Fortune 500 HQ in WI)
| Industry | F500 HQs | Revenue |
|---|---|---|
| Industrial Machinery | 4 | $23B |
|
||
| Industrial Technology | 2 | $36B |
|
||
| Insurance | 1 | $36B |
|
||
| Professional Services | 1 | $19B |
|
||
| Utilities | 1 | $9B |
|
||
| Consumer Goods | 1 | $3B |
|
||
Price history
+130.0% since first listed24 events — show timeline
- 2026-06-10 Listed $115,000 METROMLS
- 2026-06-10 Listing Removed — METROMLS
- 2024-08-02 Rental Removed $1,225 APPFOLIO
- 2024-06-25 Listed for Rent $1,225 APPFOLIO
- 2021-11-19 Sold (MLS) $73,500 METROMLS
- 2021-10-22 Pending — METROMLS
- 2021-10-19 Listed $69,900 METROMLS
- 2020-05-22 Sold (Public Records) $75,000 Public Records
- 2020-05-21 Sold (MLS) $75,000 METROMLS
- 2020-05-21 Sold (MLS) — METROMLS
- 2020-04-24 Contingent — METROMLS
- 2020-03-22 Price Changed $79,000 METROMLS
- 2020-03-01 Listed $85,000 METROMLS
- 2020-01-05 Listing Removed — METROMLS
- 2020-01-03 Relisted — METROMLS
- 2019-11-06 Pending — METROMLS
- 2019-10-30 Contingent — METROMLS
- 2019-09-17 Listed $65,900 METROMLS
- 2015-07-09 Sold (Public Records) $46,000 Public Records
- 2015-07-08 Sold (MLS) $46,000 METROMLS
- 2015-06-18 Listed $44,900 METROMLS
- 2013-02-07 Listed $58,500 METROMLS
- 2013-02-07 Listing Removed — METROMLS
- 2005-07-27 Sold (Public Records) $50,000 Public Records
Property tax history
+0.9%/yrLatest (2025): $1,574 · +0.1% YoY. Source: county tax records.
Cash-flow waterfall
monthlySold comps — $/sqft
last 12 mo · ≤1 miLoading sold comps…