 🌊 Lakefront
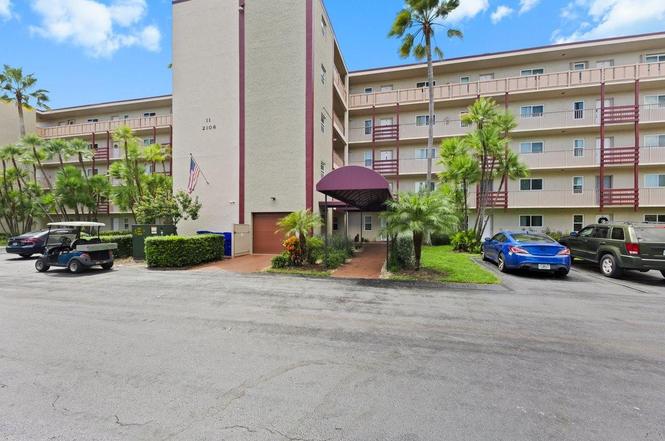
2106 S Cypress Bend Dr #506 · Pompano Beach, FL
Flood risk No data
- FEMA flood zone
- —
- Chance of flooding over 30 yrs
- —
- Est. flood insurance / yr
- —
Fire risk No data
- Est. fire insurance / yr
- —
Heat risk No data
- Hot days now (above threshold)
- —
- Hot days in 30 yrs
- —
Wind risk No data
- Chance of severe wind over 30 yrs
- —
Air-quality risk No data
- Unhealthy air days now
- —
- Unhealthy air days in 30 yrs
- —
Risk factors via First Street. Map © Google.
Why this score? — see what drove the D grade
The composite is a weighted blend of 9 inputs, each scored 0–100. Each bar is that input's sub-score; the figure is the points it added to the 100-point composite (weight × sub-score).
- Cash flow +10.1/30.0
- ARV discount +7.5/15.0
- 1% rule +5.0/10.0
- Schools +4.1/10.0
- Livability +3.7/5.0
- Appreciation +3.4/10.0
- DSCR +2.9/10.0
- Condition / age +2.5/5.0
- Rent growth +2.4/5.0
$217,999
🖨 Deal sheet (PDF) 📄 Offer letter ✓ Due diligence
Listing remarks
Beautiful 2Bed/2Bath Penthouse Condo located in Beautiful Cypress Bend! Renovated, Freshly Painted and ready to move right in! Beautiful Lake View, Hurricane Impact Windows, Washer/Dryer in the unit, Extra Storage and tons of amenities!!! Take advantage of the 2 Pools, Spa, Tennis/Pickleball court, walking paths, Gym, Library, Game Room and Playground. This is a pet friendly building that allows 2 small dogs under 25lbs. Close to Shops, Restaurants, Top Golf, Casino and 6 miles to the Beach. Association has fully funded reserves and is extremely financially sound.
Key facts
- Extra storage
- Spa
- Lake view
Tags
Property features AI
Finance
- Other: Unit living area listed as 770
- Financial info: Pets allowed with limits on number and size
- HOA & community: Association with amenities including clubhouse, fitness center, playground, pool, spa/hot tub, storage, trash chute, bike storage, community room, library, pickleball courts, and maintenance; HOA fee $918 (paid quarterly); HOA covers grounds and structure maintenance, sewer, trash, water, common areas, roof repairs, and recreation facility
Exterior
- Parking: 38 total parking spaces; Assigned parking; Guest parking; 1 open parking space
- Security: Security features present
- Utilities: Cable available
- Home design: Condominium; Resale unit; 5-story building
- Construction: CBS construction
- Exterior features: Not waterfront
Interior
- Kitchen: Electric range; Dishwasher; Microwave; Refrigerator; Garbage disposal; Electric water heater
- Bedrooms: 2 bedrooms on the main level
- Flooring: Tile flooring
- Bathrooms: 2 full bathrooms on the main level
- Heating & cooling: Central heating; Central air conditioning; Ceiling fans
- Interior features: Walk-in closets
Neighborhood map
What this means for you Summary
Snapshot
- This is a 2-bed/2.0-bath condo listed at $218k.
Deal economics
- At list price, monthly cash flow is $-128 ($-2k/yr) — negative.
- To cash-flow at today's rent, offer at most $195k (10.4% below list).
- To meet the 1% rule (rent ≥ 1% of price), the offer needs to be $217k (0.3% below list).
- Recommended offer: $195k (10.4% below list) — sets the bar for cash-flow.
- Cap rate 5.6% vs local median 3.1% in Pompano Beach — top-decile yield for the area; either an underpriced asset or a hidden risk that comps aren't pricing in. Stress-test before assuming the spread holds.
Location & tenants
- Location reads 74/100 on livability (#284 in FL, #4,541 nationally) — a middle-class / working-renter tenant base. Strengths: commute A+, housing A+, cost of living B+; Watch: employment D+, amenities F.
- Broward (suburban): math 42% / reading 53% proficiency, ranked #46 of 73 in FL (top 63%) — families likely to look elsewhere, expect single-tenant / working-renter base with shorter leases.
- Zoned schools: Nova Blanche Forman Elementary (math 35% / reading 55%, grade D-, #1,271 of 2,144 statewide, top 60%, 769 students, 72% FRL); Nova Middle School (math 44% / reading 53%, grade C-, #274 of 571 statewide, top 50%, 1,284 students, 68% FRL); Nova High School (math 22% / reading 56%, grade F, #312 of 667 statewide, top 48%, 2,227 students, 59% FRL) — zoned schools average 66% FRL vs 51% district-wide (15 pts higher); higher-poverty schools than district average — tighter screening recommended.
- Market conditions: Rents soft (-0.3%/yr); 445 active listings in the ZIP; 40 comparable units currently listed for rent nearby; rentals at typical pace (median 26d on market — plan ~3-4 weeks tenant-placement turnaround); 2,111 units permitted in Broward County in 2024 (1,265 in 5+ unit buildings).
- This rent runs 44% of the median local income ($60k/yr) — at the standard rent-burdened threshold; future hikes will face affordability resistance.
Forward outlook
- Local home prices are declining (-3.0%/yr); year-one equity from $2k of loan paydown is wiped out by about $7k of value loss. Plan a longer hold.
- Broward County population projected at +34% by 2050 — long-run rental-demand tailwind backs the buy-and-hold thesis.
Negotiation context
- It's been on market 102 days — a 9% lower offer ($198k) is reasonable based on typical stale-listing flexibility.
- 2 sale attempts; this cycle's ask is 11374% above the opening price — seller raised mid-cycle; expect resistance to lowballs.
Questions for the listing agent
- What do current leases actually rent for vs. the listed asking? Can we see a recent rent roll and the last 12 months of T-12 income?
- It's been on market 102 days. Have you received any prior offers? Is the seller open to a 10% concession, seller financing, or rate buy-down credit?
- What does the HOA fee cover, when was the last increase, and are there any pending special assessments or reserve-fund shortfalls?
- Any open or pending special assessments — roof, HVAC, plumbing, elevator, façade? What's the per-unit balance and payoff schedule, and is the seller paying it off at close or rolling it to the buyer?
- Why hasn't it sold? Are there any deal-killer items the seller is aware of (foundation, flood, title, zoning, code violations)?
- Is there a deadline driving the sale (1031 exchange, divorce, estate, relocation)? That informs how much negotiation room exists.
- Schools are D-rated, which usually means shorter tenancies and higher turnover. Who's the typical renter profile here, and what's been the actual vacancy rate?
- The area grade is low — what's the realistic commute time and amenity access for the typical tenant pool here? Any planned neighborhood developments (good or bad) we should know about?
- This sits on a lake — are riparian / water-frontage rights deeded with the parcel? Any dock permits, shoreline easements, or HOA water-use restrictions?
- What's the documented flood / surge / shoreline-erosion history here (FEMA AND non-FEMA — e.g., storm surge, creek backup, septic-field saturation)?
- Any water-quality or seasonal algae-bloom issues that affect tenant satisfaction or short-term-rental demand?
- What's the average days-on-market for RENTAL listings here right now (not sales)? A rising rental-DOM trend means longer vacancies and softer asking-rent achievability than the comps imply.
- What's the recent tenant-quality profile in this submarket — average credit score on applications, eviction rate, late-payment / NSF rate, and stable-employment percentage? A property-management company in the area should have these aggregated.
- How much new apartment / multifamily construction is in the pipeline within 1–3 miles? Heavy new supply (>2% of stock underway) typically softens rents 12–24 months out; light construction supports rent growth.
Investment metrics
- 1% rule
- 1.00% ✗
- Cap rate
- 5.59%
- Cash-on-cash
- -2.52%
- DSCR
- 0.89
- GRM
- 8.4
CMA / ARV
No comps found within radius.
Projected returns pro-forma
-3.0% appreciation · 0.0% rent growth · sell at horizon
- IRR
- -24.6%
- Equity multiple
- 0.19×
- Total profit
- $-49,612
- Equity at exit
- $32,504
- IRR
- -37.2%
- Equity multiple
- -0.27×
- Total profit
- $-77,350
- Equity at exit
- $18,849
Cash invested: $61,040 (down + closing). Projections, not guarantees.
Landlord ↔ Tenant lean methodology
- Overall (STATE)
- 87 Strongly Landlord-Friendly
- State Florida
- 87 Strongly Landlord-Friendly · R+3
- County
- — inherits STATE
- City
- — inherits STATE
ZIP-level market 33069
- Home prices YoY
- -1.1%
- Rents YoY
- -0.3%
- Active inventory
- 445
- Price-to-rent
- 8.4×
Monthly cashflow live
- Estimated rent
- $2,174 high interval (Pro) →
- Mortgage (P&I)
- −$1,143
- Tax from tax record
- −$306 /mo · $3,669/yr
- Insurance
- −$91
- HOA
- −$306
- Vacancy / Maint / Mgmt
- −$457
- Net cashflow
- $-128
Break-even live
Sensitivity live
| Price | -10% $-5 | -5% $-66 | +0% $-128 | +5% $-190 | +10% $-251 |
|---|---|---|---|---|---|
| Rent | -10% $-300 | -5% $-214 | +0% $-128 | +5% $-42 | +10% $44 |
| Rate | -1.0pp $-18 | -0.5pp $-73 | base $-128 | +0.5pp $-185 | +1.0pp $-242 |
UW: 25.0% down · 7.5% · 30yr · 1.5% tax · 5.0% vac · 8.0% maint · 8.0% mgmt
Financing live
Cash to close
- Down payment
- $54,500
- Closing costs
- $6,540
- Reserves months
- —
- Total cash needed
- —
Loan-product check · same deal, 3 products live
Conventional
25% down · 7.5% · 30yr
- Down + closing
- —
- Monthly P&I
- —
- Monthly cashflow
- —
- DSCR
- —
- Eligible?
- —
Personal DTI + credit; lowest rate.
DSCR
20% down · 8.5% · 30yr
- Down + closing
- —
- Monthly P&I
- —
- Monthly cashflow
- —
- DSCR
- —
- Eligible?
- —
No personal income docs; deal must DSCR.
Hard money
10% down · 12.0% · 12mo
- Down + closing
- —
- Monthly P&I
- —
- Monthly cashflow
- —
- DSCR
- —
- Eligible?
- —
Short-term bridge; refi at stabilization.
Rent comps 40 comps
| Address | Beds | Baths | Sqft | Rent | $/sqft | DOM | Units | Dist |
|---|---|---|---|---|---|---|---|---|
| 2500 SW 7th St Pompano Beach, FL | 3.0 | 1.0–3.0 | 1216 | $4,091 | $3.36 | 1d | 137 | 0.64mi |
| 6500 N Andrews Ave Fort Lauderdale, FL | 2.0 | 1.0–2.0 | 943 | $3,137 | $3.33 | 0d | 31 | 0.66mi |
| 2650 S Course Dr #603 Pompano Beach, FL | 2.0 | 2.0 | 1100 | $3,000 | $2.73 | 21d | 1 | 0.69mi |
| 2751 S Palm Aire Dr #107 Pompano Beach, FL | 2.0 | 2.0 | 1112 | $1,950 | $1.75 | 5d | 1 | 0.77mi |
| 2671 S Course Dr #806 Pompano Beach, FL | 2.0 | 2.0 | 1100 | $2,250 | $2.05 | 17d | 1 | 0.81mi |
| 2671 S Course Dr #506 Pompano Beach, FL | 2.0 | 2.0 | 1100 | $2,250 | $2.05 | 26d | 1 | 0.81mi |
| 2671 S Course Dr #506 Pompano Beach, FL | 2.0 | 2.0 | 1100 | $2,250 | $2.05 | 9d | 1 | 0.81mi |
| 2671 S Course Dr #108 Pompano Beach, FL | 2.0 | 2.0 | 1100 | $1,900 | $1.73 | 1d | 1 | 0.81mi |
| 2671 S Course Dr #206 Pompano Beach, FL | 2.0 | 2.0 | 1100 | $2,000 | $1.82 | 26d | 1 | 0.81mi |
| 2851 S Palm Aire Dr #309 Pompano Beach, FL | 2.0 | 2.0 | 1100 | $1,750 | $1.59 | 18d | 1 | 0.85mi |
| 2851 S Palm Aire Dr #407 Pompano Beach, FL | 1.0 | 1.5 | 900 | $1,675 | $1.86 | 26d | 1 | 0.85mi |
| 2851 S Palm Aire Dr #309 Pompano Beach, FL | 2.0 | 2.0 | 1100 | $1,750 | $1.59 | 26d | 1 | 0.85mi |
| 2851 S Palm Aire Dr #107 Pompano Beach, FL | 1.0 | 1.5 | 960 | $1,750 | $1.82 | 1d | 1 | 0.85mi |
| 2901 S Palm Aire Dr #307 Pompano Beach, FL | 1.0 | 1.5 | 920 | $1,640 | $1.78 | 21d | 1 | 0.91mi |
| 2850 N Palm Aire Dr Pompano Beach, FL | 1.0 | 1.5 | 850 | $2,000 | $2.35 | 26d | 1 | 0.96mi |
| 2751 N Palm Aire Dr #402 Pompano Beach, FL | 2.0 | 2.0 | 1064 | $2,300 | $2.16 | 26d | 1 | 0.96mi |
| 2900 N Palm Aire Dr #405 Pompano Beach, FL | 1.0 | 1.0 | 860 | $1,625 | $1.89 | 19d | 1 | 0.97mi |
| 2900 N Palm Aire Dr #206 Pompano Beach, FL | 1.0 | 1.0 | 860 | $1,650 | $1.92 | 26d | 1 | 0.97mi |
| 2801 N Palm Aire Dr #308 Pompano Beach, FL | 2.0 | 2.0 | 1100 | $1,950 | $1.77 | 26d | 1 | 0.99mi |
| 3051 S Palm Aire Dr #407 Pompano Beach, FL | 2.0 | 2.0 | 1064 | $2,200 | $2.07 | 26d | 1 | 1.05mi |
| 3050 N Palm Aire Dr #602 Pompano Beach, FL | 2.0 | 2.0 | 1100 | $1,895 | $1.72 | 22d | 1 | 1.15mi |
| 3050 N Palm Aire Dr #704 Pompano Beach, FL | 1.0 | 1.5 | 900 | $1,900 | $2.11 | 18d | 1 | 1.15mi |
| 3050 N Palm Aire Dr #704 Pompano Beach, FL | 1.0 | 1.5 | 900 | $1,900 | $2.11 | 17d | 1 | 1.15mi |
| 3050 N Palm Aire Dr #508 Pompano Beach, FL | 2.0 | 2.0 | 1100 | $2,100 | $1.91 | 26d | 1 | 1.15mi |
| 3151 S Palm Aire Dr #407 Pompano Beach, FL | 2.0 | 2.0 | 1064 | $2,200 | $2.07 | 26d | 1 | 1.15mi |
| 2940 N Course Dr Pompano Beach, FL | 1.0 | 1.0 | 1100 | $1,050 | $0.95 | 26d | 1 | 1.15mi |
| 2940 N Course Dr #910 Pompano Beach, FL | 2.0 | 2.0 | 1100 | $1,950 | $1.77 | 26d | 1 | 1.16mi |
| 2940 N Course Dr #311 Pompano Beach, FL | 2.0 | 2.0 | 1100 | $2,500 | $2.27 | 12d | 1 | 1.16mi |
| 540 NE 59th Ct Fort Lauderdale, FL | 3.0 | 2.0 | 964 | $3,400 | $3.53 | 26d | 1 | 1.16mi |
| 5841 NE 3rd Ave Fort Lauderdale, FL | 3.0 | 2.0 | 834 | $3,200 | $3.84 | 26d | 1 | 1.16mi |
| 2801 N Course Dr Pompano Beach, FL | 1.0–2.0 | 1.0–2.0 | 991 | $2,325 | $2.35 | 26d | 12 | 1.19mi |
| 2803 N Course Dr #203 Pompano Beach, FL | 2.0 | 2.0 | 1120 | $2,050 | $1.83 | 6d | 1 | 1.21mi |
| 2803 N Course Dr #203 Pompano Beach, FL | 2.0 | 2.0 | 1120 | $2,100 | $1.88 | 22d | 1 | 1.21mi |
| 3100 N Palm Aire Dr #107 Pompano Beach, FL | 1.0 | 2.0 | 960 | $1,800 | $1.88 | 26d | 1 | 1.22mi |
| 1156 SW 4th Ave Pompano Beach, FL | 2.0 | 1.0 | 945 | $3,300 | $3.49 | 7d | 1 | 1.23mi |
| 500 SW 2nd Ct Pompano Beach, FL | 1.0 | 1.0 | 650 | $1,595 | $2.45 | 26d | 1 | 1.24mi |
| 2829 N Course Dr #104 Pompano Beach, FL | 2.0 | 2.0 | 1020 | $1,950 | $1.91 | 22d | 1 | 1.25mi |
| 3150 N Palm Aire Dr #307 Pompano Beach, FL | 1.0 | 1.5 | 900 | $1,700 | $1.89 | 26d | 1 | 1.29mi |
| 2809 N Course Dr #205 Pompano Beach, FL | 1.0 | 1.0 | 735 | $1,700 | $2.31 | 26d | 1 | 1.30mi |
| 450 SW 2nd St Unit 518-7 Pompano Beach, FL | 2.0 | 1.0 | 800 | $1,750 | $2.19 | 26d | 1 | 1.31mi |
HOA detail condo
- Monthly dues
- $306 · $3,672/yr
- Likely covers
- poolgym
- Assessments
- None detected in remarks — confirm with the listing agent.
Listing history 15 events
-
2026-06-21days on market $217,999 Active 102 DOM
-
2026-06-18days on market $217,999 Active 99 DOM
-
2026-06-17days on market $217,999 Active 98 DOM
-
2026-06-16days on market $217,999 Active 97 DOM
-
2026-06-15days on market $217,999 Active 96 DOM
-
2026-06-13days on market $217,999 Active 94 DOM
-
2026-06-09days on market $217,999 Active 90 DOM
-
2026-06-07days on market $217,999 Active 88 DOM
-
2026-06-04days on market $217,999 Active 85 DOM
-
2026-06-03days on market $217,999 Active 84 DOM
-
2026-06-02days on market $217,999 Active 83 DOM
-
2026-06-01days on market $217,999 Active 82 DOM
-
2026-05-31days on market $217,999 Active 81 DOM
-
2026-04-29$1,900
-
2025-10-03$217,999 Active
ⓘ Source: listings_history table (triggers on properties + properties_extension) + one-shot
backfill from property_details.listing_events for pre-trigger history.
Tax reassessment forecast FL · Resets to sale price
- Current annual tax
- $3,669 · $306/mo
- Projected year-2 tax
- $3,669 · $306/mo
- Expected delta
- $0/yr ($0/mo · 0.0%)
ⓘ Screening estimate from a state-policy table — verify with the county assessor before closing.
Nearby sold comps map
Loading sold comps map…
Walkable amenities ~0.75 mi
Loading nearby amenities…
Taxation est. · year 1
- Rental income
- $26,092
- − Mortgage interest
- −$12,211
- − Property taxes
- −$3,669
- − Insurance
- −$1,090
- − Repairs & maintenance
- −$2,087
- − Management
- −$2,087
- − HOA
- −$3,672
- − Depreciation
- −$6,342
- Taxable loss
- −$5,067
- Est. tax savings @ 24.0%
- +$1,216
- After-tax cash flow
- $-321/yr
For passive investors: Depreciation is non-cash, so a rental often shows a tax loss while cash-flowing — sheltering income. Rental losses are passive: they offset passive income freely, and up to $25,000/yr can offset ordinary (W-2) income if you actively participate and your MAGI is under $100k (phasing out to $0 by $150k); unused losses carry forward. On sale, claimed depreciation is recaptured at up to 25%, and gains may owe capital-gains tax (a 1031 exchange can defer both). Figures are a year-1 estimate at your 24.0% rate — not tax advice; consult a CPA.
Schools (NCES district)
- District
- Broward
- NCES district ID
- 1200180
- Math proficiency
- 42% ▼ -18.00%
- Reading proficiency
- 53% ▼ -5.00%
- Median HH income
- $52,139
- Composite
- 40.88/100
- National rank
- #3621
- State rank
- #46 of 73 in FL
Livability — Pompano Beach
- Score
- 74/100
- State rank
- #284
- US rank
- #4541
Category grades
Schools grade is shown separately in the Schools card above.
Census & demographics
- Census place
- Pompano Beach, FL
- County
- Broward County · 1,963,430 people
- City population
- 155,861
- Metro
- Miami-Fort Lauderdale-Pompano Beach, FL
- Population (ZIP)
- 29,145
- Household income
- $59,683
- Rent vs Own
- Severe rent burden
- 1670.0
Population outlook (Broward County) Hauer SSP2
- Today (2025)
- 2,207,033 people
- By 2030
- 2,360,704 · +7.0%
- By 2040
- 2,661,208 · +20.6%
- By 2050
- 2,946,698 · +33.5%
- By 2075
- 3,602,273 · +63.2%
- By 2100
- 3,970,984 · +79.9%
Race, ethnicity, and origin ACS 2023
- Neighborhood character
- Highly diverse neighborhood (Simpson 0.72)
- Race & ethnicity
- Black 33% White 32% Hispanic / Latino 26% Two or more races 21% Asian 3%
- Hispanic origin (detail)
- Mexican 5% Puerto Rican 3% Cuban 3% Dominican 2%
- Common ancestry
- Hispanic 9% Estonian 2% Romanian 2%
- Foreign-born
- 33% · Canada, Jamaica
- Languages at home
- 61% English-only · Spanish 23% French/Haitian/Cajun 9% Other Indo-European 5%
Political lean MEDSL · Broward
- 2024 margin
- D (+17.0) · D 58.0% · R 41.0%
- 2008→2024 swing
- -17.8pp toward R · 2008: 34.7pp · 2024: 17.0pp
- All cycles
- 2024: D+17.0 2020: D+29.8 2016: D+35.0 2012: D+34.9 2008: D+34.7
Not yet ingested
- Civics
- —
Market trends
- HPI YoY
- ▼ -3.16%
- Current HPI
- 297.1774
- Rent YoY
- ▼ -0.29%
- Metro
- Miami-Fort Lauderdale-Pompano Beach, FL
- State GDP YoY
- ▲ 3.28%
- F500 in state
- 36
Industry mix (Fortune 500 HQ in FL)
| Industry | F500 HQs | Revenue |
|---|---|---|
| Industrial Technology | 2 | $29B |
|
||
| Insurance | 2 | $17B |
|
||
| Retail | 1 | $60B |
|
||
| Technology Distribution | 1 | $58B |
|
||
| Homebuilding | 1 | $35B |
|
||
| Technology Manufacturing | 1 | $35B |
|
||
Price history
-99.1% since first listed2 events — show timeline
- 2026-04-29 Listed for Rent $1,900 GFLMLS
- 2025-10-03 Listed $217,999 Beaches MLS
Property tax history
+9.8%/yrLatest (2025): $3,669 · +7.2% YoY. Source: county tax records.
Cash-flow waterfall
monthlySold comps — $/sqft
last 12 mo · ≤1 miLoading sold comps…