 🏗️ New Construction
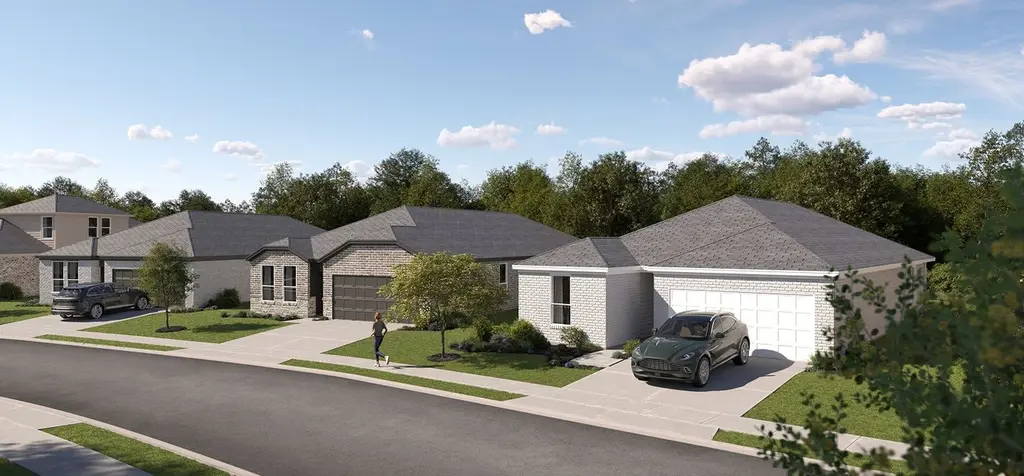
Dowing Plan · Corpus Christi, TX
Flood risk No data
- FEMA flood zone
- —
- Chance of flooding over 30 yrs
- —
- Est. flood insurance / yr
- —
Fire risk No data
- Est. fire insurance / yr
- —
Heat risk No data
- Hot days now (above threshold)
- —
- Hot days in 30 yrs
- —
Wind risk No data
- Chance of severe wind over 30 yrs
- —
Air-quality risk No data
- Unhealthy air days now
- —
- Unhealthy air days in 30 yrs
- —
Risk factors via First Street. Map © Google.
Why this score? — see what drove the D+ grade
The composite is a weighted blend of 9 inputs, each scored 0–100. Each bar is that input's sub-score; the figure is the points it added to the 100-point composite (weight × sub-score).
- Cash flow +16.0/30.0
- ARV discount +7.5/15.0
- Schools +6.1/10.0
- DSCR +4.9/10.0
- 1% rule +4.4/10.0
- Livability +3.9/5.0
- Rent growth +3.1/5.0
- Condition / age +1.0/5.0
- Appreciation +0.0/10.0
$276,999
🖨 Deal sheet (PDF) 📄 Offer letter ✓ Due diligence
Listing remarks MLS
The Watermill Collection offers new single-family homes for sale at a great value, now selling at the Kings Landing masterplan in Corpus Christi, TX. Located right off of Highway 286, homeowners enjoy convenient access to restaurants, shops and entertainment. It's only a short 15-minute drive to all the local offerings in downtown Corpus Christi and 30 minutes to water-borne adventures on Mustang Island. Students will attend the well-renown London Independent School District.
Key facts
- Convenient access
- 2 garage spots
- Listed 128 days
Tags
Neighborhood map
What this means for you Summary
Snapshot
- This is a 4-bed/2.0-bath single-family listed at $277k. Condition is rated poor.
Deal economics
- At list price, monthly cash flow is $132 ($2k/yr) — positive.
- The deal already cash-flows at list — no discount required.
- To meet the 1% rule (rent ≥ 1% of price), the offer needs to be $251k (9.2% below list).
- Recommended offer: $244k (12.0% below list) — sets the bar for market timing.
- Cap rate 6.9% vs local median 3.6% in Corpus Christi — top-decile yield for the area; either an underpriced asset or a hidden risk that comps aren't pricing in. Stress-test before assuming the spread holds.
Location & tenants
- Location reads 78/100 on livability (#66 in TX, #2,404 nationally) — a middle-class / working-renter tenant base. Strengths: commute A+, cost of living A+, housing A+; Watch: crime F.
- London ISD (rural): math 65% / reading 62% proficiency, ranked #13 of 826 in TX (top 2%) — acceptable for families but not a draw, mixed tenant base, ~2y average lease; only 19% free/reduced lunch — higher-income household profile.
- Zoned schools: London El (346 students, 20% FRL); London Middle (math 70% / reading 63%, grade A-, #89 of 1,662 statewide, top 5%, 393 students, 14% FRL); London H S (math 62% / reading 77%, grade B, #119 of 1,632 statewide, top 9%, 507 students, 18% FRL) — zoned schools at 17% FRL track the district average.
- Market conditions: Rents rising (+2.3%/yr); 434 active listings in the ZIP; 9 comparable units currently listed for rent nearby; rentals at typical pace (median 16d on market — plan ~3-4 weeks tenant-placement turnaround); 1,397 units permitted in Nueces County in 2024 (47 in 5+ unit buildings).
- At $2,514/mo this rent would consume 55% of the median local household income ($55k/yr) (locally 1730% of renters already pay >50% of income on rent) — very limited rent-growth headroom before tenants either downsize or default.
Forward outlook
- Local home prices are declining (-3.0%/yr); year-one equity from $2k of loan paydown is wiped out by about $8k of value loss. Plan a longer hold.
- Nueces County population projected at +36% by 2050 — long-run rental-demand tailwind backs the buy-and-hold thesis.
Negotiation context
- It's been on market 128 days — a 12% lower offer ($244k) is reasonable based on typical stale-listing flexibility.
Questions for the listing agent
- It's been on market 128 days. Have you received any prior offers? Is the seller open to a 12% concession, seller financing, or rate buy-down credit?
- Have any recent inspections been done? Can we get a copy of the seller's disclosures and any deferred-maintenance estimates?
- Why hasn't it sold? Are there any deal-killer items the seller is aware of (foundation, flood, title, zoning, code violations)?
- Is there a deadline driving the sale (1031 exchange, divorce, estate, relocation)? That informs how much negotiation room exists.
- Crime grade is F in this area — have there been break-ins, vandalism, or insurance claims at this property in the last 3 years? What carrier currently insures it and at what premium?
- The area grade is low — what's the realistic commute time and amenity access for the typical tenant pool here? Any planned neighborhood developments (good or bad) we should know about?
- What's the average days-on-market for RENTAL listings here right now (not sales)? A rising rental-DOM trend means longer vacancies and softer asking-rent achievability than the comps imply.
- What's the recent tenant-quality profile in this submarket — average credit score on applications, eviction rate, late-payment / NSF rate, and stable-employment percentage? A property-management company in the area should have these aggregated.
- How much new for-sale + rental construction is in the pipeline within 1–3 miles? Heavy new supply typically softens prices + rents 12–24 months out; constrained supply supports both.
Investment metrics
- 1% rule
- 0.94% ✗
- Cap rate
- 6.88%
- Cash-on-cash
- 2.10%
- DSCR
- 1.09
- GRM
- 8.9
CMA / ARV
- ARV (median comp)
- $268,343
- List price
- $276,999
- Delta
- 3.23%
- Verdict
- FAIR
- Comps
- 20 within 1.0 mi
Show comp detail 12 sales within ~0.75 mi
| Address | Dist | Beds/Ba | Sqft | Sold | Price | $/sf | Match |
|---|---|---|---|---|---|---|---|
| 2618 Westeros St | 0.11mi | 3/2.0 (-1) | 1,829 (-1%) | 1mo | $360,000 | $197 | 87 |
| 2705 Eltonne Gardens Dr | 0.34mi | 4/2.0 | 1,855 (+0%) | 1mo | $280,000 | $151 | 83 |
| 1339 Grey Worm Dr | 0.44mi | 4/2.0 | 1,850 (0%) | 1mo | $268,999 | $145 | 79 |
| 2753 Excelsior Blvd | 0.40mi | 4/2.0 | 1,863 (+1%) | 1mo | $320,000 | $172 | 79 |
| 1309 Connie Scott Dr | 0.31mi | 4/2.0 | 1,783 (-4%) | 1mo | $331,065 | $186 | 79 |
| 2749 Eltonne Gardens Dr | 0.44mi | 4/2.0 | 1,894 (+2%) | 1mo | $285,100 | $151 | 75 |
| 2717 Eltonne Gardens Dr | 0.37mi | 4/2.0 | 1,761 (-5%) | 1mo | $265,100 | $151 | 74 |
| 2606 Westeros St | 0.11mi | 3/2.0 (-1) | 1,595 (-14%) | 1mo | $329,990 | $207 | 66 |
| 2766 Westeros St | 0.40mi | 4/2.0 | 1,667 (-10%) | 1mo | $267,999 | $161 | 64 |
| 1314 Lady Yoli St | 0.40mi | 4/2.0 | 1,667 (-10%) | 1mo | $254,999 | $153 | 64 |
| 1325 Connie Scott Dr | 0.31mi | 4/2.0 | 1,612 (-13%) | 1mo | $319,565 | $198 | 63 |
| 2817 Westeros St | 0.41mi | 4/3.0 | 2,015 (+9%) | 1mo | $317,999 | $158 | 61 |
Match score weights: distance 35% · size 25% · config 20% · recency 20%. Top-matched comps best support the ARV.
Projected returns pro-forma
-3.0% appreciation · 2.32% rent growth · sell at horizon
- IRR
- -13.7%
- Equity multiple
- 0.51×
- Total profit
- $-36,760
- Equity at exit
- $40,011
- IRR
- -5.9%
- Equity multiple
- 0.63×
- Total profit
- $-27,963
- Equity at exit
- $23,201
Cash invested: $75,136 (down + closing). Projections, not guarantees.
Landlord ↔ Tenant lean methodology
- Overall (STATE)
- 87 Strongly Landlord-Friendly
- State Texas
- 87 Strongly Landlord-Friendly · R+5
- County
- — inherits STATE
- City
- — inherits STATE
ZIP-level market 78415
- Rents YoY
- 2.3%
- Active inventory
- 434
- Price-to-rent
- 9.2×
Monthly cashflow live
- Estimated rent
- $2,514 high interval (Pro) →
- Mortgage (P&I)
- −$1,407
- Tax est. 1.5%
- −$335 /mo · $4,025/yr
- Insurance
- −$112
- HOA
- −$0
- Vacancy / Maint / Mgmt
- −$528
- Net cashflow
- $132
Break-even live
Sensitivity live
| Price | -10% $317 | -5% $225 | +0% $132 | +5% $39 | +10% $-54 |
|---|---|---|---|---|---|
| Rent | -10% $-67 | -5% $32 | +0% $132 | +5% $231 | +10% $330 |
| Rate | -1.0pp $267 | -0.5pp $200 | base $132 | +0.5pp $62 | +1.0pp $-8 |
UW: 25.0% down · 7.5% · 30yr · 1.5% tax · 5.0% vac · 8.0% maint · 8.0% mgmt
Financing live
Cash to close
- Down payment
- $67,086
- Closing costs
- $8,050
- Reserves months
- —
- Total cash needed
- —
Loan-product check · same deal, 3 products live
Conventional
25% down · 7.5% · 30yr
- Down + closing
- —
- Monthly P&I
- —
- Monthly cashflow
- —
- DSCR
- —
- Eligible?
- —
Personal DTI + credit; lowest rate.
DSCR
20% down · 8.5% · 30yr
- Down + closing
- —
- Monthly P&I
- —
- Monthly cashflow
- —
- DSCR
- —
- Eligible?
- —
No personal income docs; deal must DSCR.
Hard money
10% down · 12.0% · 12mo
- Down + closing
- —
- Monthly P&I
- —
- Monthly cashflow
- —
- DSCR
- —
- Eligible?
- —
Short-term bridge; refi at stabilization.
Rent comps 9 comps
| Address | Beds | Baths | Sqft | Rent | $/sqft | DOM | Units | Dist |
|---|---|---|---|---|---|---|---|---|
| 2678 Lady Andrea Dr Corpus Christi, TX | 4.0 | 2.0 | 1780 | $3,000 | $1.69 | 16d | 1 | 0.21mi |
| 2826 Westeros St Corpus Christi, TX | 4.0 | 3.0 | 2016 | $2,550 | $1.26 | 16d | 1 | 0.42mi |
| 2741 Eltonne Gardens Dr Corpus Christi, TX | 4.0 | 2.0 | 1893 | $2,500 | $1.32 | 46d | 1 | 0.44mi |
| 2749 Eltonne Gardens Dr Corpus Christi, TX | 4.0 | 2.0 | 1894 | $2,295 | $1.21 | 16d | 1 | 0.46mi |
| 1341 Trent Park Ln Corpus Christi, TX | 5.0 | 2.0 | 2074 | $2,750 | $1.33 | 16d | 1 | 0.46mi |
| 1405 Irigoyen Ct Corpus Christi, TX | 4.0 | 2.0 | 2065 | $2,800 | $1.36 | 16d | 1 | 0.47mi |
| 1258 Breebry Dr Corpus Christi, TX | 3.0 | 2.0 | 1484 | $2,195 | $1.48 | 16d | 1 | 0.60mi |
| 1269 Thames Chase Dr Corpus Christi, TX | 3.0 | 2.0 | 1585 | $2,350 | $1.48 | 16d | 1 | 0.60mi |
| 1205 Carnaby St Corpus Christi, TX | 4.0 | 2.0 | 1689 | $2,600 | $1.54 | 46d | 1 | 0.73mi |
Listing history 19 events
-
2026-06-21pricedays on market $276,999 Active 128 DOM
-
2026-06-18days on market $278,999 Active 125 DOM
-
2026-06-17days on market $278,999 Active 124 DOM
-
2026-06-16days on market $278,999 Active 123 DOM
-
2026-06-15days on market $278,999 Active 122 DOM
-
2026-06-14days on market $278,999 Active 120 DOM
-
2026-06-13days on market $278,999 Active 119 DOM
-
2026-06-10days on market $278,999 Active 117 DOM
-
2026-06-09days on market $278,999 Active 116 DOM
-
2026-06-08pricedays on market $278,999 Active 115 DOM
-
2026-06-07days on market $283,999 Active 114 DOM
-
2026-06-03days on market $283,999 Active 110 DOM
-
2026-06-02days on market $283,999 Active 109 DOM
-
2026-06-01days on market $283,999 Active 108 DOM
-
2026-05-31days on market $283,999 Active 107 DOM
-
2026-05-30days on market $283,999 Active 106 DOM
-
2026-05-13price $283,999 480-char remark
Show marketing remark (480 chars)
The Watermill Collection offers new single-family homes for sale at a great value, now selling at the Kings Landing masterplan in Corpus Christi, TX. Located right off of Highway 286, homeowners enjoy convenient access to restaurants, shops and entertainment. It's only a short 15-minute drive to all the local offerings in downtown Corpus Christi and 30 minutes to water-borne adventures on Mustang Island. Students will attend the well-renown London Independent School District.
-
2026-05-11price $281,999 480-char remark
Show marketing remark (480 chars)
The Watermill Collection offers new single-family homes for sale at a great value, now selling at the Kings Landing masterplan in Corpus Christi, TX. Located right off of Highway 286, homeowners enjoy convenient access to restaurants, shops and entertainment. It's only a short 15-minute drive to all the local offerings in downtown Corpus Christi and 30 minutes to water-borne adventures on Mustang Island. Students will attend the well-renown London Independent School District.
-
2026-02-13$279,999 Active 480-char remark
Show marketing remark (480 chars)
The Watermill Collection offers new single-family homes for sale at a great value, now selling at the Kings Landing masterplan in Corpus Christi, TX. Located right off of Highway 286, homeowners enjoy convenient access to restaurants, shops and entertainment. It's only a short 15-minute drive to all the local offerings in downtown Corpus Christi and 30 minutes to water-borne adventures on Mustang Island. Students will attend the well-renown London Independent School District.
ⓘ Source: listings_history table (triggers on properties + properties_extension) + one-shot
backfill from property_details.listing_events for pre-trigger history.
Nearby sold comps map
Loading sold comps map…
Walkable amenities ~0.75 mi
Loading nearby amenities…
Taxation est. · year 1
- Rental income
- $30,171
- − Mortgage interest
- −$15,031
- − Property taxes
- −$4,025
- − Insurance
- −$1,342
- − Repairs & maintenance
- −$2,414
- − Management
- −$2,414
- − Depreciation
- −$7,806
- Taxable loss
- −$2,861
- Est. tax savings @ 24.0%
- +$687
- After-tax cash flow
- $2,268/yr
For passive investors: Depreciation is non-cash, so a rental often shows a tax loss while cash-flowing — sheltering income. Rental losses are passive: they offset passive income freely, and up to $25,000/yr can offset ordinary (W-2) income if you actively participate and your MAGI is under $100k (phasing out to $0 by $150k); unused losses carry forward. On sale, claimed depreciation is recaptured at up to 25%, and gains may owe capital-gains tax (a 1031 exchange can defer both). Figures are a year-1 estimate at your 24.0% rate — not tax advice; consult a CPA.
Condition & rehab AI · 1 photo
This home requires extensive repairs and maintenance, including exterior siding, roof, flooring, and interior cleaning and paint. Significant updates are needed to improve its condition and resale value.
Repairs flagged
- Major exterior siding — Significant damage and wear
- Major roof — Missing shingles
- Major flooring — Worn and damaged condition
- Major interior walls/paint — Dirty and in need of cleaning
Value-add opportunities
- Resale exterior siding repair — Aesthetic improvement and increased curb appeal
- Resale roof repair — Structural integrity and safety
- Resale flooring replacement — Improved living space and increased value
- Resale interior cleaning and paint — Fresh and clean appearance
Renovation cost estimate screening
| Repair item | Severity | Est. cost |
|---|---|---|
| exterior siding · Significant damage and wear | Major | $15,000–50,000 |
| roof · Missing shingles | Major | $15,000–50,000 |
| flooring · Worn and damaged condition | Major | $15,000–50,000 |
| interior walls/paint · Dirty and in need of cleaning | Major | $15,000–50,000 |
| Total estimated repair cost · 4 items | $60,000–200,000 |
Value-add ROI direction
- Resale exterior siding repair — Aesthetic improvement and increased curb appeal ↑
- Resale roof repair — Structural integrity and safety ↑
- Resale flooring replacement — Improved living space and increased value ↑
- Resale interior cleaning and paint — Fresh and clean appearance ↑
ⓘ Cost ranges are severity-bucket heuristics (US national rule-of-thumb). Get contractor quotes + a written scope before underwriting a rehab budget.
Schools (NCES district)
- District
- London ISD
- NCES district ID
- 4827990
- Math proficiency
- 65% ▬ 0.00%
- Reading proficiency
- 62% ▬ 0.00%
- Median HH income
- $123,503
- Composite
- 61.03/100
- National rank
- #796
- State rank
- #13 of 826 in TX
Livability — Corpus Christi
- Score
- 78/100
- State rank
- #66
- US rank
- #2404
Category grades
Schools grade is shown separately in the Schools card above.
Census & demographics
- Census place
- Corpus Christi, TX
- County
- Nueces County · 296,836 people
- City population
- 296,836
- Metro
- Corpus Christi, TX
- Population (ZIP)
- 43,080
- Household income
- $54,990
- Rent vs Own
- Severe rent burden
- 1730.0
Population outlook (Nueces County) Hauer SSP2
- Today (2025)
- 418,037 people
- By 2030
- 447,123 · +7.0%
- By 2040
- 505,911 · +21.0%
- By 2050
- 567,522 · +35.8%
- By 2075
- 729,686 · +74.6%
- By 2100
- 847,087 · +102.6%
Race, ethnicity, and origin ACS 2023
- Neighborhood character
- Predominantly Hispanic (83%)
- Race & ethnicity
- Hispanic / Latino 83% Two or more races 41% White 12% Black 3%
- Hispanic origin (detail)
- Mexican 75%
- Foreign-born
- 9% · Canada
- Languages at home
- 59% English-only · Spanish 40%
Political lean MEDSL · Nueces
- 2024 margin
- R (+11.5) · D 43.8% · R 55.3%
- 2008→2024 swing
- -7.1pp toward R · 2008: -4.4pp · 2024: -11.5pp
- All cycles
- 2024: R+11.5 2020: R+2.9 2016: R+1.5 2012: R+3.2 2008: R+4.4
Not yet ingested
- Civics
- —
Market trends
- HPI YoY
- ▼ -173.20%
- Current HPI
- 158.011
- Rent YoY
- ▲ 2.32%
- Metro
- Corpus Christi, TX
- State GDP YoY
- ▲ 3.95%
- F500 in state
- 110
Industry mix (Fortune 500 HQ in TX)
| Industry | F500 HQs | Revenue |
|---|---|---|
| Energy | 16 | $1,198B |
|
||
| Technology | 5 | $198B |
|
||
| Engineering / Construction | 4 | $72B |
|
||
| Energy Services | 3 | $60B |
|
||
| Utilities | 3 | $41B |
|
||
| Healthcare | 2 | $330B |
|
||
Price history
+1.4% since first listed3 events — show timeline
- 2026-05-13 Price Changed $283,999 Zillow
- 2026-05-11 Price Changed $281,999 Zillow
- 2026-02-13 Listed $279,999 Zillow
Cash-flow waterfall
monthlySold comps — $/sqft
last 12 mo · ≤1 miLoading sold comps…