2556 N Ely Hwy · Alma, MI
Flood risk 1/10 · Minimal
- FEMA flood zone
- X (unshaded)
- Chance of flooding over 30 yrs
- 0.0%
- Est. flood insurance / yr
- $473 – $860
Fire risk 1/10 · Minimal
- Est. fire insurance / yr
- $784 – $1,456
Heat risk 2/10 · Minimal
- Hot days now (above 99°F)
- 7 days/yr
- Hot days in 30 yrs
- 14 days/yr
Wind risk 1/10 · Minimal
- Chance of severe wind over 30 yrs
- —
Air-quality risk 2/10 · Minimal
- Unhealthy air days now
- 1 days/yr
- Unhealthy air days in 30 yrs
- 2 days/yr
Risk factors via First Street. Map © Google.
Why this score? — see what drove the B- grade
The composite is a weighted blend of 9 inputs, each scored 0–100. Each bar is that input's sub-score; the figure is the points it added to the 100-point composite (weight × sub-score).
- Cash flow +30.0/30.0
- 1% rule +10.0/10.0
- DSCR +10.0/10.0
- ARV discount +7.5/15.0
- Livability +3.5/5.0
- Schools +3.0/10.0
- Rent growth +2.5/5.0
- Condition / age +2.5/5.0
- Appreciation +0.0/10.0
$25,000
🖨 Deal sheet (PDF) 📄 Offer letter ✓ Due diligence
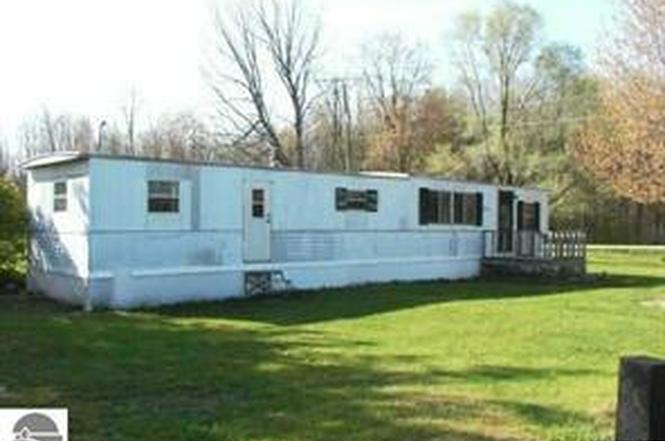
Listing remarks MLS
Nice corner lot on black top road. Mature trees on a 1acre lot. Great place to build a new home! Could live in mobile home while building. Fixer upper. Cash sale AS IS for $25,000. Rent to own options available for $40,000 at $500/month. * * Agent has interest * *
Key facts
- 1 acre lot
- Corner lot
- Mature trees
Tags
Property features AI
Finance
- Financial info: Annual tax amount listed
Exterior
- Parking: Driveway; no garage
- Utilities: Private well water; Septic tank sewer
- Home design: Single-family residence; One-story home
- Construction: Aluminum siding; Pillar/post/pier foundation; 720 above-grade finished square feet
- Exterior features: Ground-level entry with steps; Lot borders interstate/highway; 1-acre lot (approximate dimensions: 398 x 346 x 267)
Interior
- Bathrooms: 1 full bathroom
- Heating & cooling: Forced air heating; Propane heating; No central cooling
- Interior features: Total of 4 rooms
Neighborhood map
What this means for you Summary
Snapshot
- This is a 2-bed/1.0-bath single-family listed at $25k.
Deal economics
- At list price, monthly cash flow is $545 ($7k/yr) — positive.
- The deal already cash-flows at list — no discount required.
- Meets the 1% rule at list price ($919 rent vs $25k).
- Cap rate 32.5% vs local median 4.1% in Alma — top-decile yield for the area; either an underpriced asset or a hidden risk that comps aren't pricing in. Stress-test before assuming the spread holds.
Location & tenants
- Location reads 69/100 on livability (#345 in MI) — a middle-class / working-renter tenant base. Strengths: cost of living A+, housing A+, health & safety A+; Watch: crime D+, amenities F, commute F.
- Alma Public Schools (town): math 28% / reading 44% proficiency, ranked #288 of 540 in MI (top 53%) — families likely to look elsewhere, expect single-tenant / working-renter base with shorter leases.
- Market conditions: 89 active listings in the ZIP; 47 units permitted in Gratiot County in 2024 (0 in 5+ unit buildings).
Forward outlook
- Local home prices are declining (-3.0%/yr); year-one equity from $173 of loan paydown is wiped out by about $750 of value loss. Plan a longer hold.
- Gratiot County population projected at -14% by 2050 — secular population decline; favor cash flow + early exit over multi-decade hold.
- At projected returns (-3.0% appreciation + 3.0% rent growth), your $7k cash investment doubles in ~2 years — after that, you're playing with house money.
Negotiation context
- Only 5 days on market — expect competitive offers; lowballing is unlikely to land.
- 3 sale attempts since 17y ago with the ask held roughly flat each time — persistent listings suggest the price (not the market) is what's stuck; bring a comps-based counter.
- Current owner paid $8k; list at $25k implies a 212% gain — meaningful room to come down on a strong offer.
Questions for the listing agent
- Built in 1966 — when were the roof, HVAC, electrical panel, plumbing, and water heater last replaced?
- Is there a deadline driving the sale (1031 exchange, divorce, estate, relocation)? That informs how much negotiation room exists.
- Crime grade is D in this area — have there been break-ins, vandalism, or insurance claims at this property in the last 3 years? What carrier currently insures it and at what premium?
- What's the average days-on-market for RENTAL listings here right now (not sales)? A rising rental-DOM trend means longer vacancies and softer asking-rent achievability than the comps imply.
- What's the recent tenant-quality profile in this submarket — average credit score on applications, eviction rate, late-payment / NSF rate, and stable-employment percentage? A property-management company in the area should have these aggregated.
- How much new for-sale + rental construction is in the pipeline within 1–3 miles? Heavy new supply typically softens prices + rents 12–24 months out; constrained supply supports both.
Investment metrics
- 1% rule
- 3.67% ✓
- Cap rate
- 32.46%
- Cash-on-cash
- 93.45%
- DSCR
- 5.16
- GRM
- 2.3
CMA / ARV
No comps found within radius.
Projected returns pro-forma
-3.0% appreciation · 3.0% rent growth · sell at horizon
- IRR
- 94.3%
- Equity multiple
- 5.38×
- Total profit
- $30,686
- Equity at exit
- $3,728
- IRR
- 97.1%
- Equity multiple
- 11.21×
- Total profit
- $71,503
- Equity at exit
- $2,162
Cash invested: $7,000 (down + closing). Projections, not guarantees.
Landlord ↔ Tenant lean methodology
- Overall (STATE)
- 62 Landlord-Friendly
- State Michigan
- 62 Landlord-Friendly · EVEN
- County
- — inherits STATE
- City
- — inherits STATE
ZIP-level market 48801
- Home prices YoY
- -32.0%
- Active inventory
- 89
- Price-to-rent
- 2.3×
Monthly cashflow live
- Estimated rent
- $919 medium interval (Pro) →
- Mortgage (P&I)
- −$131
- Tax from tax record
- −$39 /mo · $468/yr
- Insurance
- −$10
- HOA
- −$0
- Vacancy / Maint / Mgmt
- −$193
- Net cashflow
- $545
Break-even live
Sensitivity live
| Price | -10% $559 | -5% $552 | +0% $545 | +5% $538 | +10% $531 |
|---|---|---|---|---|---|
| Rent | -10% $473 | -5% $509 | +0% $545 | +5% $581 | +10% $618 |
| Rate | -1.0pp $558 | -0.5pp $551 | base $545 | +0.5pp $539 | +1.0pp $532 |
UW: 25.0% down · 7.5% · 30yr · 1.5% tax · 5.0% vac · 8.0% maint · 8.0% mgmt
Financing live
Cash to close
- Down payment
- $6,250
- Closing costs
- $750
- Reserves months
- —
- Total cash needed
- —
Loan-product check · same deal, 3 products live
Conventional
25% down · 7.5% · 30yr
- Down + closing
- —
- Monthly P&I
- —
- Monthly cashflow
- —
- DSCR
- —
- Eligible?
- —
Personal DTI + credit; lowest rate.
DSCR
20% down · 8.5% · 30yr
- Down + closing
- —
- Monthly P&I
- —
- Monthly cashflow
- —
- DSCR
- —
- Eligible?
- —
No personal income docs; deal must DSCR.
Hard money
10% down · 12.0% · 12mo
- Down + closing
- —
- Monthly P&I
- —
- Monthly cashflow
- —
- DSCR
- —
- Eligible?
- —
Short-term bridge; refi at stabilization.
Listing history 5 events
-
2026-06-21days on market $25,000 Active 5 DOM
-
2026-06-18days on market $25,000 Active 3 DOM
-
2026-06-17days on market $25,000 Active 2 DOM
-
2026-06-16remarks 267-char remark
-
2026-06-16$25,000 Active 1 DOM
ⓘ Source: listings_history table (triggers on properties + properties_extension) + one-shot
backfill from property_details.listing_events for pre-trigger history.
Tax reassessment forecast MI · Partial reset (capped growth)
- Current annual tax
- $468 · $39/mo
- Projected year-2 tax
- $468 · $39/mo
- Expected delta
- $0/yr ($0/mo · 0.0%)
ⓘ Screening estimate from a state-policy table — verify with the county assessor before closing.
Climate risk First Street
- Flood 1/10 Low FEMA zone X (unshaded) · 0% chance over 30 yrs
- Wildfire 1/10 Low
- Heat 2/10 Low 7 d/yr ≥99°F today · 14 d/yr by 30 yrs out
- Wind 1/10 Low
- Air quality 2/10 Low 1 unhealthy d/yr today · 2 by 30 yrs out
Nearby sold comps map
Loading sold comps map…
Walkable amenities ~0.75 mi
Loading nearby amenities…
Taxation est. · year 1
- Rental income
- $11,022
- − Mortgage interest
- −$1,400
- − Property taxes
- −$468
- − Insurance
- −$125
- − Repairs & maintenance
- −$882
- − Management
- −$882
- − Depreciation
- −$727
- Taxable income
- $6,538
- Est. tax owed @ 24.0%
- −$1,569
- After-tax cash flow
- $4,972/yr
For passive investors: Depreciation is non-cash, so a rental often shows a tax loss while cash-flowing — sheltering income. Rental losses are passive: they offset passive income freely, and up to $25,000/yr can offset ordinary (W-2) income if you actively participate and your MAGI is under $100k (phasing out to $0 by $150k); unused losses carry forward. On sale, claimed depreciation is recaptured at up to 25%, and gains may owe capital-gains tax (a 1031 exchange can defer both). Figures are a year-1 estimate at your 24.0% rate — not tax advice; consult a CPA.
Schools (NCES district)
- District
- Alma Public Schools
- NCES district ID
- 2602640
- Math proficiency
- 28% ▼ -9.00%
- Reading proficiency
- 44% ▼ -3.00%
- Median HH income
- $36,651
- Composite
- 29.84/100
- National rank
- #6415
- State rank
- #288 of 540 in MI
Livability — Alma
- Score
- 69/100
- State rank
- #345
- US rank
- #8809
Category grades
Schools grade is shown separately in the Schools card above.
Census & demographics
- City population
- 13,433
- Population (ZIP)
- 13,433
Population outlook (Gratiot County) Hauer SSP2
- Today (2025)
- 39,991 people
- By 2030
- 38,944 · -2.6%
- By 2040
- 36,694 · -8.2%
- By 2050
- 34,314 · -14.2%
- By 2075
- 27,693 · -30.8%
- By 2100
- 20,809 · -48.0%
Race, ethnicity, and origin ACS 2023
- Neighborhood character
- Predominantly White (85%)
- Race & ethnicity
- White 85% Hispanic / Latino 10% Two or more races 4% Black 2% Asian 1%
- Hispanic origin (detail)
- Mexican 8%
- Common ancestry
- Romanian 5% Slovak 3% Iranian 2%
- Foreign-born
- 2% · Canada, South Korea
- Languages at home
- 94% English-only · Spanish 4% French/Haitian/Cajun 1%
Political lean MEDSL · Gratiot
- 2024 margin
- Solid R (+31.3) · D 33.7% · R 65.0% · Other 1.4%
- 2008→2024 swing
- -35.7pp toward R · 2008: 4.4pp · 2024: -31.3pp
- All cycles
- 2024: R+31.3 2020: R+28.3 2016: R+25.6 2012: R+3.9 2008: D+4.4
Not yet ingested
- Civics
- —
Market trends
- HPI YoY
- ▼ -99.16%
- Current HPI
- 210.3208
- Rent YoY
- —
- Metro
- —
- State GDP YoY
- ▲ 1.37%
- F500 in state
- 28
Industry mix (Fortune 500 HQ in MI)
| Industry | F500 HQs | Revenue |
|---|---|---|
| Automotive Parts | 3 | $48B |
|
||
| Automotive | 2 | $372B |
|
||
| Chemicals | 1 | $45B |
|
||
| Automotive Retail | 1 | $29B |
|
||
| Healthcare / Medical Devices | 1 | $23B |
|
||
| Automotive Technology | 1 | $20B |
|
||
Price history
+150.0% since first listed9 events — show timeline
- 2026-06-15 Listed $25,000 REALCOMP
- 2026-06-15 Listed $25,000 MiRealSource-MiMLS
- 2025-10-29 Sold (Public Records) $8,000 Public Records
- 2025-10-23 Sold (Public Records) $16,000 Public Records
- 2009-06-24 Sold (Public Records) $16,000 Public Records
- 2009-06-24 Sold (MLS) $16,000 MiRealSource-MiMLS
- 2009-05-05 Listed $19,900 MiRealSource-MiMLS
- 1998-05-07 Sold (Public Records) $16,900 Public Records
- 1990-03-01 Sold (Public Records) $10,000 Public Records
Cash-flow waterfall
monthlySold comps — $/sqft
last 12 mo · ≤1 miLoading sold comps…