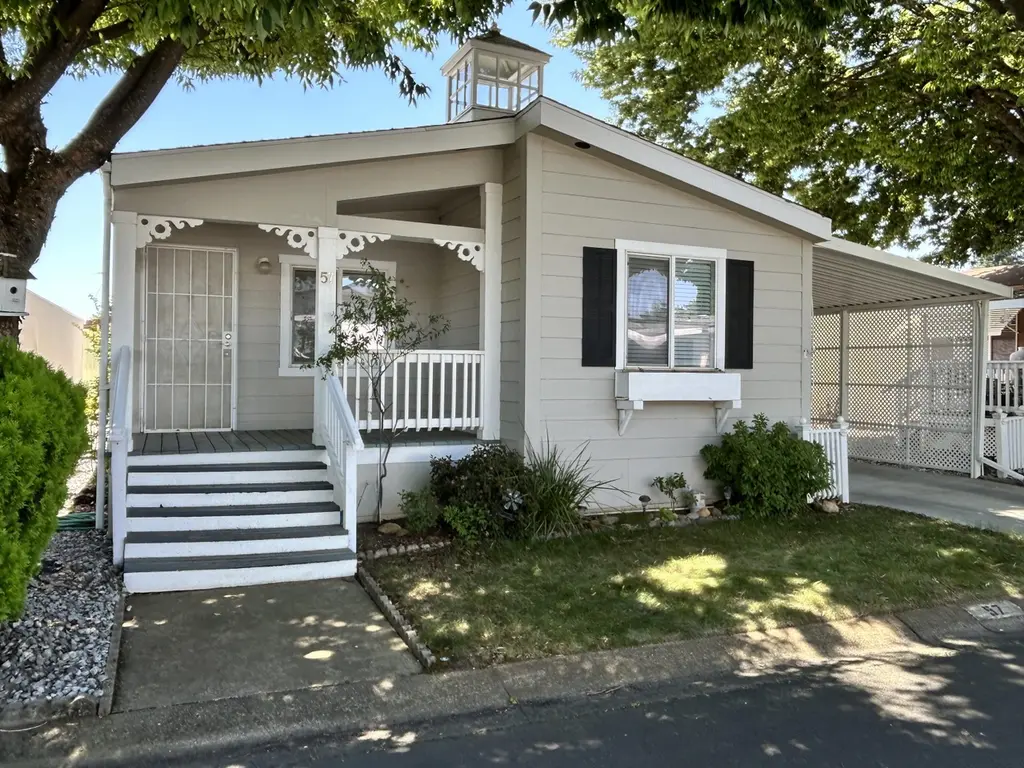
20350 Hole In One Dr Spc 57 · Redding, CA
Flood risk 1/10 · Minimal
- FEMA flood zone
- X (unshaded)
- Chance of flooding over 30 yrs
- 0.0%
- Est. flood insurance / yr
- $507 – $1,088
Fire risk 8/10 · Major
- Est. fire insurance / yr
- $659 – $1,223
Heat risk 8/10 · Major
- Hot days now (above 105°F)
- 5 days/yr
- Hot days in 30 yrs
- 12 days/yr
Wind risk 1/10 · Minimal
- Chance of severe wind over 30 yrs
- —
Air-quality risk 10/10 · Severe
- Unhealthy air days now
- 35 days/yr
- Unhealthy air days in 30 yrs
- 42 days/yr
Risk factors via First Street. Map © Google.
Why this score? — see what drove the B+ grade
The composite is a weighted blend of 9 inputs, each scored 0–100. Each bar is that input's sub-score; the figure is the points it added to the 100-point composite (weight × sub-score).
- Cash flow +30.0/30.0
- ARV discount +15.0/15.0
- 1% rule +10.0/10.0
- DSCR +10.0/10.0
- Livability +3.8/5.0
- Schools +3.1/10.0
- Rent growth +3.0/5.0
- Condition / age +2.5/5.0
- Appreciation +0.0/10.0
$82,000
🖨 Deal sheet 📄 Offer letter ✓ Due diligence
Listing remarks
One of a kind home in one of Redding's best Senior Manufactured Communities. This home stands out in style due to the owners craftsmanship! Open floor plan divides the 2 bedroom, 2 bath allowing for a private primary suite at the back of the home. If you like the look and feel of wood, you're in luck. There are wood accents throughout, including, wainscot wall accent, laminate wood flooring, beautiful trim in primary bathroom. A very nice covered front porch adds to your outdoor enjoyment. Even the shed is decorated to match the house! The carport awning is extra strong and sturdy since it was built after the 2019 snow storm that damaged so many carports. The cement driveway is newer as we
Key facts
- Covered front porch
- Rv parking
- Clubhouse
Tags
Property features AI
Finance
- HOA & community: Located within Fairway Oaks park
Exterior
- Parking: Two total parking spaces; One carport space
- Utilities: Public water
- Home design: Manufactured in-park home (mobile home); Located in Fairway Oaks mobile home park
- Construction: Composition roof; Pillar/post/pier foundation; Skirting: concrete and wood; Model: United States
- Exterior features: Awning-covered patio/porch; Deck; Asphalt road frontage; Level topography
Interior
- Kitchen: Dishwasher; Disposal; Range; Oven; Refrigerator; Down draft
- Bedrooms:
- Flooring: Vinyl; Carpet; Laminate
- Bathrooms:
- Heating & cooling: Central air conditioning; Forced air heating
- Interior features: Dishwasher; Disposal; Range; Oven; Refrigerator; Down draft
- Laundry & utility: Washer; Dryer
Neighborhood map
What this means for you Summary
Snapshot
- This is a 2-bed/2.0-bath manufactured listed at $82k.
Deal economics
- At list price, monthly cash flow is $811 ($10k/yr) — positive.
- The deal already cash-flows at list — no discount required.
- Meets the 1% rule at list price ($2k rent vs $82k).
- Recommended offer: $81k (1.5% below list) — sets the bar for market timing.
- Cap rate 18.2% vs local median 3.3% in Redding — top-decile yield for the area; either an underpriced asset or a hidden risk that comps aren't pricing in. Stress-test before assuming the spread holds.
Location & tenants
- Location reads 76/100 on livability (#106 in CA, #3,726 nationally) — a middle-class / working-renter tenant base. Strengths: amenities A+, commute A+, health & safety A+; Watch: employment C-, crime F, cost of living F.
- Pacheco Union Elementary (rural): math 30% / reading 40% proficiency, ranked #264 of 517 in CA (top 51%) — families likely to look elsewhere, expect single-tenant / working-renter base with shorter leases.
- Market conditions: Rents rising (+1.9%/yr); 286 active listings in the ZIP; 2 comparable units currently listed for rent nearby; 246 units permitted in Shasta County in 2024 (0 in 5+ unit buildings).
Forward outlook
- Local home prices are declining (-3.0%/yr); year-one equity from $567 of loan paydown is wiped out by about $2k of value loss. Plan a longer hold.
- Shasta County population projected to shrink 9% by 2050 — rents likely to lag national; underwrite the cash flow, not the appreciation.
- At projected returns (-3.0% appreciation + 1.9% rent growth), your $23k cash investment doubles in ~3 years — after that, you're playing with house money.
Negotiation context
- It's been on market 28 days — a 2% lower offer ($81k) is reasonable based on typical stale-listing flexibility.
Risks & watch-outs
- Climate carrying-cost: severe wildfire risk; extreme-heat days projected 5→12/yr by 2055 (HVAC capex compounding) — expect insurance premiums to compound above CPI over the hold.
Questions for the listing agent
- Is there a deadline driving the sale (1031 exchange, divorce, estate, relocation)? That informs how much negotiation room exists.
- Schools are B-rated — typically a magnet for longer-tenancy family renters. What's the average tenant stay here, and is there a school-zone premium baked into asking?
- Crime grade is F in this area — have there been break-ins, vandalism, or insurance claims at this property in the last 3 years? What carrier currently insures it and at what premium?
- What's the average days-on-market for RENTAL listings here right now (not sales)? A rising rental-DOM trend means longer vacancies and softer asking-rent achievability than the comps imply.
- What's the recent tenant-quality profile in this submarket — average credit score on applications, eviction rate, late-payment / NSF rate, and stable-employment percentage? A property-management company in the area should have these aggregated.
- How much new for-sale + rental construction is in the pipeline within 1–3 miles? Heavy new supply typically softens prices + rents 12–24 months out; constrained supply supports both.
Investment metrics
- 1% rule
- 1.99% ✓
- Cap rate
- 18.17%
- Cash-on-cash
- 42.40%
- DSCR
- 2.89
- GRM
- 4.2
CMA / ARV
- ARV (on-the-fly)
- $108,000
- Comps found
- 4
Show comp detail 4 sales within ~0.75 mi
| Address | Dist | Beds/Ba | Sqft | Sold | Price | $/sf | Match |
|---|---|---|---|---|---|---|---|
| 20350 Hole In 1 Dr #142 | 0.00mi | 2/2.0 | 1,000 (-7%) | 6mo | $70,000 | $70 | 83 |
| 20350 Hole In One Dr Spc 25 | 0.00mi | 2/2.0 | 960 (-11%) | 8mo | $47,500 | $49 | 75 |
| 20350 Hole In One Drive Dr #90 | 0.00mi | 3/2.0 (+1) | 1,200 (+11%) | 22mo | $120,500 | $100 | 58 |
| 20350 Hole in One Dr Dr Spc 40 | 0.00mi | 3/2.0 (+1) | 1,213 (+12%) | 24mo | $185,000 | $153 | 55 |
Match score weights: distance 35% · size 25% · config 20% · recency 20%. Top-matched comps best support the ARV.
Projected returns pro-forma
-3.0% appreciation · 1.88% rent growth · sell at horizon
- IRR
- 37.9%
- Equity multiple
- 2.59×
- Total profit
- $36,534
- Equity at exit
- $12,226
- IRR
- 43.9%
- Equity multiple
- 4.96×
- Total profit
- $90,926
- Equity at exit
- $7,090
Cash invested: $22,960 (down + closing). Projections, not guarantees.
Landlord ↔ Tenant lean methodology
- Overall (STATE)
- 18 Strongly Tenant-Friendly
- State California
- 18 Strongly Tenant-Friendly · D+13
- County
- — inherits STATE
- City
- — inherits STATE
ZIP-level market 96002
- Rents YoY
- 1.9%
- Active inventory
- 286
- Price-to-rent
- 4.2×
Monthly cashflow live
- Estimated rent
- $1,633 medium interval (Pro) →
- Mortgage (P&I)
- −$430
- Tax from tax record
- −$15 /mo · $177/yr
- Insurance
- −$34
- HOA
- −$0
- Vacancy / Maint / Mgmt
- −$343
- Net cashflow
- $811
Break-even live
UW: 25.0% down · 7.5% · 30yr · 1.5% tax · 5.0% vac · 8.0% maint · 8.0% mgmt
Financing live
Cash to close
- Down payment
- $20,500
- Closing costs
- $2,460
- Reserves months
- —
- Total cash needed
- —
Loan-product check · same deal, 3 products live
Conventional
25% down · 7.5% · 30yr
- Down + closing
- —
- Monthly P&I
- —
- Monthly cashflow
- —
- DSCR
- —
- Eligible?
- —
Personal DTI + credit; lowest rate.
DSCR
20% down · 8.5% · 30yr
- Down + closing
- —
- Monthly P&I
- —
- Monthly cashflow
- —
- DSCR
- —
- Eligible?
- —
No personal income docs; deal must DSCR.
Hard money
10% down · 12.0% · 12mo
- Down + closing
- —
- Monthly P&I
- —
- Monthly cashflow
- —
- DSCR
- —
- Eligible?
- —
Short-term bridge; refi at stabilization.
Rent comps 2 comps
| Address | Beds | Baths | Sqft | Rent | $/sqft | DOM | Units | Dist |
|---|---|---|---|---|---|---|---|---|
| 6656 Churn Creek Rd Unit M-6656 Redding, CA | 2.0 | 2.0 | 966 | $1,625 | $1.68 | 13d | 1 | 0.68mi |
| 3222 Camellia St Anderson, CA | 2.0 | 1.0 | 740 | $1,400 | $1.89 | 13d | 1 | 1.35mi |
Listing history 18 events
-
2026-06-19pricedays on market $82,000 Active 28 DOM
-
2026-06-18days on market $85,000 Active 27 DOM
-
2026-06-17days on market $85,000 Active 26 DOM
-
2026-06-16days on market $85,000 Active 25 DOM
-
2026-06-15days on market $85,000 Active 24 DOM
-
2026-06-14days on market $85,000 Active 22 DOM
-
2026-06-13days on market $85,000 Active 21 DOM
-
2026-06-10days on market $85,000 Active 19 DOM
-
2026-06-09days on market $85,000 Active 18 DOM
-
2026-06-08days on market $85,000 Active 17 DOM
-
2026-06-07days on market $85,000 Active 16 DOM
-
2026-06-05days on market $85,000 Active 13 DOM
-
2026-06-03days on market $85,000 Active 12 DOM
-
2026-06-02days on market $85,000 Active 11 DOM
-
2026-06-01days on market $85,000 Active 10 DOM
-
2026-05-31days on market $85,000 Active 9 DOM
-
2026-05-30days on market $85,000 Active 8 DOM
-
2026-05-22$85,000 Active
ⓘ Source: listings_history table (triggers on properties + properties_extension) + one-shot
backfill from property_details.listing_events for pre-trigger history.
Tax reassessment forecast CA · Resets to sale price
- Current annual tax
- $177 · $15/mo
- Projected year-2 tax
- $623 · $52/mo
- Expected delta
- +$446/yr (+$37/mo · 251.3%)
ⓘ Screening estimate from a state-policy table — verify with the county assessor before closing.
Climate risk First Street
- Flood 1/10 Low FEMA zone X (unshaded) · 0% chance over 30 yrs
- Wildfire 8/10 Severe
- Heat 8/10 Severe 5 d/yr ≥105°F today · 12 d/yr by 30 yrs out
- Wind 1/10 Low
- Air quality 10/10 Extreme 35 unhealthy d/yr today · 42 by 30 yrs out
Nearby sold comps map
Loading sold comps map…
Walkable amenities ~0.75 mi
Loading nearby amenities…
Taxation est. · year 1
- Rental income
- $19,599
- − Mortgage interest
- −$4,593
- − Property taxes
- −$177
- − Insurance
- −$410
- − Repairs & maintenance
- −$1,568
- − Management
- −$1,568
- − Depreciation
- −$2,385
- Taxable income
- $8,897
- Est. tax owed @ 24.0%
- −$2,135
- After-tax cash flow
- $7,600/yr
For passive investors: Depreciation is non-cash, so a rental often shows a tax loss while cash-flowing — sheltering income. Rental losses are passive: they offset passive income freely, and up to $25,000/yr can offset ordinary (W-2) income if you actively participate and your MAGI is under $100k (phasing out to $0 by $150k); unused losses carry forward. On sale, claimed depreciation is recaptured at up to 25%, and gains may owe capital-gains tax (a 1031 exchange can defer both). Figures are a year-1 estimate at your 24.0% rate — not tax advice; consult a CPA.
Schools (NCES district)
- District
- Pacheco Union Elementary
- NCES district ID
- 0629280
- Math proficiency
- 30% ▼ -7.00%
- Reading proficiency
- 40% ▼ -1.00%
- Median HH income
- $59,905
- Composite
- 31.26/100
- National rank
- #6025
- State rank
- #264 of 517 in CA
Livability — Redding
- Score
- 76/100
- State rank
- #106
- US rank
- #3726
Category grades
Schools grade is shown separately in the Schools card above.
Census & demographics
- Census place
- Redding, CA
- County
- Shasta County · 147,641 people
- City population
- 112,523
- Metro
- Redding, CA
- Population (ZIP)
- 33,783
- Household income
- $73,222
- Rent vs Own
- Severe rent burden
- 1026.0
Population outlook (Shasta County) Hauer SSP2
- Today (2025)
- 179,231 people
- By 2030
- 176,953 · -1.3%
- By 2040
- 169,982 · -5.2%
- By 2050
- 162,547 · -9.3%
- By 2075
- 145,649 · -18.7%
- By 2100
- 123,025 · -31.4%
Race, ethnicity, and origin ACS 2023
- Neighborhood character
- Predominantly White (72%)
- Race & ethnicity
- White 72% Hispanic / Latino 13% Two or more races 12% Asian 6% Native American 2% Black 1%
- Hispanic origin (detail)
- Mexican 10%
- Common ancestry
- Italian 4% Lithuanian 2% Slovak 2%
- Foreign-born
- 5% · Canada
- Languages at home
- 91% English-only · Spanish 4% Other Asian/Pacific 2% Other Indo-European 1%
Political lean MEDSL · Shasta
- 2024 margin
- Solid R (+36.5) · D 30.5% · R 67.0% · Other 2.5%
- 2008→2024 swing
- -10.7pp toward R · 2008: -25.8pp · 2024: -36.5pp
- All cycles
- 2024: R+36.5 2020: R+33.1 2016: R+37.4 2012: R+30.3 2008: R+25.8
Not yet ingested
- Civics
- —
Market trends
- HPI YoY
- ▼ -248.70%
- Current HPI
- 319.713
- Rent YoY
- ▲ 1.88%
- Metro
- Redding, CA
- State GDP YoY
- ▲ 3.21%
- F500 in state
- 116
Industry mix (Fortune 500 HQ in CA)
| Industry | F500 HQs | Revenue |
|---|---|---|
| Technology | 27 | $1,492B |
|
||
| Financial Services | 3 | $174B |
|
||
| Retail | 3 | $44B |
|
||
| Insurance | 3 | $26B |
|
||
| Media / Entertainment | 2 | $115B |
|
||
| Pharmaceuticals / Biotech | 2 | $62B |
|
||
Price history
1 event — show timeline
- 2026-05-22 Listed $85,000 SAOR
Property tax history
-5.5%/yrLatest (2020): $177 · -0.7% YoY. Source: county tax records.
Cash-flow waterfall
monthlySold comps — $/sqft
last 12 mo · ≤1 miLoading sold comps…