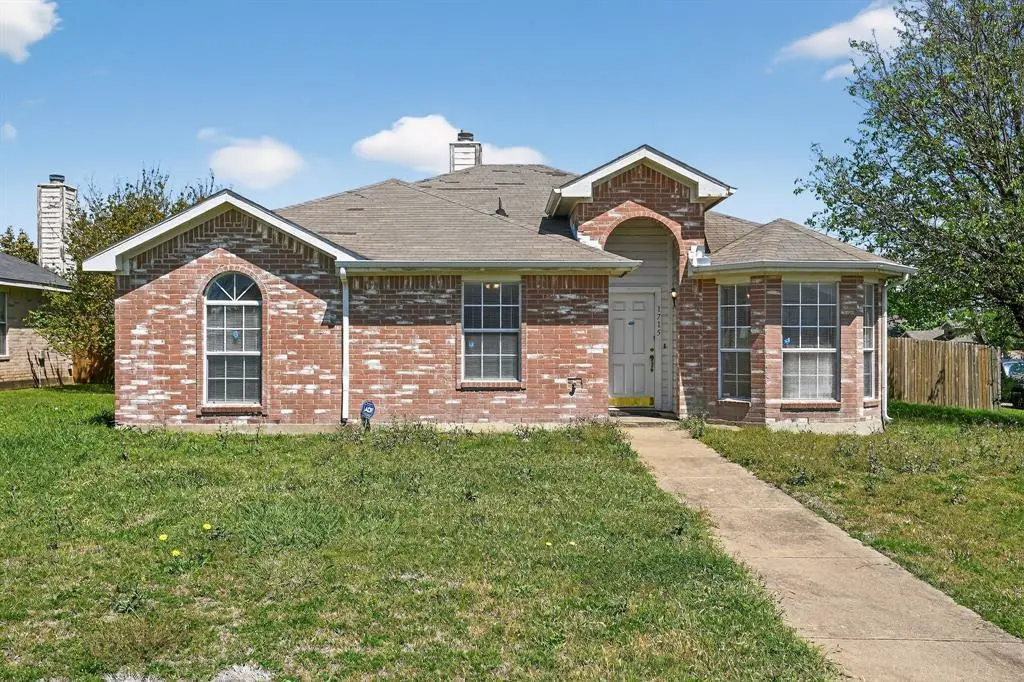
1715 Reynolds St · Lancaster, TX
Flood risk 1/10 · Minimal
- FEMA flood zone
- X (unshaded)
- Chance of flooding over 30 yrs
- 0.0%
- Est. flood insurance / yr
- $507 – $1,088
Fire risk 3/10 · Minor
- Est. fire insurance / yr
- $1,222 – $2,270
Heat risk 8/10 · Major
- Hot days now (above 110°F)
- 7 days/yr
- Hot days in 30 yrs
- 26 days/yr
Wind risk 6/10 · Moderate
- Chance of severe wind over 30 yrs
- 27.0%
Air-quality risk 2/10 · Minimal
- Unhealthy air days now
- 2 days/yr
- Unhealthy air days in 30 yrs
- 2 days/yr
Risk factors via First Street. Map © Google.
Why this score? — see what drove the D- grade
The composite is a weighted blend of 9 inputs, each scored 0–100. Each bar is that input's sub-score; the figure is the points it added to the 100-point composite (weight × sub-score).
- ARV discount +11.6/15.0
- Cash flow +10.9/30.0
- 1% rule +4.0/10.0
- DSCR +3.1/10.0
- Livability +3.1/5.0
- Rent growth +2.6/5.0
- Condition / age +2.5/5.0
- Schools +2.1/10.0
- Appreciation +0.0/10.0
$240,000
🖨 Deal sheet 📄 Offer letter ✓ Due diligence
Listing remarks MLS
Welcome to 1715 Reynolds Street, a beautifully maintained and spacious single-family residence located in the heart of the desirable Wellington Park North community in Lancaster. This 2001-built traditional home offers 1,601 square feet of comfortable living space, designed with a functional and open-concept layout that is perfect for modern lifestyles. The interior features a large, light-filled living area that flows effortlessly into the kitchen and dining spaces, making it an ideal home for entertaining. Retreat to the primary suite which offers a private sanctuary, while the additional bedrooms provide ample space for family, guests, or a dedicated home office. Stay cool during the Texas summers with a reliable central electric cooling system and energy-efficient ceiling fans throughout. The exterior boasts a classic aesthetic with professional landscaping and a private, fenced-in backyard that is ready for your next outdoor gathering. Enjoy the convenience of full city utilities, including public water and sewer. Situated just minutes from Rosa Parks-Millbrook Elementary and with easy access to local parks, dining, and major highways, this home offers the perfect balance of suburban tranquility and city accessibility. Move-in ready and waiting for its next owners!
Key facts
- Full city utilities
- Move in ready
- 8,233 sq ft lot
Tags
Neighborhood map
What this means for you Summary
Snapshot
- This is a 3-bed/2.0-bath single-family listed at $240k.
Deal economics
- At list price, monthly cash flow is $-107 ($-1k/yr) — negative.
- To cash-flow at today's rent, offer at most $221k (7.9% below list).
- To meet the 1% rule (rent ≥ 1% of price), the offer needs to be $217k (9.6% below list).
- Recommended offer: $217k (9.6% below list) — sets the bar for 1% rule.
Location & tenants
- Location reads 62/100 on livability (#926 in TX) — a middle-class / working-renter tenant base. Strengths: cost of living A+, housing A+; Watch: employment C-, schools D, crime F.
- Lancaster ISD (suburban): math 19% / reading 29% proficiency, ranked #714 of 826 in TX (top 86%) — low school quality limits family demand, transient renter base, plan for 1-2y turnover; 78% free/reduced lunch — lower-income household profile, screen leases tightly.
- Market conditions: Rents flat; 102 active listings in the ZIP; 40 comparable units currently listed for rent nearby; rentals at typical pace (median 25d on market — plan ~3-4 weeks tenant-placement turnaround); 12,577 units permitted in Dallas County in 2024 (6,829 in 5+ unit buildings).
- This rent runs 37% of the median local income ($70k/yr) — at the standard rent-burdened threshold; future hikes will face affordability resistance.
Forward outlook
- Local home prices are declining (-3.0%/yr); year-one equity from $2k of loan paydown is wiped out by about $7k of value loss. Plan a longer hold.
- Dallas County population projected at +35% by 2050 — long-run rental-demand tailwind backs the buy-and-hold thesis.
Negotiation context
- It's been on market 58 days — a 3% lower offer ($233k) is reasonable based on typical stale-listing flexibility.
- 2 sale attempts since 22y ago with the ask held roughly flat each time — persistent listings suggest the price (not the market) is what's stuck; bring a comps-based counter.
Risks & watch-outs
- Climate carrying-cost: major wind risk, 27% chance of damaging wind over 30y; extreme-heat days projected 7→26/yr by 2055 (HVAC capex compounding) — expect insurance premiums to compound above CPI over the hold.
Questions for the listing agent
- What do current leases actually rent for vs. the listed asking? Can we see a recent rent roll and the last 12 months of T-12 income?
- It's been on market 58 days. Have you received any prior offers? Is the seller open to a 10% concession, seller financing, or rate buy-down credit?
- What does the HOA fee cover, when was the last increase, and are there any pending special assessments or reserve-fund shortfalls?
- Is there a deadline driving the sale (1031 exchange, divorce, estate, relocation)? That informs how much negotiation room exists.
- Schools are D-rated, which usually means shorter tenancies and higher turnover. Who's the typical renter profile here, and what's been the actual vacancy rate?
- Crime grade is F in this area — have there been break-ins, vandalism, or insurance claims at this property in the last 3 years? What carrier currently insures it and at what premium?
- The area grade is low — what's the realistic commute time and amenity access for the typical tenant pool here? Any planned neighborhood developments (good or bad) we should know about?
- What's the average days-on-market for RENTAL listings here right now (not sales)? A rising rental-DOM trend means longer vacancies and softer asking-rent achievability than the comps imply.
- What's the recent tenant-quality profile in this submarket — average credit score on applications, eviction rate, late-payment / NSF rate, and stable-employment percentage? A property-management company in the area should have these aggregated.
- How much new for-sale + rental construction is in the pipeline within 1–3 miles? Heavy new supply typically softens prices + rents 12–24 months out; constrained supply supports both.
Investment metrics
- 1% rule
- 0.90% ✗
- Cap rate
- 5.76%
- Cash-on-cash
- -1.91%
- DSCR
- 0.91
- GRM
- 9.2
CMA / ARV
- ARV (median comp)
- $263,973
- List price
- $240,000
- Delta
- -9.08%
- Verdict
- FAIR
- Comps
- 20 within 1.0 mi
Show comp detail 12 sales within ~0.75 mi
| Address | Dist | Beds/Ba | Sqft | Sold | Price | $/sf | Match |
|---|---|---|---|---|---|---|---|
| 1759 Reynolds St | 0.13mi | 3/2.0 | 1,472 (+5%) | 2mo | $260,000 | $177 | 84 |
| 1542 Sunny Meadow Rd | 0.50mi | 3/2.0 | 1,453 (+3%) | 4mo | $244,900 | $169 | 68 |
| 1518 Rockbrook St | 0.23mi | 3/1.5 | 1,242 (-12%) | 4mo | $250,000 | $201 | 64 |
| 1411 Oakbrook St | 0.42mi | 4/2.0 (+1) | 1,356 (-4%) | 9mo | $249,900 | $184 | 62 |
| 1538 Oakbrook St | 0.34mi | 3/2.0 | 1,226 (-13%) | 2mo | $220,000 | $179 | 61 |
| 1425 Sunnymeadow Rd | 0.65mi | 3/2.0 | 1,453 (+3%) | 6mo | $245,000 | $169 | 60 |
| 1513 Oakbrook Ct | 0.28mi | 4/1.5 (+1) | 1,242 (-12%) | 4mo | $240,000 | $193 | 57 |
| 1443 Chapman Dr | 0.30mi | 3/2.0 | 1,583 (+12%) | 17mo | $259,900 | $164 | 51 |
| 1319 Oakbrook St | 0.49mi | 3/1.5 | 1,212 (-14%) | 11mo | $204,000 | $168 | 43 |
| 2712 Murphy Dr | 0.69mi | 3/2.0 | 1,593 (+13%) | 11mo | $269,900 | $169 | 37 |
| 924 Bayport Dr | 0.73mi | 4/2.0 (+1) | 1,536 (+9%) | 14mo | $375,000 | $244 | 34 |
| 2506 Sunnymeadow Rd | 0.59mi | 4/1.0 (+1) | 1,536 (+9%) | 17mo | $105,000 | $68 | 34 |
Match score weights: distance 35% · size 25% · config 20% · recency 20%. Top-matched comps best support the ARV.
Projected returns pro-forma
-3.0% appreciation · 0.33% rent growth · sell at horizon
- IRR
- -22.8%
- Equity multiple
- 0.24×
- Total profit
- $-51,251
- Equity at exit
- $35,785
- IRR
- -27.1%
- Equity multiple
- -0.12×
- Total profit
- $-74,956
- Equity at exit
- $20,751
Cash invested: $67,200 (down + closing). Projections, not guarantees.
Landlord ↔ Tenant lean methodology
- Overall (STATE)
- 87 Strongly Landlord-Friendly
- State Texas
- 87 Strongly Landlord-Friendly · R+5
- County
- — inherits STATE
- City
- — inherits STATE
ZIP-level market 75134
- Home prices YoY
- -17.1%
- Rents YoY
- 0.3%
- Active inventory
- 102
- Price-to-rent
- 9.2×
Monthly cashflow live
- Estimated rent
- $2,170 high interval (Pro) →
- Mortgage (P&I)
- −$1,259
- Tax from tax record
- −$455 /mo · $5,461/yr
- Insurance
- −$100
- HOA
- −$8
- Vacancy / Maint / Mgmt
- −$456
- Net cashflow
- $-107
Break-even live
UW: 25.0% down · 7.5% · 30yr · 1.5% tax · 5.0% vac · 8.0% maint · 8.0% mgmt
Financing live
Cash to close
- Down payment
- $60,000
- Closing costs
- $7,200
- Reserves months
- —
- Total cash needed
- —
Loan-product check · same deal, 3 products live
Conventional
25% down · 7.5% · 30yr
- Down + closing
- —
- Monthly P&I
- —
- Monthly cashflow
- —
- DSCR
- —
- Eligible?
- —
Personal DTI + credit; lowest rate.
DSCR
20% down · 8.5% · 30yr
- Down + closing
- —
- Monthly P&I
- —
- Monthly cashflow
- —
- DSCR
- —
- Eligible?
- —
No personal income docs; deal must DSCR.
Hard money
10% down · 12.0% · 12mo
- Down + closing
- —
- Monthly P&I
- —
- Monthly cashflow
- —
- DSCR
- —
- Eligible?
- —
Short-term bridge; refi at stabilization.
Rent comps 40 comps
| Address | Beds | Baths | Sqft | Rent | $/sqft | DOM | Units | Dist |
|---|---|---|---|---|---|---|---|---|
| 1750 Oneal St Lancaster, TX | 3.0 | 2.0 | 1460 | $2,100 | $1.44 | 43d | 1 | 0.15mi |
| 1748 Cansler Ln Lancaster, TX | 4.0 | 2.0 | 1806 | $2,195 | $1.22 | 43d | 1 | 0.18mi |
| 1555 Willowbrook St Lancaster, TX | 3.0 | 2.0 | 1544 | $1,759 | $1.14 | 22d | 1 | 0.20mi |
| 1811 Kings Cross Dr Lancaster, TX | 4.0 | 2.0 | 1812 | $2,200 | $1.21 | 24d | 1 | 0.30mi |
| 1424 Chapman Dr Lancaster, TX | 3.0 | 2.0 | 1820 | $2,099 | $1.15 | 24d | 1 | 0.32mi |
| 1861 Serena Dr Lancaster, TX | 3.0 | 2.0 | 1731 | $2,350 | $1.36 | 2d | 1 | 0.41mi |
| 1532 Linda Ln Lancaster, TX | 3.0 | 2.0 | 1380 | $2,000 | $1.45 | 24d | 1 | 0.63mi |
| 1533 Prescott Dr Lancaster, TX | 3.0 | 2.0 | 1500 | $1,975 | $1.32 | 4d | 1 | 0.71mi |
| 1255 W Pleasant Run Rd Lancaster, TX | 1.0–2.0 | 1.0–2.0 | 802 | $1,450 | $1.81 | 7d | 10 | 0.75mi |
| 2912 Crimson Clover Dr Lancaster, TX | 3.0 | 2.0 | 1735 | $2,075 | $1.20 | 7d | 1 | 0.78mi |
| 1447 Gentle Rain Dr Lancaster, TX | 3.0 | 2.0 | 1735 | $2,200 | $1.27 | 7d | 1 | 0.79mi |
| 2217 Midbury Dr Lancaster, TX | 3.0 | 2.0 | 1603 | $2,150 | $1.34 | 17d | 1 | 0.81mi |
| 1252 Payne Dr Lancaster, TX | 4.0 | 2.0 | 1577 | $2,239 | $1.42 | 3d | 1 | 0.89mi |
| 1244 Flower Ridge Dr Lancaster, TX | 3.0 | 2.0 | 1818 | $2,099 | $1.15 | 43d | 1 | 0.95mi |
| 1605 N Houston School Rd Lancaster, TX | 2.0–4.0 | 2.0 | 1125 | $2,412 | $2.14 | 1d | 39 | 0.97mi |
| 3124 Crimson Clover Dr Lancaster, TX | 3.0 | 2.0 | 1783 | $2,100 | $1.18 | 43d | 1 | 0.98mi |
| 1934 Mosley Dr Lancaster, TX | 4.0 | 2.0 | 1754 | $2,099 | $1.20 | 24d | 1 | 1.06mi |
| 1373 Oakbluff Dr Lancaster, TX | 3.0 | 2.0 | 1289 | $1,850 | $1.44 | 3d | 1 | 1.13mi |
| 1021 Badger Run Lancaster, TX | 3.0 | 2.0 | 1811 | $2,235 | $1.23 | 43d | 1 | 1.13mi |
| 1125 Greenbriar Ln Lancaster, TX | 3.0 | 2.0 | 1744 | $1,825 | $1.05 | 7d | 1 | 1.16mi |
| 2746 Town North Dr Lancaster, TX | 4.0 | 2.0 | 1377 | $2,000 | $1.45 | 7d | 1 | 1.18mi |
| 1225 Oakbluff Dr Lancaster, TX | 3.0 | 2.0 | 1335 | $1,895 | $1.42 | 4d | 1 | 1.22mi |
| 2720 Wild Grove Ln Unit 1340976P Lancaster, TX | 4.0 | 2.0 | 1732 | $15,834 | $9.14 | 22d | 1 | 1.27mi |
| 2720 Wild Grove Ln Lancaster, TX | 4.0 | 2.0 | 1733 | $8,750 | $5.05 | 43d | 1 | 1.27mi |
| 833 Stanford Dr Lancaster, TX | 3.0 | 1.0 | 1008 | $1,725 | $1.71 | 43d | 1 | 1.29mi |
| 834 Apple Valley Dr Lancaster, TX | 3.0 | 2.0 | 1425 | $2,275 | $1.60 | 43d | 1 | 1.34mi |
| 2827 Saint Martin Dr Lancaster, TX | 3.0 | 2.0 | 1421 | $2,400 | $1.69 | 43d | 1 | 1.35mi |
| 2617 Arcady Cir Lancaster, TX | 3.0 | 2.0 | 1361 | $1,950 | $1.43 | 20d | 1 | 1.36mi |
| 2617 Arcady Cir Lancaster, TX | 3.0 | 2.0 | 1361 | $1,950 | $1.43 | 43d | 1 | 1.36mi |
| 2654 Hartford Ln Lancaster, TX | 4.0 | 2.0 | 1657 | $2,015 | $1.22 | 43d | 1 | 1.36mi |
| 2922 E Pepperidge Dr Lancaster, TX | 4.0 | 2.0 | 1444 | $2,000 | $1.39 | 43d | 1 | 1.37mi |
| 907 Cresthaven Dr Lancaster, TX | 3.0 | 2.0 | 1366 | $1,850 | $1.35 | 24d | 1 | 1.39mi |
| 1326 Johns Ave Lancaster, TX | 4.0 | 2.0 | 1236 | $2,100 | $1.70 | 43d | 1 | 1.42mi |
| 2843 Saint Johns Ave Lancaster, TX | 3.0 | 2.0 | 1532 | $2,250 | $1.47 | 43d | 1 | 1.44mi |
| 2843 Saint Johns Ave Lancaster, TX | 3.0 | 2.5 | 1532 | $2,095 | $1.37 | 5d | 1 | 1.44mi |
| 721 Lindenwood Dr Lancaster, TX | 3.0 | 2.0 | 1606 | $1,895 | $1.18 | 7d | 1 | 1.45mi |
| 721 Lindenwood Dr Lancaster, TX | 3.0 | 2.0 | 1606 | $1,895 | $1.18 | 15d | 1 | 1.45mi |
| 2858 Saint Thomas Ln Lancaster, TX | 3.0 | 2.0 | 1530 | $1,950 | $1.27 | 24d | 1 | 1.46mi |
| 719 Westover Dr Lancaster, TX | 3.0 | 2.0 | 1248 | $1,900 | $1.52 | 24d | 1 | 1.47mi |
| 1218 Jewell Ln Lancaster, TX | 4.0 | 2.0 | 1854 | $2,071 | $1.12 | 7d | 1 | 1.48mi |
HOA detail
- Monthly dues
- $8 · $96/yr
- Likely covers
- watersewerelectriclandscaping
Listing history 18 events
-
2026-06-18days on market $240,000 Active 58 DOM
-
2026-06-17days on market $240,000 Active 57 DOM
-
2026-06-16days on market $240,000 Active 56 DOM
-
2026-06-15days on market $240,000 Active 55 DOM
-
2026-06-13days on market $240,000 Active 53 DOM
-
2026-06-09days on market $240,000 Active 49 DOM
-
2026-06-08days on market $240,000 Active 48 DOM
-
2026-06-07days on market $240,000 Active 47 DOM
-
2026-06-04days on market $240,000 Active 44 DOM
-
2026-06-03days on market $240,000 Active 43 DOM
-
2026-06-02days on market $240,000 Active 42 DOM
-
2026-06-01days on market $240,000 Active 41 DOM
-
2026-05-31days on market $240,000 Active 40 DOM
-
2026-04-21$250,000 Active 1296-char remark
Show marketing remark (1296 chars)
Welcome to 1715 Reynolds Street, a beautifully maintained and spacious single-family residence located in the heart of the desirable Wellington Park North community in Lancaster. This 2001-built traditional home offers 1,601 square feet of comfortable living space, designed with a functional and open-concept layout that is perfect for modern lifestyles. The interior features a large, light-filled living area that flows effortlessly into the kitchen and dining spaces, making it an ideal home for entertaining. Retreat to the primary suite which offers a private sanctuary, while the additional bedrooms provide ample space for family, guests, or a dedicated home office. Stay cool during the Texas summers with a reliable central electric cooling system and energy-efficient ceiling fans throughout. The exterior boasts a classic aesthetic with professional landscaping and a private, fenced-in backyard that is ready for your next outdoor gathering. Enjoy the convenience of full city utilities, including public water and sewer. Situated just minutes from Rosa Parks-Millbrook Elementary and with easy access to local parks, dining, and major highways, this home offers the perfect balance of suburban tranquility and city accessibility. Move-in ready and waiting for its next owners!
-
2005-05-13soldstatus
-
2005-04-19soldstatus 279-char remark
Show marketing remark (279 chars)
HUD HOME TO BE SOLD AS IS. SELLING BROKER COMM UP TO 5%. BLB COMM . 49%. BID DEADLINE: 01/11/05. CASE #: 491-737347. HUD CONTRACTS/ADDENDUMS, AVAILABILITY & SPECIFIC INSTRUCTIONS AT WWW. FIRSTPRESTON. COM OR HUD. GOV OR CALL 800-260-3760. ESCROW: $3,025. LO/IE
-
2005-01-18historical 279-char remark
Show marketing remark (279 chars)
HUD HOME TO BE SOLD AS IS. SELLING BROKER COMM UP TO 5%. BLB COMM . 49%. BID DEADLINE: 01/11/05. CASE #: 491-737347. HUD CONTRACTS/ADDENDUMS, AVAILABILITY & SPECIFIC INSTRUCTIONS AT WWW. FIRSTPRESTON. COM OR HUD. GOV OR CALL 800-260-3760. ESCROW: $3,025. LO/IE
-
2004-11-18$90,900 279-char remark
Show marketing remark (279 chars)
HUD HOME TO BE SOLD AS IS. SELLING BROKER COMM UP TO 5%. BLB COMM . 49%. BID DEADLINE: 01/11/05. CASE #: 491-737347. HUD CONTRACTS/ADDENDUMS, AVAILABILITY & SPECIFIC INSTRUCTIONS AT WWW. FIRSTPRESTON. COM OR HUD. GOV OR CALL 800-260-3760. ESCROW: $3,025. LO/IE
ⓘ Source: listings_history table (triggers on properties + properties_extension) + one-shot
backfill from property_details.listing_events for pre-trigger history.
Tax reassessment forecast TX · Resets to sale price
- Current annual tax
- $5,461 · $455/mo
- Projected year-2 tax
- $5,461 · $455/mo
- Expected delta
- $0/yr ($0/mo · 0.0%)
ⓘ Screening estimate from a state-policy table — verify with the county assessor before closing.
Climate risk First Street
- Flood 1/10 Low FEMA zone X (unshaded) · 0% chance over 30 yrs
- Wildfire 3/10 Moderate
- Heat 8/10 Severe 7 d/yr ≥110°F today · 26 d/yr by 30 yrs out
- Wind 6/10 Major 27% chance of damaging wind over 30 yrs
- Air quality 2/10 Low 2 unhealthy d/yr today · 2 by 30 yrs out
Nearby sold comps map
Loading sold comps map…
Walkable amenities ~0.75 mi
Loading nearby amenities…
Taxation est. · year 1
- Rental income
- $26,045
- − Mortgage interest
- −$13,444
- − Property taxes
- −$5,461
- − Insurance
- −$1,200
- − Repairs & maintenance
- −$2,084
- − Management
- −$2,084
- − HOA
- −$96
- − Depreciation
- −$6,982
- Taxable loss
- −$5,304
- Est. tax savings @ 24.0%
- +$1,273
- After-tax cash flow
- $-11/yr
For passive investors: Depreciation is non-cash, so a rental often shows a tax loss while cash-flowing — sheltering income. Rental losses are passive: they offset passive income freely, and up to $25,000/yr can offset ordinary (W-2) income if you actively participate and your MAGI is under $100k (phasing out to $0 by $150k); unused losses carry forward. On sale, claimed depreciation is recaptured at up to 25%, and gains may owe capital-gains tax (a 1031 exchange can defer both). Figures are a year-1 estimate at your 24.0% rate — not tax advice; consult a CPA.
Schools (NCES district)
- District
- Lancaster ISD
- NCES district ID
- 4826670
- Math proficiency
- 19% ▼ -29.00%
- Reading proficiency
- 29% ▼ -11.00%
- Median HH income
- $52,275
- Composite
- 21.41/100
- National rank
- #8349
- State rank
- #714 of 826 in TX
Livability — Lancaster
- Score
- 62/100
- State rank
- #926
- US rank
- #16461
Category grades
Schools grade is shown separately in the Schools card above.
Census & demographics
- Census place
- Lancaster, TX
- County
- Dallas County · 2,612,404 people
- City population
- 44,142
- Metro
- Dallas-Fort Worth-Arlington, TX
- Population (ZIP)
- 19,045
- Household income
- $69,778
- Rent vs Own
- Severe rent burden
- 399.0
Population outlook (Dallas County) Hauer SSP2
- Today (2025)
- 2,979,839 people
- By 2030
- 3,191,823 · +7.1%
- By 2040
- 3,619,611 · +21.5%
- By 2050
- 4,026,915 · +35.1%
- By 2075
- 4,957,073 · +66.4%
- By 2100
- 5,508,725 · +84.9%
Race, ethnicity, and origin ACS 2023
- Neighborhood character
- Predominantly Black (68%)
- Race & ethnicity
- Black 68% Hispanic / Latino 22% Two or more races 9% White 8%
- Hispanic origin (detail)
- Mexican 20%
- Common ancestry
- Slovak 1%
- Foreign-born
- 9% · Canada
- Languages at home
- 79% English-only · Spanish 20%
Political lean MEDSL · Dallas
- 2024 margin
- Strong D (+22.2) · D 60.2% · R 38.0% · Other 1.8%
- 2008→2024 swing
- +6.9pp toward D · 2008: 15.3pp · 2024: 22.2pp
- All cycles
- 2024: D+22.2 2020: D+31.6 2016: D+26.2 2012: D+15.4 2008: D+15.3
Not yet ingested
- Civics
- —
Market trends
- HPI YoY
- ▼ -66.51%
- Current HPI
- 323.4396
- Rent YoY
- ▲ 0.33%
- Metro
- Dallas-Fort Worth-Arlington, TX
- State GDP YoY
- ▲ 3.95%
- F500 in state
- 110
Industry mix (Fortune 500 HQ in TX)
| Industry | F500 HQs | Revenue |
|---|---|---|
| Energy | 16 | $1,198B |
|
||
| Technology | 5 | $198B |
|
||
| Engineering / Construction | 4 | $72B |
|
||
| Energy Services | 3 | $60B |
|
||
| Utilities | 3 | $41B |
|
||
| Healthcare | 2 | $330B |
|
||
Price history
+175.0% since first listed5 events — show timeline
- 2026-04-21 Listed $250,000 NTREIS
- 2005-05-13 Sold (Public Records) — Public Records
- 2005-04-19 Sold (MLS) — NTREIS
- 2005-01-18 Listing Removed — NTREIS
- 2004-11-18 Listed $90,900 NTREIS
Property tax history
+5.3%/yrLatest (2025): $5,461 · -5.5% YoY. Source: county tax records.
Cash-flow waterfall
monthlySold comps — $/sqft
last 12 mo · ≤1 miLoading sold comps…