 🏷️ Likely Rental
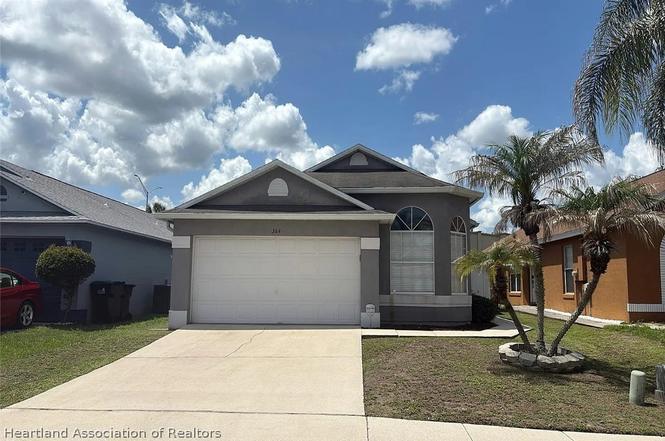
364 Briar Bay Cir · Alafaya, FL
Flood risk 1/10 · Minimal
- FEMA flood zone
- X (unshaded)
- Chance of flooding over 30 yrs
- 0.0%
- Est. flood insurance / yr
- $507 – $1,088
Fire risk 3/10 · Minor
- Est. fire insurance / yr
- $947 – $1,759
Heat risk 8/10 · Major
- Hot days now (above 108°F)
- 7 days/yr
- Hot days in 30 yrs
- 21 days/yr
Wind risk 9/10 · Severe
- Chance of severe wind over 30 yrs
- 99.0%
Air-quality risk 2/10 · Minimal
- Unhealthy air days now
- 1 days/yr
- Unhealthy air days in 30 yrs
- 1 days/yr
Risk factors via First Street. Map © Google.
Why this score? — see what drove the D+ grade
The composite is a weighted blend of 9 inputs, each scored 0–100. Each bar is that input's sub-score; the figure is the points it added to the 100-point composite (weight × sub-score).
- Cash flow +15.0/30.0
- ARV discount +7.5/15.0
- 1% rule +5.0/10.0
- DSCR +5.0/10.0
- Schools +4.1/10.0
- Livability +4.1/5.0
- Rent growth +3.2/5.0
- Condition / age +2.5/5.0
- Appreciation +0.0/10.0
$5,000
🖨 Deal sheet 📄 Offer letter ✓ Due diligence
Listing remarks MLS
SHORT SALE. 3/2 home in East Orlando. Close to UCF, Waterford Lakes, all major roads & excellent schools. Beautiful home with large windows and natural sunlight! Beautiful master bath with his and her sinks and an extra large oval tub. Needs a little TLC.
Key facts
- 4,356 sq ft lot
- 2 garage spots
- Built 1998
Property features AI
Finance
- Other: Zoning: P-D
Exterior
- Parking: 2-car garage
- Utilities: Other water source; Other sewer
- Home design: Single-family residence; One story; Residential property
- Construction: Construction materials: see remarks
- Exterior features: Front porch; Other roof
Interior
- Bedrooms: 1 total room
- Flooring: Other
- Bathrooms: 2 full bathrooms
- Heating & cooling: No heating; No cooling
- Interior features: Other flooring
Neighborhood map
What this means for you Summary
Snapshot
- This is a 3-bed/2.0-bath single-family listed at $5k.
Deal economics
- At list price, monthly cash flow is $2k ($21k/yr) — positive.
- The deal already cash-flows at list — no discount required.
- Meets the 1% rule at list price ($2k rent vs $5k).
- Cap rate 422.4% vs local median 3.5% in Alafaya — top-decile yield for the area; either an underpriced asset or a hidden risk that comps aren't pricing in. Stress-test before assuming the spread holds.
Location & tenants
- Location reads 82/100 on livability (#60 in FL, #1,076 nationally) — a professional / high-income tenant draw. Strengths: housing A+, health & safety A+, crime A; Watch: cost of living C-, schools D+.
- Orange (suburban): math 46% / reading 51% proficiency, ranked #43 of 73 in FL (top 59%) — families likely to look elsewhere, expect single-tenant / working-renter base with shorter leases.
- Market conditions: Rents rising (+2.8%/yr); 279 active listings in the ZIP; 28 comparable units currently listed for rent nearby; rentals at typical pace (median 18d on market — plan ~3-4 weeks tenant-placement turnaround); solid renter incomes; 8,053 units permitted in Orange County in 2024 (3,133 in 5+ unit buildings).
- This rent runs 33% of the median local income ($82k/yr) — at the standard rent-burdened threshold; future hikes will face affordability resistance.
Forward outlook
- Local home prices are declining (-3.0%/yr); year-one equity from $35 of loan paydown is wiped out by about $150 of value loss. Plan a longer hold.
- Orange County population projected at +52% by 2050 — long-run rental-demand tailwind backs the buy-and-hold thesis.
- At projected returns (-3.0% appreciation + 2.8% rent growth), your $1k cash investment doubles in ~1 year — after that, you're playing with house money.
Negotiation context
- Only 3 days on market — expect competitive offers; lowballing is unlikely to land.
- 4 sale attempts since 20y ago with the ask held roughly flat each time — persistent listings suggest the price (not the market) is what's stuck; bring a comps-based counter.
Risks & watch-outs
- Climate carrying-cost: severe wind risk, 99% chance of damaging wind over 30y; extreme-heat days projected 7→21/yr by 2055 (HVAC capex compounding) — expect insurance premiums to compound above CPI over the hold.
Questions for the listing agent
- Is there a deadline driving the sale (1031 exchange, divorce, estate, relocation)? That informs how much negotiation room exists.
- Schools are D-rated, which usually means shorter tenancies and higher turnover. Who's the typical renter profile here, and what's been the actual vacancy rate?
- The area grade is low — what's the realistic commute time and amenity access for the typical tenant pool here? Any planned neighborhood developments (good or bad) we should know about?
- What's the average days-on-market for RENTAL listings here right now (not sales)? A rising rental-DOM trend means longer vacancies and softer asking-rent achievability than the comps imply.
- What's the recent tenant-quality profile in this submarket — average credit score on applications, eviction rate, late-payment / NSF rate, and stable-employment percentage? A property-management company in the area should have these aggregated.
- How much new for-sale + rental construction is in the pipeline within 1–3 miles? Heavy new supply typically softens prices + rents 12–24 months out; constrained supply supports both.
Investment metrics
- 1% rule
- 44.77% ✓
- Cap rate
- 422.40%
- Cash-on-cash
- 1486.09%
- DSCR
- 67.12
- GRM
- 0.2
CMA / ARV
- ARV (on-the-fly)
- $336,399
- Comps found
- 6
Show comp detail 6 sales within ~0.75 mi
| Address | Dist | Beds/Ba | Sqft | Sold | Price | $/sf | Match |
|---|---|---|---|---|---|---|---|
| 385 Briar Bay Cir | 0.05mi | 3/2.0 | 1,363 (+1%) | 1mo | $310,000 | $227 | 96 |
| 10574 Jane Eyre Dr | 0.23mi | 3/2.0 | 1,374 (+2%) | 13mo | $327,500 | $238 | 76 |
| 501 Pointe Allyson Way | 0.43mi | 3/2.0 | 1,468 (+9%) | 2mo | $365,000 | $249 | 63 |
| 10758 Wildlife Pl | 0.42mi | 3/2.0 | 1,157 (-14%) | 12mo | $340,000 | $294 | 46 |
| 10819 Wildlife Pl | 0.43mi | 3/2.0 | 1,495 (+11%) | 22mo | $395,500 | $265 | 44 |
| 10436 Jepson St | 0.38mi | 3/2.5 | 1,512 (+12%) | 20mo | $370,000 | $245 | 44 |
Match score weights: distance 35% · size 25% · config 20% · recency 20%. Top-matched comps best support the ARV.
Projected returns pro-forma
-3.0% appreciation · 2.77% rent growth · sell at horizon
- IRR
- —
- Equity multiple
- 78.95×
- Total profit
- $109,132
- Equity at exit
- $746
- IRR
- —
- Equity multiple
- 169.03×
- Total profit
- $235,246
- Equity at exit
- $432
Cash invested: $1,400 (down + closing). Projections, not guarantees.
Landlord ↔ Tenant lean methodology
- Overall (STATE)
- 87 Strongly Landlord-Friendly
- State Florida
- 87 Strongly Landlord-Friendly · R+3
- County
- — inherits STATE
- City
- — inherits STATE
ZIP-level market 32825
- Rents YoY
- 2.8%
- Active inventory
- 279
- Price-to-rent
- 0.2×
Monthly cashflow live
- Estimated rent
- $2,238 high interval (Pro) →
- Mortgage (P&I)
- −$26
- Tax est. 1.5%
- −$6 /mo · $75/yr
- Insurance
- −$2
- HOA
- −$0
- Vacancy / Maint / Mgmt
- −$470
- Net cashflow
- $1,734
Break-even live
UW: 25.0% down · 7.5% · 30yr · 1.5% tax · 5.0% vac · 8.0% maint · 8.0% mgmt
Financing live
Cash to close
- Down payment
- $1,250
- Closing costs
- $150
- Reserves months
- —
- Total cash needed
- —
Loan-product check · same deal, 3 products live
Conventional
25% down · 7.5% · 30yr
- Down + closing
- —
- Monthly P&I
- —
- Monthly cashflow
- —
- DSCR
- —
- Eligible?
- —
Personal DTI + credit; lowest rate.
DSCR
20% down · 8.5% · 30yr
- Down + closing
- —
- Monthly P&I
- —
- Monthly cashflow
- —
- DSCR
- —
- Eligible?
- —
No personal income docs; deal must DSCR.
Hard money
10% down · 12.0% · 12mo
- Down + closing
- —
- Monthly P&I
- —
- Monthly cashflow
- —
- DSCR
- —
- Eligible?
- —
Short-term bridge; refi at stabilization.
Rent comps 28 comps
| Address | Beds | Baths | Sqft | Rent | $/sqft | DOM | Units | Dist |
|---|---|---|---|---|---|---|---|---|
| 10600 Bloomfield Dr Orlando, FL | 1.0–3.0 | 1.0–2.0 | 938 | $2,310 | $2.46 | 1d | 22 | 0.31mi |
| 10665 Huntridge Rd Orlando, FL | 3.0 | 2.0 | 1502 | $2,400 | $1.60 | 23d | 1 | 0.36mi |
| 10038 Vista Laguna Dr Orlando, FL | 1.0–3.0 | 1.0–2.0 | 1008 | $2,526 | $2.51 | 1d | 16 | 0.45mi |
| 9942 Dean Oaks Ct Orlando, FL | 3.0 | 2.0 | 1140 | $2,095 | $1.84 | 21d | 1 | 0.68mi |
| 10169 Cody Ln Orlando, FL | 3.0 | 2.0 | 1158 | $2,249 | $1.94 | 4d | 1 | 0.89mi |
| 1206 Culver Rd Orlando, FL | 2.0 | 2.0 | 1241 | $2,550 | $2.05 | 23d | 1 | 0.91mi |
| 10945 Tangora St Orlando, FL | 4.0 | 2.0 | 1353 | $2,225 | $1.64 | 23d | 1 | 0.95mi |
| 314 Muscogee Ln Orlando, FL | 3.0 | 2.5 | 1296 | $2,500 | $1.93 | 23d | 1 | 0.99mi |
| 861 Blackgum Ct Orlando, FL | 3.0 | 2.0 | 1280 | $2,450 | $1.91 | 7d | 1 | 1.01mi |
| 647 Carey Way Orlando, FL | 3.0 | 2.0 | 1780 | $2,400 | $1.35 | 23d | 1 | 1.02mi |
| 10041 Massey St Alafaya, FL | 2.0 | 2.0 | 948 | $1,595 | $1.68 | 23d | 1 | 1.04mi |
| 10039 Massey St Orlando, FL | 2.0 | 2.0 | 948 | $1,595 | $1.68 | 1d | 1 | 1.04mi |
| 10315 Winding Creek Ln Orlando, FL | 3.0 | 2.0 | 1702 | $2,375 | $1.40 | 16d | 1 | 1.04mi |
| 1014 Park Manor Dr Orlando, FL | 3.0 | 2.0 | 943 | $1,800 | $1.91 | 23d | 1 | 1.07mi |
| 469 Glastonbury Dr Orlando, FL | 3.0 | 2.5 | 1300 | $2,195 | $1.69 | 21d | 1 | 1.11mi |
| 9010 Running Bull Rd Orlando, FL | 1.0–4.0 | 1.0–4.0 | 1032 | $1,632 | $1.58 | 4d | 1 | 1.13mi |
| 1312 Ravida Cir Orlando, FL | 2.0 | 2.0 | 1044 | $1,650 | $1.58 | 3d | 1 | 1.14mi |
| 1222 Tino Ct Orlando, FL | 2.0 | 2.0 | 1000 | $1,575 | $1.57 | 7d | 1 | 1.15mi |
| 9342 Shepton St Orlando, FL | 3.0 | 2.5 | 1714 | $2,250 | $1.31 | 23d | 1 | 1.16mi |
| 620 Riverwoods Cir Orlando, FL | 3.0 | 2.0 | 1547 | $2,375 | $1.54 | 3d | 1 | 1.23mi |
| 1033 Old Barn Rd Orlando, FL | 4.0 | 2.0 | 1837 | $2,656 | $1.45 | 13d | 1 | 1.32mi |
| 11147 Acme Dr Unit 207D Orlando, FL | 2.0 | 2.0 | 1127 | $1,800 | $1.60 | 23d | 1 | 1.39mi |
| 834 Oberry Hoover Rd Orlando, FL | 2.0 | 1.0 | 1061 | $1,750 | $1.65 | 23d | 1 | 1.40mi |
| 10064 Marguex Dr Orlando, FL | 3.0 | 2.0 | 1349 | $2,460 | $1.82 | 3d | 1 | 1.41mi |
| 1303 Creekbottom Cir Orlando, FL | 2.0 | 2.0 | 1364 | $1,950 | $1.43 | 2d | 1 | 1.44mi |
| 1346 Stearman Ct #16 Orlando, FL | 3.0 | 2.0 | 1319 | $1,745 | $1.32 | 17d | 1 | 1.46mi |
| 1428 Skybolt Ct #26 Orlando, FL | 3.0 | 2.0 | 1319 | $1,995 | $1.51 | 23d | 1 | 1.49mi |
| 466 Valencia Place Cir Orlando, FL | 3.0 | 2.0 | 1184 | $2,470 | $2.09 | 10d | 1 | 1.49mi |
Listing history 4 events
-
2026-06-18days on market $5,000 Active 3 DOM
-
2026-06-17days on market $5,000 Active 2 DOM
-
2026-06-15remarks 295-char remark
-
2026-06-15$5,000 Active 1 DOM
ⓘ Source: listings_history table (triggers on properties + properties_extension) + one-shot
backfill from property_details.listing_events for pre-trigger history.
Climate risk First Street
- Flood 1/10 Low FEMA zone X (unshaded) · 0% chance over 30 yrs
- Wildfire 3/10 Moderate
- Heat 8/10 Severe 7 d/yr ≥108°F today · 21 d/yr by 30 yrs out
- Wind 9/10 Extreme 99% chance of damaging wind over 30 yrs
- Air quality 2/10 Low 1 unhealthy d/yr today · 1 by 30 yrs out
Nearby sold comps map
Loading sold comps map…
Walkable amenities ~0.75 mi
Loading nearby amenities…
Taxation est. · year 1
- Rental income
- $26,861
- − Mortgage interest
- −$280
- − Property taxes
- −$75
- − Insurance
- −$25
- − Repairs & maintenance
- −$2,149
- − Management
- −$2,149
- − Depreciation
- −$145
- Taxable income
- $22,037
- Est. tax owed @ 24.0%
- −$5,289
- After-tax cash flow
- $15,516/yr
For passive investors: Depreciation is non-cash, so a rental often shows a tax loss while cash-flowing — sheltering income. Rental losses are passive: they offset passive income freely, and up to $25,000/yr can offset ordinary (W-2) income if you actively participate and your MAGI is under $100k (phasing out to $0 by $150k); unused losses carry forward. On sale, claimed depreciation is recaptured at up to 25%, and gains may owe capital-gains tax (a 1031 exchange can defer both). Figures are a year-1 estimate at your 24.0% rate — not tax advice; consult a CPA.
Schools (NCES district)
- District
- Orange
- NCES district ID
- 1201440
- Math proficiency
- 46% ▼ -9.00%
- Reading proficiency
- 51% ▼ -2.00%
- Median HH income
- $49,350
- Composite
- 41.47/100
- National rank
- #3461
- State rank
- #43 of 73 in FL
Livability — Alafaya
- Score
- 82/100
- State rank
- #60
- US rank
- #1076
Category grades
Schools grade is shown separately in the Schools card above.
Census & demographics
- Census place
- Alafaya, FL
- County
- Orange County · 1,471,359 people
- City population
- 131,972
- Metro
- Orlando-Kissimmee-Sanford, FL
- Population (ZIP)
- 63,698
- Household income
- $81,651
- Rent vs Own
- Severe rent burden
- 1458.0
Population outlook (Orange County) Hauer SSP2
- Today (2025)
- 1,618,226 people
- By 2030
- 1,787,404 · +10.5%
- By 2040
- 2,125,621 · +31.4%
- By 2050
- 2,454,016 · +51.6%
- By 2075
- 3,173,711 · +96.1%
- By 2100
- 3,607,781 · +122.9%
Race, ethnicity, and origin ACS 2023
- Neighborhood character
- Diverse neighborhood (Simpson 0.66)
- Race & ethnicity
- Hispanic / Latino 47% White 32% Two or more races 23% Black 11% Asian 7%
- Hispanic origin (detail)
- Mexican 2% Puerto Rican 25% Cuban 6% Dominican 3%
- Common ancestry
- Lithuanian 1% Romanian 1% Slovak 1%
- Foreign-born
- 20% · Canada, Vietnam, Jamaica
- Languages at home
- 56% English-only · Spanish 35% Other Indo-European 3% Vietnamese 2%
Political lean MEDSL · Orange
- 2024 margin
- D (+13.6) · D 56.1% · R 42.5% · Other 1.3%
- 2008→2024 swing
- -5.0pp toward R · 2008: 18.6pp · 2024: 13.6pp
- All cycles
- 2024: D+13.6 2020: D+23.1 2016: D+24.6 2012: D+18.2 2008: D+18.6
Not yet ingested
- Civics
- —
Market trends
- HPI YoY
- ▼ -171.52%
- Current HPI
- 315.8496
- Rent YoY
- ▲ 2.77%
- Metro
- Orlando-Kissimmee-Sanford, FL
- State GDP YoY
- ▲ 3.28%
- F500 in state
- 36
Industry mix (Fortune 500 HQ in FL)
| Industry | F500 HQs | Revenue |
|---|---|---|
| Industrial Technology | 2 | $29B |
|
||
| Insurance | 2 | $17B |
|
||
| Retail | 1 | $60B |
|
||
| Technology Distribution | 1 | $58B |
|
||
| Homebuilding | 1 | $35B |
|
||
| Technology Manufacturing | 1 | $35B |
|
||
Price history
-94.4% since first listed13 events — show timeline
- 2026-06-15 Listed $5,000 HAOR as distributed by MLS GRID
- 2014-09-08 Sold (Public Records) $140,000 Public Records
- 2014-08-25 Sold (MLS) $140,000 Stellar MLS as Distributed by MLS Grid
- 2014-06-14 Pending — Stellar MLS as Distributed by MLS Grid
- 2014-06-10 Listing Removed — Stellar MLS as Distributed by MLS Grid
- 2014-05-10 Pending — Stellar MLS as Distributed by MLS Grid
- 2014-04-28 Relisted — Stellar MLS as Distributed by MLS Grid
- 2014-04-25 Price Changed $140,000 Stellar MLS as Distributed by MLS Grid
- 2012-10-22 Listed $100,000 Stellar MLS as Distributed by MLS Grid
- 2007-03-23 Sold (Public Records) $230,000 Public Records
- 2007-03-15 Sold (MLS) $230,000 Stellar MLS as Distributed by MLS Grid
- 2006-10-24 Listed $234,900 Stellar MLS as Distributed by MLS Grid
- 1998-11-03 Sold (Public Records) $88,900 Public Records
Property tax history
+14.5%/yrLatest (2025): $5,764 · +151.3% YoY. Source: county tax records.
Cash-flow waterfall
monthlySold comps — $/sqft
last 12 mo · ≤1 miLoading sold comps…