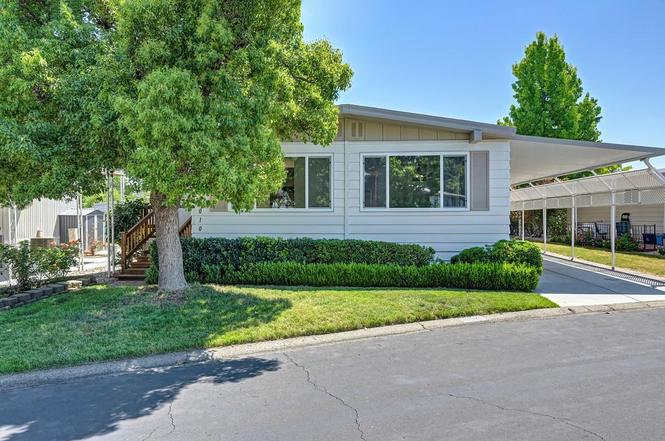
8010 Eucalyptus Ln · Citrus Heights, CA
Flood risk 1/10 · Minimal
- FEMA flood zone
- X (unshaded)
- Chance of flooding over 30 yrs
- 0.0%
- Est. flood insurance / yr
- $507 – $1,088
Fire risk 1/10 · Minimal
- Est. fire insurance / yr
- $659 – $1,223
Heat risk 7/10 · Major
- Hot days now (above 103°F)
- 6 days/yr
- Hot days in 30 yrs
- 13 days/yr
Wind risk 1/10 · Minimal
- Chance of severe wind over 30 yrs
- —
Air-quality risk 10/10 · Severe
- Unhealthy air days now
- 34 days/yr
- Unhealthy air days in 30 yrs
- 36 days/yr
Risk factors via First Street. Map © Google.
Why this score? — see what drove the C+ grade
The composite is a weighted blend of 9 inputs, each scored 0–100. Each bar is that input's sub-score; the figure is the points it added to the 100-point composite (weight × sub-score).
- Cash flow +29.3/30.0
- DSCR +10.0/10.0
- 1% rule +8.2/10.0
- Schools +4.4/10.0
- Rent growth +3.5/5.0
- Livability +3.0/5.0
- Condition / age +2.5/5.0
- ARV discount +0.0/15.0
- Appreciation +0.0/10.0
$170,000
🖨 Deal sheet (PDF) 📄 Offer letter ✓ Due diligence
Listing remarks
Welcome to Big Oak Senior Mobile Home Park, an award-winning 55+ community offering an active lifestyle and exceptional amenities. This beautifully remodeled 2-bedroom, 2-bath home features approximately 1,310 sq. ft. of comfortable living space, including a spacious primary bedroom addition. Thoughtful updates throughout include newer LVP flooring and baseboards, fresh interior and exterior paint, new cabinet doors, newer stove and oven, recessed lighting, ceiling fans, beautifully remodeled bathrooms, and more. The stylish laundry room features a custom tiled accent wall with open shelving, adding both charm and functionality. Major improvements include PEX plumbing, a newer AC, partial d
Key facts
- Newer ac
- Pex plumbing
- Newer lvp flooring
Tags
Property features AI
Finance
- Other: Located at 8010 Eucalyptus Ln, Citrus Heights, CA 95610; Directions: Sunrise Blvd to East on Old Auburn, Right on Big Oak into the park, Right on Eucalyptus
- Financial info: Land lease: No
- HOA & community: No homeowners association; Senior community
Exterior
- Parking: Attached covered parking; Guest parking available; No garage
- Utilities: Individual electric meter; Individual gas meter; Internet available; Public water; Public sewer
- Home design: Manufactured home in a park (double wide); Built in 1973; Silvercrest make; Vinyl skirting
- Construction: Elastomeric and metal roof
- Exterior features: Other lot features
Interior
- Kitchen: Synthetic countertops
- Bedrooms: 2 bedrooms
- Bathrooms: 2 full bathrooms; Shower stalls; Low-flow showers and toilets
- Heating & cooling: Central heating; Central air conditioning; Ceiling fans
- Interior features: Unfurnished; Deck attached to the living room; Dining and living area combined; Pets allowed
- Laundry & utility: Inside laundry room with hookups only; 220V outlet in laundry
Neighborhood map
What this means for you Summary
Snapshot
- This is a 2-bed/2.0-bath manufactured listed at $170k.
Deal economics
- At list price, monthly cash flow is $596 ($7k/yr) — positive.
- The deal already cash-flows at list — no discount required.
- Meets the 1% rule at list price ($2k rent vs $170k).
- Cap rate 10.5% vs local median 3.4% in Citrus Heights — top-decile yield for the area; either an underpriced asset or a hidden risk that comps aren't pricing in. Stress-test before assuming the spread holds.
Location & tenants
- Location reads 60/100 on livability (#614 in CA) — a middle-class / working-renter tenant base. Strengths: housing A+; Watch: schools D, crime D-, amenities F.
- San Juan Unified (suburban): math 40% / reading 62% proficiency, ranked #138 of 517 in CA (top 27%) — acceptable for families but not a draw, mixed tenant base, ~2y average lease.
- Market conditions: Rents rising fast (+4.1%/yr); 163 active listings in the ZIP; 15 comparable units currently listed for rent nearby; rentals at typical pace (median 19d on market — plan ~3-4 weeks tenant-placement turnaround); solid renter incomes; 6,825 units permitted in Sacramento County in 2024 (1,752 in 5+ unit buildings).
- This rent runs 32% of the median local income ($83k/yr) — at the standard rent-burdened threshold; future hikes will face affordability resistance.
Forward outlook
- Local home prices are declining (-3.0%/yr); year-one equity from $1k of loan paydown is wiped out by about $5k of value loss. Plan a longer hold.
- Sacramento County population projected at +17% by 2050 — long-run rental-demand tailwind backs the buy-and-hold thesis.
- At projected returns (-3.0% appreciation + 4.1% rent growth), your $48k cash investment doubles in ~8 years — after that, you're playing with house money.
Negotiation context
- Only 3 days on market — expect competitive offers; lowballing is unlikely to land.
Risks & watch-outs
- Climate carrying-cost: extreme-heat days projected 6→13/yr by 2055 (HVAC capex compounding) — expect insurance premiums to compound above CPI over the hold.
Questions for the listing agent
- Built in 1973 — when were the roof, HVAC, electrical panel, plumbing, and water heater last replaced?
- Is there a deadline driving the sale (1031 exchange, divorce, estate, relocation)? That informs how much negotiation room exists.
- Schools are D-rated, which usually means shorter tenancies and higher turnover. Who's the typical renter profile here, and what's been the actual vacancy rate?
- Crime grade is D in this area — have there been break-ins, vandalism, or insurance claims at this property in the last 3 years? What carrier currently insures it and at what premium?
- What's the average days-on-market for RENTAL listings here right now (not sales)? A rising rental-DOM trend means longer vacancies and softer asking-rent achievability than the comps imply.
- What's the recent tenant-quality profile in this submarket — average credit score on applications, eviction rate, late-payment / NSF rate, and stable-employment percentage? A property-management company in the area should have these aggregated.
- How much new for-sale + rental construction is in the pipeline within 1–3 miles? Heavy new supply typically softens prices + rents 12–24 months out; constrained supply supports both.
Investment metrics
- 1% rule
- 1.32% ✓
- Cap rate
- 10.50%
- Cash-on-cash
- 15.01%
- DSCR
- 1.67
- GRM
- 6.3
CMA / ARV
- ARV (on-the-fly)
- $141,480
- Comps found
- 12
Show comp detail 12 sales within ~0.75 mi
| Address | Dist | Beds/Ba | Sqft | Sold | Price | $/sf | Match |
|---|---|---|---|---|---|---|---|
| 8321 Driftwood Ln | 0.02mi | 2/2.0 | 1,344 (+3%) | 1mo | $122,500 | $91 | 94 |
| 8412 Big Oak Dr #170 | 0.03mi | 2/2.0 | 1,400 (+7%) | 0mo | $142,000 | $101 | 87 |
| 8323 Oak Front Ln | 0.07mi | 2/2.0 | 1,368 (+4%) | 5mo | $159,000 | $116 | 85 |
| 8009 Creekfront Ln | 0.10mi | 2/2.0 | 1,344 (+3%) | 9mo | $115,840 | $86 | 84 |
| 8344 Big Oak Dr | 0.18mi | 2/2.0 | 1,228 (-6%) | 1mo | $162,500 | $132 | 81 |
| 8008 Eucalyptus Ln | 0.00mi | 2/2.0 | 1,152 (-12%) | 3mo | $155,000 | $135 | 77 |
| 8003 Oakside Ln | 0.09mi | 2/2.0 | 1,400 (+7%) | 9mo | $85,000 | $61 | 77 |
| 8007 Creekfront Ln | 0.10mi | 2/2.0 | 1,440 (+10%) | 6mo | $125,000 | $87 | 73 |
| 8351 Big Oak Dr | 0.20mi | 2/2.0 | 1,200 (-8%) | 6mo | $135,000 | $113 | 72 |
| 8351 Cedarwood Ln | 0.14mi | 3/2.0 (+1) | 1,365 (+4%) | 14mo | $120,000 | $88 | 69 |
| 8001 Creekfront Ln | 0.12mi | 2/2.0 | 1,440 (+10%) | 11mo | $155,000 | $108 | 69 |
| 8346 Big Oak Dr | 0.18mi | 2/2.0 | 1,464 (+12%) | 10mo | $163,000 | $111 | 64 |
Match score weights: distance 35% · size 25% · config 20% · recency 20%. Top-matched comps best support the ARV.
Projected returns pro-forma
-3.0% appreciation · 4.09% rent growth · sell at horizon
- IRR
- 6.9%
- Equity multiple
- 1.27×
- Total profit
- $12,904
- Equity at exit
- $25,348
- IRR
- 17.1%
- Equity multiple
- 2.48×
- Total profit
- $70,642
- Equity at exit
- $14,698
Cash invested: $47,600 (down + closing). Projections, not guarantees.
Landlord ↔ Tenant lean methodology
- Overall (STATE)
- 18 Strongly Tenant-Friendly
- State California
- 18 Strongly Tenant-Friendly · D+13
- County
- — inherits STATE
- City
- — inherits STATE
ZIP-level market 95610
- Rents YoY
- 4.1%
- Active inventory
- 163
- Price-to-rent
- 6.3×
Monthly cashflow live
- Estimated rent
- $2,241 high interval (Pro) →
- Mortgage (P&I)
- −$891
- Tax est. 1.5%
- −$212 /mo · $2,550/yr
- Insurance
- −$71
- HOA
- −$0
- Vacancy / Maint / Mgmt
- −$471
- Net cashflow
- $596
Break-even live
Sensitivity live
| Price | -10% $713 | -5% $654 | +0% $596 | +5% $537 | +10% $478 |
|---|---|---|---|---|---|
| Rent | -10% $419 | -5% $507 | +0% $596 | +5% $684 | +10% $773 |
| Rate | -1.0pp $681 | -0.5pp $639 | base $596 | +0.5pp $552 | +1.0pp $507 |
UW: 25.0% down · 7.5% · 30yr · 1.5% tax · 5.0% vac · 8.0% maint · 8.0% mgmt
Financing live
Cash to close
- Down payment
- $42,500
- Closing costs
- $5,100
- Reserves months
- —
- Total cash needed
- —
Loan-product check · same deal, 3 products live
Conventional
25% down · 7.5% · 30yr
- Down + closing
- —
- Monthly P&I
- —
- Monthly cashflow
- —
- DSCR
- —
- Eligible?
- —
Personal DTI + credit; lowest rate.
DSCR
20% down · 8.5% · 30yr
- Down + closing
- —
- Monthly P&I
- —
- Monthly cashflow
- —
- DSCR
- —
- Eligible?
- —
No personal income docs; deal must DSCR.
Hard money
10% down · 12.0% · 12mo
- Down + closing
- —
- Monthly P&I
- —
- Monthly cashflow
- —
- DSCR
- —
- Eligible?
- —
Short-term bridge; refi at stabilization.
Rent comps 15 comps
| Address | Beds | Baths | Sqft | Rent | $/sqft | DOM | Units | Dist |
|---|---|---|---|---|---|---|---|---|
| 7898 Claypool Way Citrus Heights, CA | 3.0 | 2.0 | 1317 | $2,500 | $1.90 | 18d | 1 | 0.17mi |
| 8208 Charlotte Ave Citrus Heights, CA | 3.0 | 2.0 | 1401 | $2,750 | $1.96 | 8d | 1 | 0.68mi |
| 7517 Saint Philomena Way Citrus Heights, CA | 3.0 | 1.5 | 1100 | $2,500 | $2.27 | 15d | 1 | 0.80mi |
| 1519 Pine Valley Cir Roseville, CA | 3.0 | 2.0 | 1577 | $2,750 | $1.74 | 11d | 1 | 0.83mi |
| 8629 El Sobrante Way Orangevale, CA | 3.0 | 2.0 | 1117 | $2,500 | $2.24 | 44d | 1 | 0.86mi |
| 1911 Wildwood Way Apt 1 Roseville, CA | 2.0 | 1.0 | 900 | $1,595 | $1.77 | 2d | 1 | 1.00mi |
| 8237 Sunrise Blvd Citrus Heights, CA | 3.0 | 2.0 | 1050 | $2,095 | $2.00 | 8d | 1 | 1.11mi |
| 7849 Sunrise Blvd Citrus Heights, CA | 1.0–2.0 | 1.0–2.0 | 842 | $1,800 | $2.14 | 8d | 1 | 1.19mi |
| 1812A S Cirby Way Unit B Roseville, CA | 2.0 | 1.0 | 1000 | $2,300 | $2.30 | 2d | 1 | 1.20mi |
| 7024 Allenwood Ct Citrus Heights, CA | 3.0 | 2.0 | 1672 | $3,400 | $2.03 | 44d | 1 | 1.22mi |
| 7840 Antelope Rd Citrus Heights, CA | 1.0–2.0 | 1.0–2.0 | 840 | $1,675 | $1.99 | 44d | 1 | 1.25mi |
| 7429 Sunrise Blvd Citrus Heights, CA | 2.0 | 2.5 | 1319 | $2,000 | $1.52 | 44d | 1 | 1.35mi |
| 7856 Old Auburn Rd Apt 8 Citrus Heights, CA | 2.0 | 1.5 | 950 | $1,395 | $1.47 | 21d | 1 | 1.36mi |
| 7444 Tiara Way Unit D Citrus Heights, CA | 2.0 | 1.0 | 1020 | $1,850 | $1.81 | 44d | 1 | 1.36mi |
| 7441 Tiara Way Unit A Citrus Heights, CA | 2.0 | 1.0 | 894 | $1,295 | $1.45 | 24d | 1 | 1.41mi |
Listing history 3 events
-
2026-06-21days on market $170,000 Active 3 DOM
-
2026-06-19remarks 699-char remark
-
2026-06-19$170,000 Active 1 DOM
ⓘ Source: listings_history table (triggers on properties + properties_extension) + one-shot
backfill from property_details.listing_events for pre-trigger history.
Climate risk First Street
- Flood 1/10 Low FEMA zone X (unshaded) · 0% chance over 30 yrs
- Wildfire 1/10 Low
- Heat 7/10 Severe 6 d/yr ≥103°F today · 13 d/yr by 30 yrs out
- Wind 1/10 Low
- Air quality 10/10 Extreme 34 unhealthy d/yr today · 36 by 30 yrs out
Nearby sold comps map
Loading sold comps map…
Walkable amenities ~0.75 mi
Loading nearby amenities…
Taxation est. · year 1
- Rental income
- $26,892
- − Mortgage interest
- −$9,523
- − Property taxes
- −$2,550
- − Insurance
- −$850
- − Repairs & maintenance
- −$2,151
- − Management
- −$2,151
- − Depreciation
- −$4,945
- Taxable income
- $4,721
- Est. tax owed @ 24.0%
- −$1,133
- After-tax cash flow
- $6,014/yr
For passive investors: Depreciation is non-cash, so a rental often shows a tax loss while cash-flowing — sheltering income. Rental losses are passive: they offset passive income freely, and up to $25,000/yr can offset ordinary (W-2) income if you actively participate and your MAGI is under $100k (phasing out to $0 by $150k); unused losses carry forward. On sale, claimed depreciation is recaptured at up to 25%, and gains may owe capital-gains tax (a 1031 exchange can defer both). Figures are a year-1 estimate at your 24.0% rate — not tax advice; consult a CPA.
Schools (NCES district)
- District
- San Juan Unified
- NCES district ID
- 0634620
- Math proficiency
- 40% ▲ 3.00%
- Reading proficiency
- 62% ▲ 16.00%
- Median HH income
- $55,655
- Composite
- 44.07/100
- National rank
- #2878
- State rank
- #138 of 517 in CA
Livability — Citrus Heights
- Score
- 60/100
- State rank
- #614
- US rank
- #19580
Category grades
Schools grade is shown separately in the Schools card above.
Census & demographics
- Census place
- Citrus Heights, CA
- County
- Sacramento County · 1,539,646 people
- City population
- 89,370
- Metro
- Sacramento-Roseville-Folsom, CA
- Population (ZIP)
- 46,928
- Household income
- $83,327
- Rent vs Own
- Severe rent burden
- 1772.0
Population outlook (Sacramento County) Hauer SSP2
- Today (2025)
- 1,660,763 people
- By 2030
- 1,732,990 · +4.3%
- By 2040
- 1,855,755 · +11.7%
- By 2050
- 1,941,335 · +16.9%
- By 2075
- 2,046,162 · +23.2%
- By 2100
- 1,961,444 · +18.1%
Race, ethnicity, and origin ACS 2023
- Neighborhood character
- Predominantly White (68%)
- Race & ethnicity
- White 68% Hispanic / Latino 19% Two or more races 11% Black 3% Asian 3% Native American 1%
- Hispanic origin (detail)
- Mexican 15%
- Common ancestry
- Slovak 3% Subsaharan African 2% Lithuanian 2%
- Foreign-born
- 14% · Canada, China, Vietnam
- Languages at home
- 80% English-only · Spanish 9% Russian/Polish/Slavic 5% Other Indo-European 3%
Political lean MEDSL · Sacramento
- 2024 margin
- D (+19.7) · D 58.1% · R 38.4% · Other 3.5%
- 2008→2024 swing
- +0.7pp no change · 2008: 19.0pp · 2024: 19.7pp
- All cycles
- 2024: D+19.7 2020: D+25.3 2016: D+23.7 2012: D+16.3 2008: D+19.0
Not yet ingested
- Civics
- —
Market trends
- HPI YoY
- ▼ -367.16%
- Current HPI
- 325.0105
- Rent YoY
- ▲ 4.09%
- Metro
- Sacramento-Roseville-Folsom, CA
- State GDP YoY
- ▲ 3.21%
- F500 in state
- 116
Industry mix (Fortune 500 HQ in CA)
| Industry | F500 HQs | Revenue |
|---|---|---|
| Technology | 27 | $1,492B |
|
||
| Financial Services | 3 | $174B |
|
||
| Retail | 3 | $44B |
|
||
| Insurance | 3 | $26B |
|
||
| Media / Entertainment | 2 | $115B |
|
||
| Pharmaceuticals / Biotech | 2 | $62B |
|
||
Cash-flow waterfall
monthlySold comps — $/sqft
last 12 mo · ≤1 miLoading sold comps…