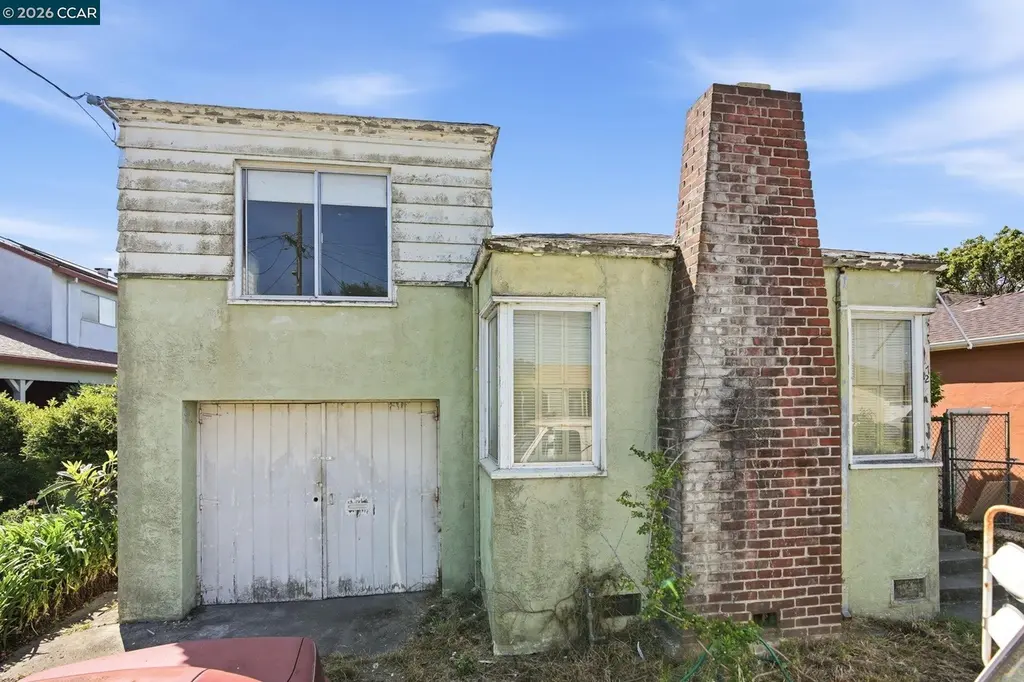
72 Murdock St · Richmond, CA
Flood risk 1/10 · Minimal
- FEMA flood zone
- X (unshaded)
- Chance of flooding over 30 yrs
- 0.0%
- Est. flood insurance / yr
- $473 – $860
Fire risk 1/10 · Minimal
- Est. fire insurance / yr
- $659 – $1,223
Heat risk 4/10 · Minor
- Hot days now (above 83°F)
- 7 days/yr
- Hot days in 30 yrs
- 16 days/yr
Wind risk 1/10 · Minimal
- Chance of severe wind over 30 yrs
- —
Air-quality risk 9/10 · Severe
- Unhealthy air days now
- 16 days/yr
- Unhealthy air days in 30 yrs
- 16 days/yr
Risk factors via First Street. Map © Google.
Why this score? — see what drove the D grade
The composite is a weighted blend of 9 inputs, each scored 0–100. Each bar is that input's sub-score; the figure is the points it added to the 100-point composite (weight × sub-score).
- ARV discount +15.0/15.0
- Cash flow +11.0/30.0
- 1% rule +3.6/10.0
- DSCR +3.2/10.0
- Livability +3.1/5.0
- Schools +3.0/10.0
- Rent growth +2.7/5.0
- Condition / age +2.5/5.0
- Appreciation +0.0/10.0
$295,000
🖨 Deal sheet (PDF) 📄 Offer letter ✓ Due diligence
Listing remarks
* Offer deadline has passed for this property * Major fixer opportunity in Richmond! This 2 bedroom, 1 bathroom home offers 1,199 sq ft of living space and is located in a great family-friendly neighborhood. Property needs significant repairs and updating, making it ideal for investors, contractors, or buyers looking for their next project. Due to the current condition of the home, financing options will be limited to cash or hard money only — conventional and FHA financing will not qualify. Come take a look and bring your vision. This fixer may be the opportunity you’ve been waiting for.
Key facts
- 4,100 sq ft lot
- Garage
- Built 1941
Property features AI
Exterior
- Parking: Attached garage (1 covered space, 1 garage space)
- Utilities: Public water; Public sewer; Electric service (standard power)
- Home design: Single-family residence; Residential property; Built in 1941
- Construction: 1,199 total building area
- Exterior features: Back yard; Front yard; Dog run; Landscaped yard
Interior
- Kitchen: Kitchen with unspecified/other features
- Bedrooms: 2 bedrooms on the upper level
- Flooring: Hardwood flooring; Vinyl flooring; Carpet
- Bathrooms: 1 full bathroom with shower-over-tub
- Heating & cooling: Heating present
- Interior features: Fireplace; 6 total rooms; Other room types/features
- Laundry & utility: Laundry area in the garage
Neighborhood map
What this means for you Summary
Snapshot
- This is a 2-bed/1.0-bath single-family listed at $295k.
Deal economics
- At list price, monthly cash flow is $-122 ($-1k/yr) — negative.
- To cash-flow at today's rent, offer at most $273k (7.3% below list).
- To meet the 1% rule (rent ≥ 1% of price), the offer needs to be $254k (13.9% below list).
- Recommended offer: $254k (13.9% below list) — sets the bar for 1% rule.
- Cap rate 5.8% vs local median 2.7% in Richmond — top-decile yield for the area; either an underpriced asset or a hidden risk that comps aren't pricing in. Stress-test before assuming the spread holds.
Location & tenants
- Location reads 62/100 on livability (#497 in CA) — a middle-class / working-renter tenant base. Strengths: commute A+, employment A, health & safety B+; Watch: crime F, amenities F, cost of living F.
- West Contra Costa Unified (suburban): math 24% / reading 35% proficiency, ranked #993 of 1,400 in CA (top 71%) — low school quality limits family demand, transient renter base, plan for 1-2y turnover.
- Zoned schools: Martin Luther King Jr. Elementary (385 students, 62% FRL); Lovonya Dejean Middle (404 students, 69% FRL); John F. Kennedy High (823 students, 66% FRL).
- Market conditions: Rents flat; 137 active listings in the ZIP; 37 comparable units currently listed for rent nearby; rentals lingering (median 46d on market — plan ~5-8 weeks vacancy on turnover, expect pricing pressure); 57% of comp listings sitting > 30 days — soft ceiling on asking rent; solid renter incomes; 2,169 units permitted in Contra Costa County in 2024 (896 in 5+ unit buildings).
- This rent runs 33% of the median local income ($91k/yr) — at the standard rent-burdened threshold; future hikes will face affordability resistance.
Forward outlook
- Local home prices are declining (-3.0%/yr); year-one equity from $2k of loan paydown is wiped out by about $9k of value loss. Plan a longer hold.
- Contra Costa County population projected at +26% by 2050 — long-run rental-demand tailwind backs the buy-and-hold thesis.
Negotiation context
- Only 12 days on market — expect competitive offers; lowballing is unlikely to land.
Risks & watch-outs
- Watch-outs: built in 1941 — expect roof / HVAC / electrical / plumbing capex.
Questions for the listing agent
- What do current leases actually rent for vs. the listed asking? Can we see a recent rent roll and the last 12 months of T-12 income?
- Built in 1941 — when were the roof, HVAC, electrical panel, plumbing, and water heater last replaced?
- Is there a deadline driving the sale (1031 exchange, divorce, estate, relocation)? That informs how much negotiation room exists.
- Schools are F-rated, which usually means shorter tenancies and higher turnover. Who's the typical renter profile here, and what's been the actual vacancy rate?
- Crime grade is F in this area — have there been break-ins, vandalism, or insurance claims at this property in the last 3 years? What carrier currently insures it and at what premium?
- The area grade is low — what's the realistic commute time and amenity access for the typical tenant pool here? Any planned neighborhood developments (good or bad) we should know about?
- What's the average days-on-market for RENTAL listings here right now (not sales)? A rising rental-DOM trend means longer vacancies and softer asking-rent achievability than the comps imply.
- What's the recent tenant-quality profile in this submarket — average credit score on applications, eviction rate, late-payment / NSF rate, and stable-employment percentage? A property-management company in the area should have these aggregated.
- How much new for-sale + rental construction is in the pipeline within 1–3 miles? Heavy new supply typically softens prices + rents 12–24 months out; constrained supply supports both.
Investment metrics
- 1% rule
- 0.86% ✗
- Cap rate
- 5.80%
- Cash-on-cash
- -1.77%
- DSCR
- 0.92
- GRM
- 9.7
CMA / ARV
- ARV (median comp)
- $589,788
- List price
- $295,000
- Delta
- -49.98%
- Verdict
- UNDERPRICED
- Comps
- 20 within 1.0 mi
Show comp detail 12 sales within ~0.75 mi
| Address | Dist | Beds/Ba | Sqft | Sold | Price | $/sf | Match |
|---|---|---|---|---|---|---|---|
| 72 Murdock St | 0.00mi | 2/1.0 | 1,199 (0%) | 0mo | $400,000 | $334 | 100 |
| 66 Murdock St | 0.01mi | 3/1.5 (+1) | 1,310 (+9%) | 3mo | $600,000 | $458 | 75 |
| 2814 Ohio Ave | 0.18mi | 2/2.0 | 1,306 (+9%) | 3mo | $465,000 | $356 | 70 |
| 559 Civic Center St | 0.49mi | 3/1.0 (+1) | 1,203 (+0%) | 2mo | $575,000 | $478 | 70 |
| 2626 Maine Ave | 0.31mi | 3/2.0 (+1) | 1,235 (+3%) | 3mo | $500,000 | $405 | 69 |
| 3421 Nevin St | 0.55mi | 3/2.0 (+1) | 1,172 (-2%) | 0mo | $605,000 | $516 | 61 |
| 436 S 16th St | 0.63mi | 3/2.0 (+1) | 1,150 (-4%) | 3mo | $575,000 | $500 | 52 |
| 362 S 35th St | 0.63mi | 3/2.0 (+1) | 1,129 (-6%) | 2mo | $552,000 | $489 | 50 |
| 659 31st St | 0.72mi | 2/1.0 | 1,074 (-10%) | 2mo | $415,000 | $386 | 47 |
| 129 S 35th St | 0.47mi | 3/1.5 (+1) | 1,368 (+14%) | 6mo | $575,000 | $420 | 42 |
| 2761 Martin Luther King Jr Ave | 0.57mi | 3/2.0 (+1) | 1,358 (+13%) | 2mo | $650,000 | $479 | 40 |
| 528 S 29th St | 0.57mi | 3/1.5 (+1) | 1,031 (-14%) | 4mo | $410,000 | $398 | 40 |
Match score weights: distance 35% · size 25% · config 20% · recency 20%. Top-matched comps best support the ARV.
Projected returns pro-forma
-3.0% appreciation · 0.84% rent growth · sell at horizon
- IRR
- -21.7%
- Equity multiple
- 0.26×
- Total profit
- $-60,869
- Equity at exit
- $43,985
- IRR
- -22.0%
- Equity multiple
- -0.02×
- Total profit
- $-83,840
- Equity at exit
- $25,506
Cash invested: $82,600 (down + closing). Projections, not guarantees.
Landlord ↔ Tenant lean methodology
- Overall (STATE)
- 18 Strongly Tenant-Friendly
- State California
- 18 Strongly Tenant-Friendly · D+13
- County
- — inherits STATE
- City
- — inherits STATE
ZIP-level market 94804
- Rents YoY
- 0.8%
- Active inventory
- 137
- Price-to-rent
- 9.7×
Monthly cashflow live
- Estimated rent
- $2,539 high interval (Pro) →
- Mortgage (P&I)
- −$1,547
- Tax from tax record
- −$457 /mo · $5,489/yr
- Insurance
- −$123
- HOA
- −$0
- Vacancy / Maint / Mgmt
- −$533
- Net cashflow
- $-122
Break-even live
Sensitivity live
| Price | -10% $45 | -5% $-38 | +0% $-122 | +5% $-205 | +10% $-289 |
|---|---|---|---|---|---|
| Rent | -10% $-322 | -5% $-222 | +0% $-122 | +5% $-22 | +10% $79 |
| Rate | -1.0pp $27 | -0.5pp $-47 | base $-122 | +0.5pp $-198 | +1.0pp $-276 |
UW: 25.0% down · 7.5% · 30yr · 1.5% tax · 5.0% vac · 8.0% maint · 8.0% mgmt
Financing live
Cash to close
- Down payment
- $73,750
- Closing costs
- $8,850
- Reserves months
- —
- Total cash needed
- —
Loan-product check · same deal, 3 products live
Conventional
25% down · 7.5% · 30yr
- Down + closing
- —
- Monthly P&I
- —
- Monthly cashflow
- —
- DSCR
- —
- Eligible?
- —
Personal DTI + credit; lowest rate.
DSCR
20% down · 8.5% · 30yr
- Down + closing
- —
- Monthly P&I
- —
- Monthly cashflow
- —
- DSCR
- —
- Eligible?
- —
No personal income docs; deal must DSCR.
Hard money
10% down · 12.0% · 12mo
- Down + closing
- —
- Monthly P&I
- —
- Monthly cashflow
- —
- DSCR
- —
- Eligible?
- —
Short-term bridge; refi at stabilization.
Rent comps 37 comps
| Address | Beds | Baths | Sqft | Rent | $/sqft | DOM | Units | Dist |
|---|---|---|---|---|---|---|---|---|
| 177 22nd St Richmond, CA | 2.0 | 1.0 | 750 | $2,250 | $3.00 | 45d | 1 | 0.22mi |
| 2808 Macdonald Ave Unit 2828 Richmond, CA | 1.0 | 1.0 | 700 | $1,990 | $2.84 | 45d | 1 | 0.26mi |
| 300 30th St Unit 09 Richmond, CA | 3.0 | 1.0 | 900 | $2,895 | $3.22 | 45d | 1 | 0.34mi |
| 339 21st St Unit 345 Richmond, CA | 2.0 | 1.0 | 800 | $2,420 | $3.02 | 16d | 1 | 0.41mi |
| 1621 Florida Ave Richmond, CA | 2.0 | 1.0 | 1320 | $2,200 | $1.67 | 26d | 1 | 0.49mi |
| 242 16th St Richmond, CA | 3.0 | 1.0 | 1000 | $2,995 | $3.00 | 20d | 1 | 0.53mi |
| 203 16th St Unit K Richmond, CA | 1.0 | 1.0 | 800 | $1,650 | $2.06 | 45d | 1 | 0.54mi |
| 440 18th St Unit b Richmond, CA | 1.0 | 1.0 | 961 | $1,728 | $1.80 | 45d | 1 | 0.56mi |
| 150 Marina Way Richmond, CA | 2.0 | 1.0 | 715 | $1,795 | $2.51 | 16d | 1 | 0.61mi |
| 410 S 34th St Unit C Richmond, CA | 2.0 | 1.0 | 803 | $2,300 | $2.86 | 45d | 1 | 0.61mi |
| 2941 Chavez Ln Richmond, CA | 3.0 | 2.0 | 1388 | $3,849 | $2.77 | 23d | 1 | 0.68mi |
| 418 Marina Way Richmond, CA | 2.0 | 2.0 | 1470 | $2,780 | $1.89 | 45d | 1 | 0.70mi |
| 3943 Florida Ave Richmond, CA | 3.0 | 2.0 | 1145 | $2,850 | $2.49 | 26d | 1 | 0.74mi |
| 2377 Downer Ave Unit 2377 Richmond, CA | 2.0 | 1.0 | 814 | $2,350 | $2.89 | 45d | 1 | 0.77mi |
| 430 S 38th St Richmond, CA | 3.0 | 2.0 | 1228 | $3,774 | $3.07 | 45d | 1 | 0.77mi |
| 317 45th St Unit 317 Richmond, CA | 3.0 | 1.0 | 1100 | $2,495 | $2.27 | 45d | 1 | 0.96mi |
| 827 S 33rd St Unit 827 Richmond, CA | 2.0 | 1.0 | 731 | $2,150 | $2.94 | 45d | 1 | 0.98mi |
| 827 S 33rd St Unit 827 Richmond, CA | 2.0 | 1.0 | 731 | $2,150 | $2.94 | 14d | 1 | 0.98mi |
| 2118 Visalia Ave Richmond, CA | 3.0 | 1.0 | 1108 | $2,795 | $2.52 | 26d | 1 | 1.02mi |
| 2507 Baywood Way Richmond, CA | 2.0 | 2.0 | 1079 | $3,600 | $3.34 | 45d | 1 | 1.04mi |
| 537 Nevin Ave Richmond, CA | 2.0 | 1.5 | 780 | $2,200 | $2.82 | 26d | 1 | 1.09mi |
| 541 Nevin Ave Richmond, CA | 2.0 | 1.5 | 780 | $2,200 | $2.82 | 26d | 1 | 1.09mi |
| 79 Schooner Ct Richmond, CA | 1.0 | 1.0 | 732 | $2,450 | $3.35 | 13d | 1 | 1.12mi |
| 400 Bissell Ave Unit 402 Richmond, CA | 3.0 | 1.5 | 900 | $2,900 | $3.22 | 45d | 1 | 1.13mi |
| 400 Bissell Ave Unit 402 Richmond, CA | 3.0 | 1.5 | 900 | $2,400 | $2.67 | 12d | 1 | 1.13mi |
| 1207 Melville Sq #212 Richmond, CA | 2.0 | 2.0 | 1022 | $2,750 | $2.69 | 45d | 1 | 1.13mi |
| 1526 Visalia Ave Richmond, CA | 3.0 | 1.0 | 977 | $2,995 | $3.07 | 4d | 1 | 1.14mi |
| 2401 Humphrey Ave Unit A Richmond, CA | 3.0 | 1.0 | 1095 | $2,900 | $2.65 | 7d | 1 | 1.15mi |
| 510 McLaughlin St Richmond, CA | 2.0 | 1.0 | 898 | $2,195 | $2.44 | 45d | 1 | 1.17mi |
| 711 Pennsylvania Ave Richmond, CA | 2.0 | 1.0 | 1000 | $2,400 | $2.40 | 45d | 1 | 1.20mi |
| 715 Pennsylvania Ave Unit 2 Richmond, CA | 2.0 | 1.5 | 1100 | $2,500 | $2.27 | 45d | 1 | 1.20mi |
| 560 3rd St Richmond, CA | 3.0 | 2.0 | 1000 | $3,200 | $3.20 | 26d | 1 | 1.28mi |
| 781 Humboldt St Richmond, CA | 2.0 | 1.0 | 850 | $2,350 | $2.76 | 45d | 1 | 1.38mi |
| 1610 Sanford Ave Unit 3 San Pablo, CA | 2.0 | 1.0 | 768 | $2,150 | $2.80 | 26d | 1 | 1.39mi |
| 2035 Key Blvd Key Blvd El Cerrito, CA | 2.0 | 1.5 | 840 | $2,800 | $3.33 | 45d | 1 | 1.45mi |
| 2029 Key Blvd Unit 2035 El Cerrito, CA | 1.0 | 1.0 | 700 | $2,300 | $3.29 | 45d | 1 | 1.46mi |
| 422 C St Richmond, CA | 2.0 | 1.0 | 1000 | $1,995 | $2.00 | 45d | 1 | 1.46mi |
Listing history 3 events
-
2026-05-11$295,000 Active 587-char remark
-
2026-05-08historical $295,000 587-char remark
-
1990-03-13soldstatus $156,000
ⓘ Source: listings_history table (triggers on properties + properties_extension) + one-shot
backfill from property_details.listing_events for pre-trigger history.
Tax reassessment forecast CA · Resets to sale price
- Current annual tax
- $5,489 · $457/mo
- Projected year-2 tax
- $5,489 · $457/mo
- Expected delta
- $0/yr ($0/mo · 0.0%)
ⓘ Screening estimate from a state-policy table — verify with the county assessor before closing.
Climate risk First Street
- Flood 1/10 Low FEMA zone X (unshaded) · 0% chance over 30 yrs
- Wildfire 1/10 Low
- Heat 4/10 Moderate 7 d/yr ≥83°F today · 16 d/yr by 30 yrs out
- Wind 1/10 Low
- Air quality 9/10 Extreme 16 unhealthy d/yr today · 16 by 30 yrs out
Nearby sold comps map
Loading sold comps map…
Walkable amenities ~0.75 mi
Loading nearby amenities…
Taxation est. · year 1
- Rental income
- $30,464
- − Mortgage interest
- −$16,525
- − Property taxes
- −$5,489
- − Insurance
- −$1,475
- − Repairs & maintenance
- −$2,437
- − Management
- −$2,437
- − Depreciation
- −$8,582
- Taxable loss
- −$6,481
- Est. tax savings @ 24.0%
- +$1,555
- After-tax cash flow
- $94/yr
For passive investors: Depreciation is non-cash, so a rental often shows a tax loss while cash-flowing — sheltering income. Rental losses are passive: they offset passive income freely, and up to $25,000/yr can offset ordinary (W-2) income if you actively participate and your MAGI is under $100k (phasing out to $0 by $150k); unused losses carry forward. On sale, claimed depreciation is recaptured at up to 25%, and gains may owe capital-gains tax (a 1031 exchange can defer both). Figures are a year-1 estimate at your 24.0% rate — not tax advice; consult a CPA.
Schools (NCES district)
- District
- West Contra Costa Unified
- NCES district ID
- 0632550
- Math proficiency
- 24% ▲ 1.00%
- Reading proficiency
- 35% ▲ 1.00%
- Median HH income
- $64,837
- Composite
- 30.04/100
- National rank
- #11623
- State rank
- #993 of 1400 in CA
Livability — Richmond
- Score
- 62/100
- State rank
- #497
- US rank
- #16759
Category grades
Schools grade is shown separately in the Schools card above.
Census & demographics
- Census place
- Richmond, CA
- County
- Contra Costa County · 1,059,880 people
- City population
- 183,357
- Metro
- San Francisco-Oakland-Berkeley, CA
- Population (ZIP)
- 44,891
- Household income
- $91,037
- Rent vs Own
- Severe rent burden
- 2065.0
Population outlook (Contra Costa County) Hauer SSP2
- Today (2025)
- 1,287,720 people
- By 2030
- 1,364,937 · +6.0%
- By 2040
- 1,506,209 · +17.0%
- By 2050
- 1,624,373 · +26.1%
- By 2075
- 1,853,193 · +43.9%
- By 2100
- 1,901,231 · +47.6%
Race, ethnicity, and origin ACS 2023
- Neighborhood character
- Highly diverse neighborhood (Simpson 0.71)
- Race & ethnicity
- Hispanic / Latino 47% Black 19% White 17% Two or more races 14% Asian 11% Native American 2%
- Hispanic origin (detail)
- Mexican 27%
- Common ancestry
- Italian 2% Slovak 1% Lithuanian 1%
- Foreign-born
- 34% · Canada, China, Vietnam
- Languages at home
- 46% English-only · Spanish 41% Other Indo-European 4% Chinese 3%
Political lean MEDSL · Contra Costa
- 2024 margin
- Solid D (+38.0) · D 67.3% · R 29.4% · Other 3.3%
- 2008→2024 swing
- +0.2pp no change · 2008: 37.8pp · 2024: 38.0pp
- All cycles
- 2024: D+38.0 2020: D+45.3 2016: D+43.5 2012: D+33.7 2008: D+37.8
Not yet ingested
- Civics
- —
Market trends
- HPI YoY
- ▼ -686.16%
- Current HPI
- 283.8859
- Rent YoY
- ▲ 0.84%
- Metro
- San Francisco-Oakland-Berkeley, CA
- State GDP YoY
- ▲ 3.21%
- F500 in state
- 116
Industry mix (Fortune 500 HQ in CA)
| Industry | F500 HQs | Revenue |
|---|---|---|
| Technology | 27 | $1,492B |
|
||
| Financial Services | 3 | $174B |
|
||
| Retail | 3 | $44B |
|
||
| Insurance | 3 | $26B |
|
||
| Media / Entertainment | 2 | $115B |
|
||
| Pharmaceuticals / Biotech | 2 | $62B |
|
||
Price history
+156.4% since first listed5 events — show timeline
- 2026-06-12 Sold (MLS) $400,000 bridgeMLS, Bay East AOR, or Contra Costa AOR
- 2026-05-23 Pending — bridgeMLS, Bay East AOR, or Contra Costa AOR
- 2026-05-11 Listed $295,000 bridgeMLS, Bay East AOR, or Contra Costa AOR
- 2026-05-08 Coming Soon $295,000 bridgeMLS, Bay East AOR, or Contra Costa AOR
- 1990-03-13 Sold (Public Records) $156,000 Public Records
Property tax history
+2.7%/yrLatest (2025): $5,489 · +1.7% YoY. Source: county tax records.
Cash-flow waterfall
monthlySold comps — $/sqft
last 12 mo · ≤1 miLoading sold comps…