 Multi-family
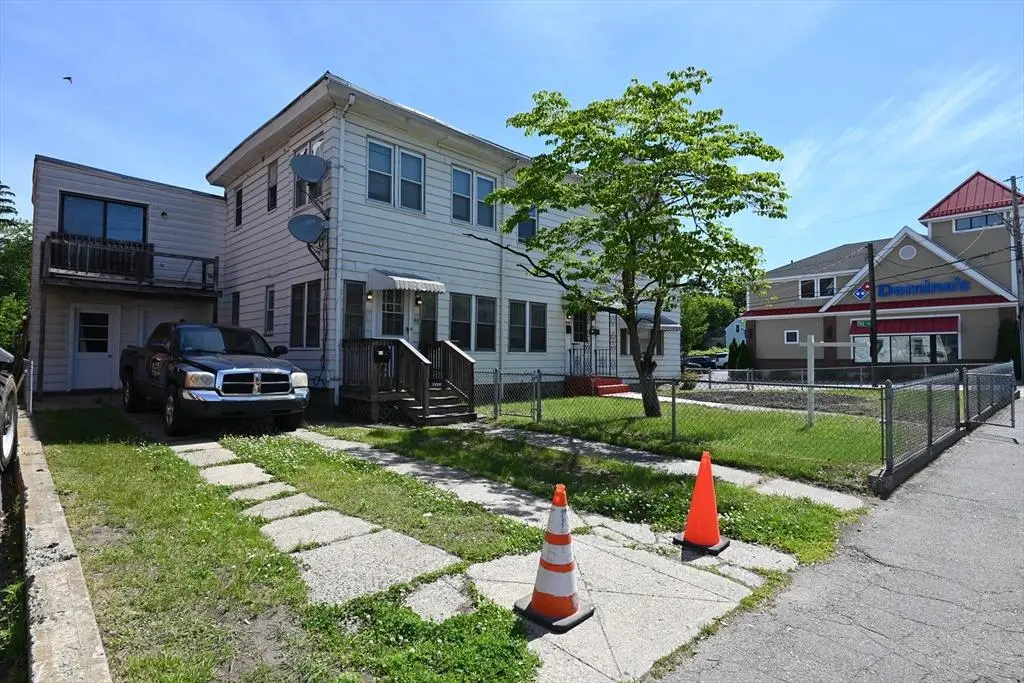
89 Mammoth Rd · Lowell, MA
Flood risk No data
- FEMA flood zone
- —
- Chance of flooding over 30 yrs
- —
- Est. flood insurance / yr
- —
Fire risk No data
- Est. fire insurance / yr
- —
Heat risk No data
- Hot days now (above threshold)
- —
- Hot days in 30 yrs
- —
Wind risk No data
- Chance of severe wind over 30 yrs
- —
Air-quality risk No data
- Unhealthy air days now
- —
- Unhealthy air days in 30 yrs
- —
Risk factors via First Street. Map © Google.
Why this score? — see what drove the D grade
The composite is a weighted blend of 9 inputs, each scored 0–100. Each bar is that input's sub-score; the figure is the points it added to the 100-point composite (weight × sub-score).
- Cash flow +16.4/30.0
- DSCR +5.1/10.0
- ARV discount +5.1/15.0
- Livability +4.0/5.0
- 1% rule +3.9/10.0
- Rent growth +2.9/5.0
- Condition / age +2.5/5.0
- Schools +2.1/10.0
- Appreciation +0.0/10.0
$749,900
🖨 Deal sheet (PDF) 📄 Offer letter ✓ Due diligence
Multi-family units
County records classify this as Multi-Family (2-4 Unit). Listing-text estimate: 1 unit. estimate disagrees with records
Listing remarks
Located at 89 Mammoth Rd, Lowell, MA, this 3 family residence in Middlesex County presents an inviting home, ready for immediate occupancy. The living room, enhanced by a vaulted ceiling, offers a wonderful space for relaxation and entertainment. Imagine the possibilities for creating a warm and inviting atmosphere within this expansive area. The kitchen features crown molding and a kitchen peninsula. Envision preparing meals in this well-appointed space, complete with stylish details. The bedroom also features crown molding. This property includes a sunroom and a one-car garage. With five bedrooms and three full bathrooms across two stories, and encompassing 3003 square feet of living area
Key facts
- 5,663 sq ft lot
- Garage
- Built 1930
Property features AI
Finance
- HOA & community: Not a senior community
Exterior
- Parking: 1-car garage (covered); 6 off-street open parking spaces; 7 total parking spaces
- Utilities: Public water; Public sewer; Electric: 110 volts, 100 amp service
- Home design: 3-family property; 3 stories; Approximately 3,003 total building area
- Construction: Frame construction; Stone foundation; Built (year approximate, from public records)
- Exterior features: Corner lot; Public road frontage; Shingle roof; White exterior
Interior
- Bedrooms: Unit 1: 1 level; Unit 2: 1 level (2 floors); Unit 3: 1 level (2 floors)
- Bathrooms: 3 full bathrooms
- Interior features: 12 total rooms; Full basement
Neighborhood map
What this means for you Summary
Snapshot
- This is a 5-bed/3.0-bath multifamily listed at $750k.
Deal economics
- At list price, monthly cash flow is $429 ($5k/yr) — positive.
- The deal already cash-flows at list — no discount required.
- To meet the 1% rule (rent ≥ 1% of price), the offer needs to be $668k (10.9% below list).
- Recommended offer: $668k (10.9% below list) — sets the bar for 1% rule.
- Cap rate 7.0% vs local median 2.9% in Lowell — top-decile yield for the area; either an underpriced asset or a hidden risk that comps aren't pricing in. Stress-test before assuming the spread holds.
Location & tenants
- Location reads 80/100 on livability (#36 in MA, #1,677 nationally) — a professional / high-income tenant draw. Strengths: amenities A+, commute A+, health & safety A+; Watch: schools C-, crime F, cost of living F.
- Lowell (suburban): math 20% / reading 28% proficiency, ranked #277 of 302 in MA (top 92%) — low school quality limits family demand, transient renter base, plan for 1-2y turnover; 64% free/reduced lunch — lower-income household profile, screen leases tightly.
- Market conditions: Rents rising (+1.5%/yr); 21 active listings in the ZIP; 2 comparable units currently listed for rent nearby; 3,670 units permitted in Middlesex County in 2024 (2,611 in 5+ unit buildings).
- At $6,685/mo this rent would consume 110% of the median local household income ($73k/yr) (locally 1612% of renters already pay >50% of income on rent) — very limited rent-growth headroom before tenants either downsize or default.
Forward outlook
- Local home prices are declining (-3.0%/yr); year-one equity from $5k of loan paydown is wiped out by about $22k of value loss. Plan a longer hold.
- Middlesex County population projected at +20% by 2050 — long-run rental-demand tailwind backs the buy-and-hold thesis.
Negotiation context
- It's been on market 19 days — a 2% lower offer ($739k) is reasonable based on typical stale-listing flexibility.
- Current owner paid $100k; list at $750k implies a 651% gain — meaningful room to come down on a strong offer.
Risks & watch-outs
- Watch-outs: built in 1930 — expect roof / HVAC / electrical / plumbing capex.
Questions for the listing agent
- Built in 1930 — when were the roof, HVAC, electrical panel, plumbing, and water heater last replaced?
- Is there a deadline driving the sale (1031 exchange, divorce, estate, relocation)? That informs how much negotiation room exists.
- Crime grade is F in this area — have there been break-ins, vandalism, or insurance claims at this property in the last 3 years? What carrier currently insures it and at what premium?
- The area grade is low — what's the realistic commute time and amenity access for the typical tenant pool here? Any planned neighborhood developments (good or bad) we should know about?
- What's the average days-on-market for RENTAL listings here right now (not sales)? A rising rental-DOM trend means longer vacancies and softer asking-rent achievability than the comps imply.
- What's the recent tenant-quality profile in this submarket — average credit score on applications, eviction rate, late-payment / NSF rate, and stable-employment percentage? A property-management company in the area should have these aggregated.
- How much new apartment / multifamily construction is in the pipeline within 1–3 miles? Heavy new supply (>2% of stock underway) typically softens rents 12–24 months out; light construction supports rent growth.
Investment metrics
- 1% rule
- 0.89% ✗
- Cap rate
- 6.98%
- Cash-on-cash
- 2.45%
- DSCR
- 1.11
- GRM
- 9.3
CMA / ARV
- ARV (on-the-fly)
- $711,711
- Comps found
- 11
Show comp detail 11 sales within ~0.75 mi
| Address | Dist | Beds/Ba | Sqft | Sold | Price | $/sf | Match |
|---|---|---|---|---|---|---|---|
| 101-103 Dracut St | 0.44mi | 6/2.0 (+1) | 2,920 (-3%) | 2mo | $725,000 | $248 | 64 |
| 160-162 Avon St | 0.33mi | 4/2.0 (-1) | 2,831 (-6%) | 8mo | $700,000 | $247 | 60 |
| 19 Oliver St | 0.54mi | 6/4.0 (+1) | 2,900 (-3%) | 0mo | $790,000 | $272 | 60 |
| 41 Butterfield St | 0.68mi | 6/2.5 (+1) | 2,942 (-2%) | 5mo | $680,000 | $231 | 54 |
| 15 Varney | 0.65mi | 6/2.0 (+1) | 3,131 (+4%) | 3mo | $770,000 | $246 | 51 |
| 51-53 Orchard St | 0.27mi | 6/2.0 (+1) | 3,333 (+11%) | 11mo | $790,000 | $237 | 51 |
| 296, 298 University Ave | 0.40mi | 4/2.0 (-1) | 2,746 (-9%) | 15mo | $805,000 | $293 | 45 |
| 440 Pawtucket St | 0.34mi | 4/2.0 (-1) | 3,452 (+15%) | 8mo | $620,000 | $180 | 44 |
| 231 School St | 0.63mi | 6/2.0 (+1) | 3,073 (+2%) | 21mo | $570,000 | $185 | 40 |
| 151-153 Gershom Ave | 0.48mi | 6/2.0 (+1) | 3,325 (+11%) | 13mo | $720,000 | $217 | 39 |
| 85 Varney St | 0.59mi | 6/2.0 (+1) | 2,688 (-10%) | 9mo | $625,000 | $233 | 39 |
Match score weights: distance 35% · size 25% · config 20% · recency 20%. Top-matched comps best support the ARV.
Projected returns pro-forma
-3.0% appreciation · 1.54% rent growth · sell at horizon
- IRR
- -14.0%
- Equity multiple
- 0.50×
- Total profit
- $-103,998
- Equity at exit
- $111,813
- IRR
- -7.6%
- Equity multiple
- 0.55×
- Total profit
- $-94,391
- Equity at exit
- $64,838
Cash invested: $209,972 (down + closing). Projections, not guarantees.
Landlord ↔ Tenant lean methodology
- Overall (STATE)
- 20 Strongly Tenant-Friendly
- State Massachusetts
- 20 Strongly Tenant-Friendly · D+15
- County
- — inherits STATE
- City
- — inherits STATE
ZIP-level market 01854
- Home prices YoY
- -13.8%
- Rents YoY
- 1.5%
- Active inventory
- 21
- Price-to-rent
- 27.4×
Monthly cashflow live
- Estimated rent
- $6,685 high interval (Pro) →
- Mortgage (P&I)
- −$3,933
- Tax from tax record
- −$608 /mo · $7,290/yr
- Insurance
- −$312
- HOA
- −$0
- Vacancy / Maint / Mgmt
- −$1,404
- Net cashflow
- $429
Break-even live
Sensitivity live
| Price | -10% $853 | -5% $641 | +0% $429 | +5% $216 | +10% $4 |
|---|---|---|---|---|---|
| Rent | -10% $-99 | -5% $165 | +0% $429 | +5% $693 | +10% $957 |
| Rate | -1.0pp $806 | -0.5pp $619 | base $429 | +0.5pp $234 | +1.0pp $37 |
3-unit breakdown (identical units grouped — click to expand)
| Units | Beds | Baths | Est. rent |
|---|---|---|---|
| 2× units | 2 | 1 | $4,564 |
| #1 | 2 | 1 | $2,282 |
| #2 | 2 | 1 | $2,282 |
| 1× unit | 1 | 1 | $2,122 |
| Total (3 units) | $6,685 | ||
UW: 25.0% down · 7.5% · 30yr · 1.5% tax · 5.0% vac · 8.0% maint · 8.0% mgmt
Financing live
Cash to close
- Down payment
- $187,475
- Closing costs
- $22,497
- Reserves months
- —
- Total cash needed
- —
Loan-product check · same deal, 3 products live
Conventional
25% down · 7.5% · 30yr
- Down + closing
- —
- Monthly P&I
- —
- Monthly cashflow
- —
- DSCR
- —
- Eligible?
- —
Personal DTI + credit; lowest rate.
DSCR
20% down · 8.5% · 30yr
- Down + closing
- —
- Monthly P&I
- —
- Monthly cashflow
- —
- DSCR
- —
- Eligible?
- —
No personal income docs; deal must DSCR.
Hard money
10% down · 12.0% · 12mo
- Down + closing
- —
- Monthly P&I
- —
- Monthly cashflow
- —
- DSCR
- —
- Eligible?
- —
Short-term bridge; refi at stabilization.
Rent comps 2 comps
| Address | Beds | Baths | Sqft | Rent | $/sqft | DOM | Units | Dist |
|---|---|---|---|---|---|---|---|---|
| 13 Phillips St Lowell, MA | 6.0 | 2.0 | 2500 | $3,500 | $1.40 | 45d | 1 | 0.69mi |
| 27 Burtt St Unit 1 Lowell, MA | 5.0 | 2.0 | 4266 | $3,600 | $0.84 | 18d | 1 | 1.30mi |
Listing history 15 events
-
2026-06-21days on market $749,900 Active 19 DOM
-
2026-06-18days on market $749,900 Active 16 DOM
-
2026-06-17days on market $749,900 Active 15 DOM
-
2026-06-16days on market $749,900 Active 14 DOM
-
2026-06-15days on market $749,900 Active 13 DOM
-
2026-06-13days on market $749,900 Active 11 DOM
-
2026-06-13days on market $749,900 Active 10 DOM
-
2026-06-09days on market $749,900 Active 7 DOM
-
2026-06-08days on market $749,900 Active 6 DOM
-
2026-06-07statusdays on market $749,900 Active 5 DOM
-
2026-06-04days on market $749,900 New 2 DOM
-
2026-06-03statusdays on market $749,900 New 1 DOM
-
2026-04-30status Under Agreement
-
2026-02-06$749,900 New
-
1984-12-17soldstatus $99,900
ⓘ Source: listings_history table (triggers on properties + properties_extension) + one-shot
backfill from property_details.listing_events for pre-trigger history.
Tax reassessment forecast MA · Partial reset (capped growth)
- Current annual tax
- $7,290 · $608/mo
- Projected year-2 tax
- $8,257 · $688/mo
- Expected delta
- +$967/yr (+$81/mo · 13.3%)
ⓘ Screening estimate from a state-policy table — verify with the county assessor before closing.
Nearby sold comps map
Loading sold comps map…
Walkable amenities ~0.75 mi
Loading nearby amenities…
Taxation est. · year 1
- Rental income
- $80,220
- − Mortgage interest
- −$42,006
- − Property taxes
- −$7,290
- − Insurance
- −$3,750
- − Repairs & maintenance
- −$6,418
- − Management
- −$6,418
- − Depreciation
- −$21,815
- Taxable loss
- −$7,476
- Est. tax savings @ 24.0%
- +$1,794
- After-tax cash flow
- $6,938/yr
For passive investors: Depreciation is non-cash, so a rental often shows a tax loss while cash-flowing — sheltering income. Rental losses are passive: they offset passive income freely, and up to $25,000/yr can offset ordinary (W-2) income if you actively participate and your MAGI is under $100k (phasing out to $0 by $150k); unused losses carry forward. On sale, claimed depreciation is recaptured at up to 25%, and gains may owe capital-gains tax (a 1031 exchange can defer both). Figures are a year-1 estimate at your 24.0% rate — not tax advice; consult a CPA.
Schools (NCES district)
- District
- Lowell
- NCES district ID
- 2507020
- Math proficiency
- 20% ▼ -18.00%
- Reading proficiency
- 28% ▼ -11.00%
- Median HH income
- $49,291
- Composite
- 21.14/100
- National rank
- #8430
- State rank
- #277 of 302 in MA
Livability — Lowell
- Score
- 80/100
- State rank
- #36
- US rank
- #1677
Category grades
Schools grade is shown separately in the Schools card above.
Census & demographics
- Census place
- Lowell, MA
- County
- Middlesex County · 1,437,704 people
- City population
- 100,628
- Metro
- Boston-Cambridge-Newton, MA-NH
- Population (ZIP)
- 30,081
- Household income
- $72,709
- Rent vs Own
- Severe rent burden
- 1612.0
Population outlook (Middlesex County) Hauer SSP2
- Today (2025)
- 1,740,269 people
- By 2030
- 1,817,187 · +4.4%
- By 2040
- 1,963,195 · +12.8%
- By 2050
- 2,087,461 · +20.0%
- By 2075
- 2,344,036 · +34.7%
- By 2100
- 2,383,776 · +37.0%
Race, ethnicity, and origin ACS 2023
- Neighborhood character
- Diverse neighborhood (Simpson 0.68)
- Race & ethnicity
- White 50% Hispanic / Latino 22% Asian 13% Black 12% Two or more races 10%
- Hispanic origin (detail)
- Puerto Rican 13% Dominican 3%
- Common ancestry
- Lithuanian 5% Romanian 4% Russian 2%
- Foreign-born
- 22% · Canada, Jamaica, China
- Languages at home
- 65% English-only · Spanish 14% Other Asian/Pacific 7% Other Indo-European 7%
Political lean MEDSL · Middlesex
- 2024 margin
- Solid D (+39.5) · D 68.5% · R 29.0% · Other 2.5%
- 2008→2024 swing
- +9.3pp toward D · 2008: 30.1pp · 2024: 39.5pp
- All cycles
- 2024: D+39.5 2020: D+45.2 2016: D+38.1 2012: D+26.9 2008: D+30.1
Not yet ingested
- Civics
- —
Market trends
- HPI YoY
- ▼ -61.56%
- Current HPI
- 384.5209
- Rent YoY
- ▲ 1.54%
- Metro
- Boston-Cambridge-Newton, MA-NH
- State GDP YoY
- ▲ 2.28%
- F500 in state
- 38
Industry mix (Fortune 500 HQ in MA)
| Industry | F500 HQs | Revenue |
|---|---|---|
| Technology | 3 | $17B |
|
||
| Insurance | 2 | $84B |
|
||
| Retail | 2 | $76B |
|
||
| Life Sciences | 1 | $43B |
|
||
| Energy Technology | 1 | $31B |
|
||
| Aerospace / Defense | 1 | $18B |
|
||
Price history
+650.7% since first listed3 events — show timeline
- 2026-04-30 Pending — MLS PIN
- 2026-02-06 Listed $749,900 MLS PIN
- 1984-12-17 Sold (Public Records) $99,900 Public Records
Property tax history
+4.3%/yrLatest (2025): $7,290 · +6.7% YoY. Source: county tax records.
Cash-flow waterfall
monthlySold comps — $/sqft
last 12 mo · ≤1 miLoading sold comps…