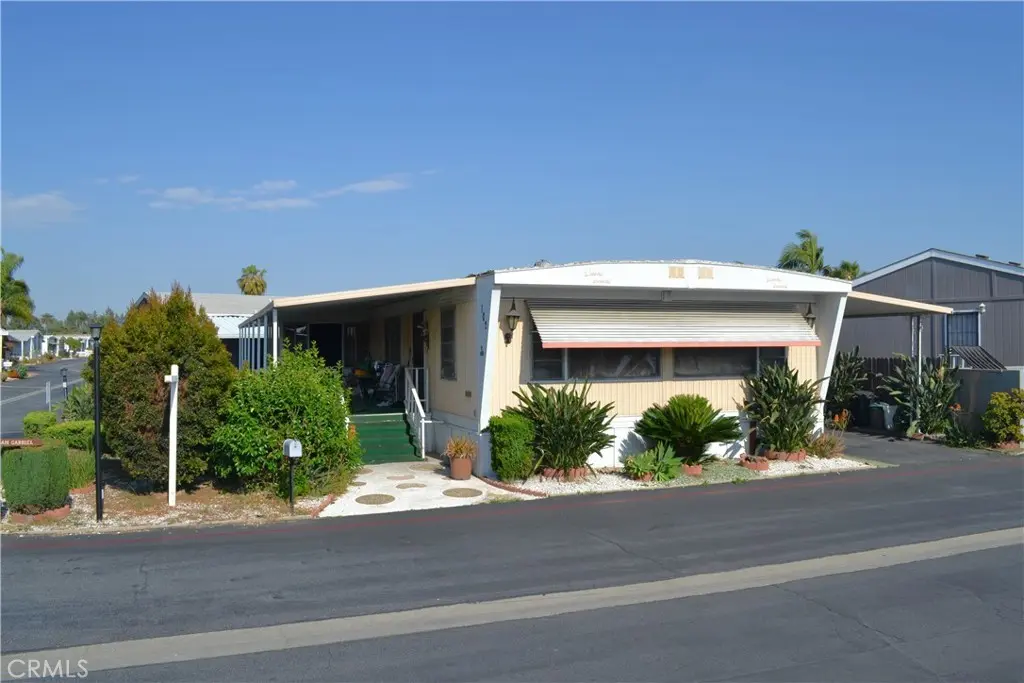
1630 S Barranca Ave #102 · Glendora, CA
Flood risk 1/10 · Minimal
- FEMA flood zone
- X (unshaded)
- Chance of flooding over 30 yrs
- 0.0%
- Est. flood insurance / yr
- $507 – $1,088
Fire risk 3/10 · Minor
- Est. fire insurance / yr
- $659 – $1,223
Heat risk 7/10 · Major
- Hot days now (above 98°F)
- 6 days/yr
- Hot days in 30 yrs
- 17 days/yr
Wind risk 1/10 · Minimal
- Chance of severe wind over 30 yrs
- —
Air-quality risk 7/10 · Major
- Unhealthy air days now
- 15 days/yr
- Unhealthy air days in 30 yrs
- 17 days/yr
Risk factors via First Street. Map © Google.
Why this score? — see what drove the B+ grade
The composite is a weighted blend of 9 inputs, each scored 0–100. Each bar is that input's sub-score; the figure is the points it added to the 100-point composite (weight × sub-score).
- Cash flow +30.0/30.0
- ARV discount +15.0/15.0
- 1% rule +10.0/10.0
- DSCR +10.0/10.0
- Schools +3.3/10.0
- Livability +3.2/5.0
- Rent growth +3.1/5.0
- Condition / age +2.0/5.0
- Appreciation +0.0/10.0
$120,000
🖨 Deal sheet 📄 Offer letter ✓ Due diligence
Listing remarks
Welcome to Glendora, to the Rancho Glendora Mobile Villas neighborhood. We are pleased to present this great opportunity to own a manufactured home in one of the nicest mobile home parks in Glendora. The home needs some TLC and a little imagination with some personal touches. Perfectly situated on a desirable corner lot. This home offers a spacious two bedroom two bath with a large kitchen and living room. Offering a large laundry room for convenience, Located in one of the cleanest and best managed Mobile Home Communities in Glendora. Surrounded by a picturesque view of the beautiful San Gabriel Mountains and hill views. Conveniently
Key facts
- 21.24 acre lot
- 2 parking spots
- Community pool
Property features AI
Finance
- Other: Lot density about 36-40 units per acre
- HOA & community: Community amenities include pool and clubhouse; Land lease at $1,611
Exterior
- Parking: Carport with 2 parking spaces; On-site parking available at Rancho Glendora Mobile Villas
- Utilities: Public sewer; District/Public water
- Home design: Mobile home (Imperial model), 24 ft wide by 60 ft long; Double body type; Single story; Mobile home remains on site
- Construction: Year built per builder
- Exterior features: Community pool; Curbs, street lighting, biking and hiking nearby
Interior
- Bathrooms: Two full bathrooms
- Heating & cooling: Wall heater
- Interior features: One-level home; Single-story entry
- Laundry & utility: Washer hookup; Gas dryer hookup
Neighborhood map
What this means for you Summary
Snapshot
- This is a 2-bed/2.0-bath manufactured listed at $120k. Condition is rated fair.
Deal economics
- At list price, monthly cash flow is $2k ($19k/yr) — positive.
- The deal already cash-flows at list — no discount required.
- Meets the 1% rule at list price ($3k rent vs $120k).
- Recommended offer: $116k (3.0% below list) — sets the bar for market timing.
- Cap rate 22.4% vs local median 2.4% in Glendora — top-decile yield for the area; either an underpriced asset or a hidden risk that comps aren't pricing in. Stress-test before assuming the spread holds.
Location & tenants
- Location reads 65/100 on livability (#373 in CA) — a middle-class / working-renter tenant base. Strengths: commute A+, employment A+, schools B; Watch: amenities F, cost of living F, health & safety F.
- Azusa Unified (suburban): math 30% / reading 39% proficiency, ranked #874 of 1,400 in CA (top 62%) — families likely to look elsewhere, expect single-tenant / working-renter base with shorter leases; 70% free/reduced lunch — lower-income household profile, screen leases tightly.
- Market conditions: Rents rising (+2.6%/yr); 52 active listings in the ZIP; 29 comparable units currently listed for rent nearby; rentals leasing fast (median 6d on market — plan ~1-2 weeks tenant-placement turnaround); solid renter incomes; 19,697 units permitted in Los Angeles County in 2024 (9,426 in 5+ unit buildings).
- This rent runs 36% of the median local income ($99k/yr) — at the standard rent-burdened threshold; future hikes will face affordability resistance.
Forward outlook
- Local home prices are declining (-3.0%/yr); year-one equity from $830 of loan paydown is wiped out by about $4k of value loss. Plan a longer hold.
- Los Angeles County population projected at +9% by 2050 — modest demand growth; plan on rents tracking national, not racing it.
- At projected returns (-3.0% appreciation + 2.6% rent growth), your $34k cash investment doubles in ~2 years — after that, you're playing with house money.
Negotiation context
- It's been on market 48 days — a 3% lower offer ($116k) is reasonable based on typical stale-listing flexibility.
Risks & watch-outs
- Climate carrying-cost: extreme-heat days projected 6→17/yr by 2055 (HVAC capex compounding) — expect insurance premiums to compound above CPI over the hold.
Questions for the listing agent
- It's been on market 48 days. Have you received any prior offers? Is the seller open to a 3% concession, seller financing, or rate buy-down credit?
- Have any recent inspections been done? Can we get a copy of the seller's disclosures and any deferred-maintenance estimates?
- Built in 1969 — when were the roof, HVAC, electrical panel, plumbing, and water heater last replaced?
- Is there a deadline driving the sale (1031 exchange, divorce, estate, relocation)? That informs how much negotiation room exists.
- Schools are B-rated — typically a magnet for longer-tenancy family renters. What's the average tenant stay here, and is there a school-zone premium baked into asking?
- What's the average days-on-market for RENTAL listings here right now (not sales)? A rising rental-DOM trend means longer vacancies and softer asking-rent achievability than the comps imply.
- What's the recent tenant-quality profile in this submarket — average credit score on applications, eviction rate, late-payment / NSF rate, and stable-employment percentage? A property-management company in the area should have these aggregated.
- How much new for-sale + rental construction is in the pipeline within 1–3 miles? Heavy new supply typically softens prices + rents 12–24 months out; constrained supply supports both.
Investment metrics
- 1% rule
- 2.45% ✓
- Cap rate
- 22.42%
- Cash-on-cash
- 57.59%
- DSCR
- 3.56
- GRM
- 3.4
CMA / ARV
- ARV (median comp)
- $152,849
- List price
- $120,000
- Delta
- -21.49%
- Verdict
- UNDERPRICED
- Comps
- 20 within 1.0 mi
Show comp detail 8 sales within ~0.75 mi
| Address | Dist | Beds/Ba | Sqft | Sold | Price | $/sf | Match |
|---|---|---|---|---|---|---|---|
| 1630 S Barranca #126 | 0.00mi | 2/1.5 | 1,368 (-2%) | 3mo | $159,000 | $116 | 93 |
| 1630-41 S Barranca Ave | 0.00mi | 3/2.0 (+1) | 1,368 (-2%) | 4mo | $155,000 | $113 | 89 |
| 1630 Barranca Ave #88 | 0.00mi | 3/2.0 (+1) | 1,400 (+1%) | 12mo | $188,000 | $134 | 84 |
| 1630 S Barranca #53 | 0.00mi | 2/2.0 | 1,440 (+3%) | 12mo | $145,000 | $101 | 84 |
| 1630 S Barranca Ave #173 | 0.00mi | 3/2.0 (+1) | 1,539 (+11%) | 3mo | $210,000 | $136 | 75 |
| 1630 S Barranca Ave #1 | 0.07mi | 3/2.0 (+1) | 1,456 (+5%) | 12mo | $225,000 | $155 | 74 |
| 1630 S Barranca Ave #39 | 0.00mi | 3/2.0 (+1) | 1,560 (+12%) | 4mo | $190,000 | $122 | 72 |
| 1630 S Barranca Ave #20 | 0.00mi | 2/2.0 | 1,200 (-14%) | 10mo | $170,000 | $142 | 68 |
Match score weights: distance 35% · size 25% · config 20% · recency 20%. Top-matched comps best support the ARV.
Projected returns pro-forma
-3.0% appreciation · 2.59% rent growth · sell at horizon
- IRR
- 55.6%
- Equity multiple
- 3.44×
- Total profit
- $82,012
- Equity at exit
- $17,892
- IRR
- 60.5%
- Equity multiple
- 6.91×
- Total profit
- $198,617
- Equity at exit
- $10,375
Cash invested: $33,600 (down + closing). Projections, not guarantees.
Landlord ↔ Tenant lean methodology
- Overall (STATE)
- 18 Strongly Tenant-Friendly
- State California
- 18 Strongly Tenant-Friendly · D+13
- County
- — inherits STATE
- City
- — inherits STATE
ZIP-level market 91740
- Rents YoY
- 2.6%
- Active inventory
- 52
- Price-to-rent
- 3.4×
Monthly cashflow live
- Estimated rent
- $2,937 high interval (Pro) →
- Mortgage (P&I)
- −$629
- Tax from tax record
- −$28 /mo · $341/yr
- Insurance
- −$50
- HOA
- −$0
- Vacancy / Maint / Mgmt
- −$617
- Net cashflow
- $1,612
Break-even live
UW: 25.0% down · 7.5% · 30yr · 1.5% tax · 5.0% vac · 8.0% maint · 8.0% mgmt
Financing live
Cash to close
- Down payment
- $30,000
- Closing costs
- $3,600
- Reserves months
- —
- Total cash needed
- —
Loan-product check · same deal, 3 products live
Conventional
25% down · 7.5% · 30yr
- Down + closing
- —
- Monthly P&I
- —
- Monthly cashflow
- —
- DSCR
- —
- Eligible?
- —
Personal DTI + credit; lowest rate.
DSCR
20% down · 8.5% · 30yr
- Down + closing
- —
- Monthly P&I
- —
- Monthly cashflow
- —
- DSCR
- —
- Eligible?
- —
No personal income docs; deal must DSCR.
Hard money
10% down · 12.0% · 12mo
- Down + closing
- —
- Monthly P&I
- —
- Monthly cashflow
- —
- DSCR
- —
- Eligible?
- —
Short-term bridge; refi at stabilization.
Rent comps 29 comps
| Address | Beds | Baths | Sqft | Rent | $/sqft | DOM | Units | Dist |
|---|---|---|---|---|---|---|---|---|
| 5442 N Ranger Dr Covina, CA | 2.0 | 1.5 | 1032 | $2,975 | $2.88 | 43d | 1 | 0.44mi |
| 18645 E Arrow Hwy Covina, CA | 2.0 | — | 919 | $2,129 | $2.32 | 13d | 1 | 0.47mi |
| 1400 N Grand Ave Covina, CA | 1.0–2.0 | 1.0–2.0 | 846 | $2,720 | $3.22 | 1d | 5 | 0.47mi |
| 440 W Gladstone St Glendora, CA | 1.0–2.0 | 1.0–2.0 | 875 | $2,390 | $2.73 | 1d | 9 | 0.52mi |
| 18537 E Arrow Hwy Covina, CA | 1.0–2.0 | 1.0–2.5 | 937 | $2,650 | $2.83 | 4d | 7 | 0.55mi |
| 435 W Gladstone St Glendora, CA | 2.0 | 2.0 | 1200 | $2,994 | $2.49 | 1d | 2 | 0.57mi |
| 261 W Newburgh St Glendora, CA | 3.0 | 2.0 | 1671 | $3,800 | $2.27 | 1d | 1 | 0.63mi |
| 777 S Citrus Ave #107 Azusa, CA | 2.0 | 2.0 | 994 | $2,650 | $2.67 | 24d | 1 | 0.68mi |
| 1632 S Glendora Ave Glendora, CA | 3.0 | 2.0 | 1000 | $3,200 | $3.20 | 6d | 1 | 0.89mi |
| 1620 S Glendora Ave Glendora, CA | 3.0 | 2.0 | 1450 | $3,500 | $2.41 | 6d | 1 | 0.92mi |
| 826 N Barranca Ave Covina, CA | 1.0–2.0 | 1.0–2.0 | 762 | $2,295 | $3.01 | 43d | 2 | 0.98mi |
| 749 Marmalade Pl Covina, CA | 3.0 | 2.0 | 1620 | $3,600 | $2.22 | 1d | 1 | 1.07mi |
| 1061 N Glendora Ave Covina, CA | 2.0 | 2.0 | 1212 | $2,850 | $2.35 | 43d | 1 | 1.08mi |
| 20240 E Arrow Hwy Unit D Covina, CA | 3.0 | 2.5 | 1477 | $3,350 | $2.27 | 43d | 1 | 1.22mi |
| 20254 E Arrow Hwy Unit B Covina, CA | 3.0 | 2.5 | 1477 | $3,100 | $2.10 | 24d | 1 | 1.24mi |
| 707 N Park Ave Covina, CA | 2.0 | 2.0 | 900 | $2,900 | $3.22 | 43d | 1 | 1.25mi |
| 1130 E Alosta Ave Azusa, CA | 1.0–2.0 | 1.0 | 907 | $2,450 | $2.70 | 2d | 2 | 1.30mi |
| 4658 N Midsite Ave Covina, CA | 3.0 | 2.0 | 1150 | $3,500 | $3.04 | 24d | 1 | 1.33mi |
| 367 N Prospero Dr Covina, CA | 2.0 | 2.0 | 1000 | $1,950 | $1.95 | 7d | 1 | 1.34mi |
| 959 E Edgecomb St Covina, CA | 3.0 | 2.0 | 1335 | $5,000 | $3.75 | 2d | 1 | 1.34mi |
| 1000 E Alosta Ave Azusa, CA | 1.0–2.0 | 1.0 | 755 | $2,373 | $3.14 | 1d | 5 | 1.37mi |
| 230 N Calvados Ave Azusa, CA | 3.0 | 2.0 | 1396 | $3,850 | $2.76 | 1d | 1 | 1.38mi |
| 371 N Powell Ave Azusa, CA | 2.0 | 2.0 | 1000 | $2,395 | $2.40 | 43d | 3 | 1.39mi |
| 371 N Powell Ave Azusa, CA | 2.0 | 2.0 | 1000 | $2,395 | $2.40 | 20d | 1 | 1.39mi |
| 422 W Route 66 #39 Glendora, CA | 2.0 | 3.0 | 1260 | $3,400 | $2.70 | 1d | 1 | 1.41mi |
| 628 E Italia St Unit 3 Covina, CA | 2.0 | 1.5 | 900 | $1,850 | $2.06 | 7d | 1 | 1.43mi |
| 852 E Fielding St Unit B4 Azusa, CA | 1.0 | 1.0 | 1860 | $1,100 | $0.59 | 43d | 1 | 1.46mi |
| 316 N Calvados Ave Azusa, CA | 3.0 | 2.5 | 1513 | $3,200 | $2.12 | 2d | 1 | 1.46mi |
| 559 E Juanita Ave Glendora, CA | 3.0 | 3.0 | 1000 | $4,500 | $4.50 | 1d | 1 | 1.49mi |
Listing history 15 events
-
2026-06-18days on market $120,000 Active 48 DOM
-
2026-06-17days on market $120,000 Active 47 DOM
-
2026-06-16days on market $120,000 Active 46 DOM
-
2026-06-15days on market $120,000 Active 45 DOM
-
2026-06-13days on market $120,000 Active 43 DOM
-
2026-06-13days on market $120,000 Active 42 DOM
-
2026-06-09days on market $120,000 Active 39 DOM
-
2026-06-08days on market $120,000 Active 38 DOM
-
2026-06-07days on market $120,000 Active 37 DOM
-
2026-06-04days on market $120,000 Active 34 DOM
-
2026-06-03days on market $120,000 Active 33 DOM
-
2026-06-02days on market $120,000 Active 32 DOM
-
2026-06-01days on market $120,000 Active 31 DOM
-
2026-05-31days on market $120,000 Active 30 DOM
-
2026-05-01$120,000 Active 839-char remark
ⓘ Source: listings_history table (triggers on properties + properties_extension) + one-shot
backfill from property_details.listing_events for pre-trigger history.
Tax reassessment forecast CA · Resets to sale price
- Current annual tax
- $341 · $28/mo
- Projected year-2 tax
- $912 · $76/mo
- Expected delta
- +$571/yr (+$48/mo · 167.4%)
ⓘ Screening estimate from a state-policy table — verify with the county assessor before closing.
Climate risk First Street
- Flood 1/10 Low FEMA zone X (unshaded) · 0% chance over 30 yrs
- Wildfire 3/10 Moderate
- Heat 7/10 Severe 6 d/yr ≥98°F today · 17 d/yr by 30 yrs out
- Wind 1/10 Low
- Air quality 7/10 Severe 15 unhealthy d/yr today · 17 by 30 yrs out
Nearby sold comps map
Loading sold comps map…
Walkable amenities ~0.75 mi
Loading nearby amenities…
Taxation est. · year 1
- Rental income
- $35,242
- − Mortgage interest
- −$6,722
- − Property taxes
- −$341
- − Insurance
- −$600
- − Repairs & maintenance
- −$2,819
- − Management
- −$2,819
- − Depreciation
- −$3,491
- Taxable income
- $18,450
- Est. tax owed @ 24.0%
- −$4,428
- After-tax cash flow
- $14,921/yr
For passive investors: Depreciation is non-cash, so a rental often shows a tax loss while cash-flowing — sheltering income. Rental losses are passive: they offset passive income freely, and up to $25,000/yr can offset ordinary (W-2) income if you actively participate and your MAGI is under $100k (phasing out to $0 by $150k); unused losses carry forward. On sale, claimed depreciation is recaptured at up to 25%, and gains may owe capital-gains tax (a 1031 exchange can defer both). Figures are a year-1 estimate at your 24.0% rate — not tax advice; consult a CPA.
Condition & rehab AI · 7 photos
This manufactured home requires moderate repairs and maintenance to improve its condition and value.
Repairs flagged
- Major exterior siding — Severe weathering
- Major exterior paint — Peeling paint
- Major flooring — Worn carpet
- Major interior walls — Painted walls with visible wear
Value-add opportunities
- Resale paint exterior — Enhances curb appeal
- Rental replace carpet — Improves living space comfort
Renovation cost estimate screening
| Repair item | Severity | Est. cost |
|---|---|---|
| exterior siding · Severe weathering | Major | $15,000–50,000 |
| exterior paint · Peeling paint | Major | $15,000–50,000 |
| flooring · Worn carpet | Major | $15,000–50,000 |
| interior walls · Painted walls with visible wear | Major | $15,000–50,000 |
| Total estimated repair cost · 4 items | $60,000–200,000 |
Value-add ROI direction
- Resale paint exterior — Enhances curb appeal ↑
- Rental replace carpet — Improves living space comfort ↑
ⓘ Cost ranges are severity-bucket heuristics (US national rule-of-thumb). Get contractor quotes + a written scope before underwriting a rehab budget.
Schools (NCES district)
- District
- Azusa Unified
- NCES district ID
- 0603600
- Math proficiency
- 30% ▲ 2.00%
- Reading proficiency
- 39% ▬ 0.00%
- Median HH income
- $58,149
- Composite
- 33.35/100
- National rank
- #10566
- State rank
- #874 of 1400 in CA
Livability — Glendora
- Score
- 65/100
- State rank
- #373
- US rank
- #12710
Category grades
Schools grade is shown separately in the Schools card above.
Census & demographics
- Census place
- Glendora, CA
- County
- Los Angeles County · 9,444,647 people
- City population
- 52,239
- Metro
- Los Angeles-Long Beach-Anaheim, CA
- Population (ZIP)
- 26,168
- Household income
- $99,083
- Rent vs Own
- Severe rent burden
- 1034.0
Population outlook (Los Angeles County) Hauer SSP2
- Today (2025)
- 10,940,515 people
- By 2030
- 11,256,481 · +2.9%
- By 2040
- 11,729,929 · +7.2%
- By 2050
- 11,948,407 · +9.2%
- By 2075
- 11,818,114 · +8.0%
- By 2100
- 10,842,928 · -0.9%
Race, ethnicity, and origin ACS 2023
- Neighborhood character
- Diverse neighborhood (Simpson 0.64)
- Race & ethnicity
- Hispanic / Latino 49% White 33% Two or more races 21% Asian 10% Black 3% Native American 1%
- Hispanic origin (detail)
- Mexican 37% Cuban 1%
- Common ancestry
- Lithuanian 1% Portuguese 1% Romanian 1%
- Foreign-born
- 22% · Canada, China, Vietnam
- Languages at home
- 63% English-only · Spanish 24% Chinese 4% Arabic 3%
Political lean MEDSL · Los Angeles
- 2024 margin
- Solid D (+32.9) · D 64.8% · R 31.9% · Other 3.3%
- 2008→2024 swing
- -7.4pp toward R · 2008: 40.4pp · 2024: 32.9pp
- All cycles
- 2024: D+32.9 2020: D+44.2 2016: D+48.0 2012: D+40.0 2008: D+40.4
Not yet ingested
- Civics
- —
Market trends
- HPI YoY
- ▼ -847.76%
- Current HPI
- 378.3547
- Rent YoY
- ▲ 2.59%
- Metro
- Los Angeles-Long Beach-Anaheim, CA
- State GDP YoY
- ▲ 3.21%
- F500 in state
- 116
Industry mix (Fortune 500 HQ in CA)
| Industry | F500 HQs | Revenue |
|---|---|---|
| Technology | 27 | $1,492B |
|
||
| Financial Services | 3 | $174B |
|
||
| Retail | 3 | $44B |
|
||
| Insurance | 3 | $26B |
|
||
| Media / Entertainment | 2 | $115B |
|
||
| Pharmaceuticals / Biotech | 2 | $62B |
|
||
Price history
1 event — show timeline
- 2026-05-01 Listed $120,000 CRMLS
Property tax history
+9.0%/yrLatest (2025): $341 · +9.0% YoY. Source: county tax records.
Cash-flow waterfall
monthlySold comps — $/sqft
last 12 mo · ≤1 miLoading sold comps…