 Duplex
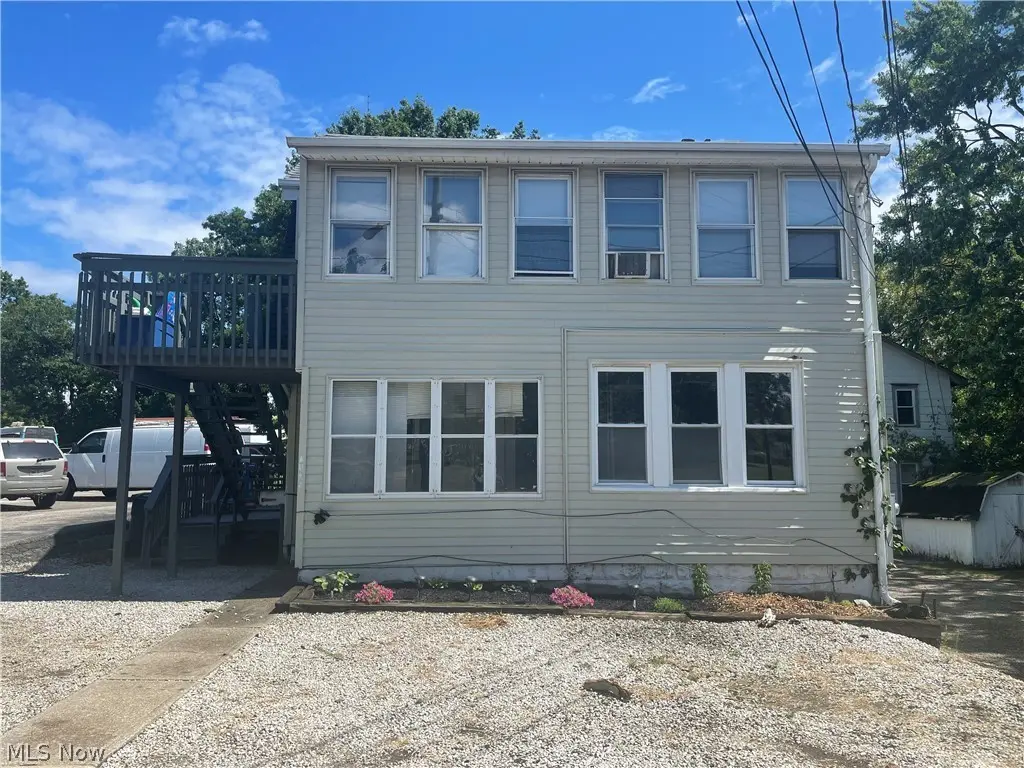
1365 East Ave · Akron, OH
Flood risk 1/10 · Minimal
- FEMA flood zone
- X (unshaded)
- Chance of flooding over 30 yrs
- 0.0%
- Est. flood insurance / yr
- $473 – $860
Fire risk 1/10 · Minimal
- Est. fire insurance / yr
- $713 – $1,323
Heat risk 3/10 · Minor
- Hot days now (above 96°F)
- 7 days/yr
- Hot days in 30 yrs
- 16 days/yr
Wind risk 1/10 · Minimal
- Chance of severe wind over 30 yrs
- —
Air-quality risk 2/10 · Minimal
- Unhealthy air days now
- 1 days/yr
- Unhealthy air days in 30 yrs
- 2 days/yr
Risk factors via First Street. Map © Google.
Why this score? — see what drove the A- grade
The composite is a weighted blend of 9 inputs, each scored 0–100. Each bar is that input's sub-score; the figure is the points it added to the 100-point composite (weight × sub-score).
- Cash flow +30.0/30.0
- ARV discount +15.0/15.0
- 1% rule +10.0/10.0
- DSCR +10.0/10.0
- Appreciation +4.9/10.0
- Livability +4.0/5.0
- Rent growth +2.5/5.0
- Condition / age +2.5/5.0
- Schools +2.1/10.0
$85,000
🖨 Deal sheet (PDF) 📄 Offer letter ✓ Due diligence
Multi-family units
County records classify this as Multi-Family (2-4 Unit). Listing-text estimate: 2 units. confirmed
Listing remarks MLS
Investment opportunity! Two units! Bottom unit has been refigured to accommodate a two-bedroom layout. The bathroom subfloor has been replaced, and a new back door to the common basement has been installed. The owner will be responsible for paying all utilities. Seller financing will only be entertained with a much higher purchase price, a significant down payment, and interest. Please allow for 48 hours to schedule showings!
Key facts
- New back door
- Two bedroom layout
- 3,323 sq ft lot
Tags
Neighborhood map
What this means for you Summary
Snapshot
- This is a 2 × 2-bed/2.0-bath units multifamily listed at $85k.
Deal economics
- At list price, monthly cash flow is $810 ($10k/yr) — positive. Per door: $405/mo.
- The deal already cash-flows at list — no discount required.
- Meets the 1% rule at list price ($2k rent vs $85k).
- Recommended offer: $77k (9.0% below list) — sets the bar for market timing.
- Cap rate 17.7% vs local median 6.6% in Akron — top-decile yield for the area; either an underpriced asset or a hidden risk that comps aren't pricing in. Stress-test before assuming the spread holds.
Location & tenants
- Location reads 81/100 on livability (#104 in OH, #1,591 nationally) — a professional / high-income tenant draw. Strengths: amenities A+, commute A+, cost of living A+; Watch: crime F, employment F.
- Akron City (urban): math 22% / reading 30% proficiency, ranked #602 of 656 in OH (top 92%) — low school quality limits family demand, transient renter base, plan for 1-2y turnover; 66% free/reduced lunch — lower-income household profile, screen leases tightly.
- Zoned schools: Helen Arnold Community Learning Center (math 12% / reading 22%, grade F, #1,337 of 1,584 statewide, top 86%, 231 students, 0% FRL); National Inventors Hall of Fame School Center For Stem (math 45% / reading 56%, grade C, #413 of 654 statewide, top 63%, 406 students, 0% FRL); Akron Early College High School (math 62% / reading 98%, grade A, #34 of 781 statewide, top 4%, 377 students, 0% FRL) — zoned schools average 0% FRL vs 66% district-wide (66 pts lower); this property's tenant base skews higher-income than the district average.
- Zoned-school proficiency averages 49% at this address vs 26% district-wide (+23 pts) — the actual schools serving this property are materially stronger than the Akron City average implies; a family-tenant draw the district grade alone would hide.
- Market conditions: 42 active listings in the ZIP; 39 comparable units currently listed for rent nearby; rentals at typical pace (median 25d on market — plan ~3-4 weeks tenant-placement turnaround); 46% of comp listings sitting > 30 days — soft ceiling on asking rent; lower-income renter base — watch delinquency; 1,114 units permitted in Summit County in 2024 (397 in 5+ unit buildings).
Forward outlook
- In year one you build about $421 of equity ($588 loan paydown + $-167 appreciation (-0.2% local appreciation)).
- Summit County population projected to shrink 6% by 2050 — rents likely to lag national; underwrite the cash flow, not the appreciation.
- At projected returns (-0.2% appreciation + 3.0% rent growth), your $24k cash investment doubles in ~3 years — after that, you're playing with house money.
Negotiation context
- It's been on market 108 days — a 9% lower offer ($77k) is reasonable based on typical stale-listing flexibility.
- 10 sale attempts since 27y ago; this cycle's ask has dropped $5k (6%) from the opening price — seller is motivated, your offer sets the floor, not the list.
- Current owner paid $41k; list at $85k implies a 106% gain — meaningful room to come down on a strong offer.
Risks & watch-outs
- Watch-outs: built in 1925 — expect roof / HVAC / electrical / plumbing capex.
Questions for the listing agent
- It's been on market 108 days. Have you received any prior offers? Is the seller open to a 9% concession, seller financing, or rate buy-down credit?
- Can we see the unit-by-unit rent roll, current vacancy, and any below-market leases? What's the average tenancy length?
- What capital expenditures (roof, boiler, parking lot, exteriors) have been made in the last 5 years, and what's planned in the next 2?
- Built in 1925 — when were the roof, HVAC, electrical panel, plumbing, and water heater last replaced?
- Why hasn't it sold? Are there any deal-killer items the seller is aware of (foundation, flood, title, zoning, code violations)?
- Is there a deadline driving the sale (1031 exchange, divorce, estate, relocation)? That informs how much negotiation room exists.
- Crime grade is F in this area — have there been break-ins, vandalism, or insurance claims at this property in the last 3 years? What carrier currently insures it and at what premium?
- What's the average days-on-market for RENTAL listings here right now (not sales)? A rising rental-DOM trend means longer vacancies and softer asking-rent achievability than the comps imply.
- What's the recent tenant-quality profile in this submarket — average credit score on applications, eviction rate, late-payment / NSF rate, and stable-employment percentage? A property-management company in the area should have these aggregated.
- How much new apartment / multifamily construction is in the pipeline within 1–3 miles? Heavy new supply (>2% of stock underway) typically softens rents 12–24 months out; light construction supports rent growth.
Investment metrics
- 1% rule
- 2.07% ✓
- Cap rate
- 17.72%
- Cash-on-cash
- 40.82%
- DSCR
- 2.82
- GRM
- 4.0
CMA / ARV
- ARV (median comp)
- $148,000
- List price
- $85,000
- Delta
- -42.57%
- Verdict
- UNDERPRICED
- Comps
- 20 within 1.0 mi
Show comp detail 2 sales within ~0.75 mi
| Address | Dist | Beds/Ba | Sqft | Sold | Price | $/sf | Match |
|---|---|---|---|---|---|---|---|
| 677 Vernon Odom Blvd | 0.68mi | 3/2.0 | 1,384 (+2%) | 6mo | $39,000 | $28 | 58 |
| 779 & 781 Jason Ave | 0.58mi | 4/2.0 (+1) | 1,440 (+6%) | 1mo | $152,000 | $106 | 55 |
Match score weights: distance 35% · size 25% · config 20% · recency 20%. Top-matched comps best support the ARV.
Projected returns pro-forma
-0.2% appreciation · 3.0% rent growth · sell at horizon
- IRR
- 41.6%
- Equity multiple
- 3.03×
- Total profit
- $48,318
- Equity at exit
- $23,850
- IRR
- 44.8%
- Equity multiple
- 5.99×
- Total profit
- $118,832
- Equity at exit
- $28,013
Cash invested: $23,800 (down + closing). Projections, not guarantees.
Landlord ↔ Tenant lean methodology
- Overall (STATE)
- 73 Landlord-Friendly
- State Ohio
- 73 Landlord-Friendly · R+6
- County
- — inherits STATE
- City
- — inherits STATE
ZIP-level market 44307
- Home prices YoY
- -0.2%
- Active inventory
- 42
- Price-to-rent
- 8.1×
Monthly cashflow live
- Estimated rent
- $1,756 high interval (Pro) →
- Mortgage (P&I)
- −$446
- Tax from tax record
- −$96 /mo · $1,157/yr
- Insurance
- −$35
- HOA
- −$0
- Vacancy / Maint / Mgmt
- −$369
- Net cashflow
- $810
Break-even live
Sensitivity live
| Price | -10% $858 | -5% $834 | +0% $810 | +5% $786 | +10% $762 |
|---|---|---|---|---|---|
| Rent | -10% $671 | -5% $740 | +0% $810 | +5% $879 | +10% $948 |
| Rate | -1.0pp $852 | -0.5pp $831 | base $810 | +0.5pp $788 | +1.0pp $765 |
2-unit breakdown (identical units grouped — click to expand)
| Units | Beds | Baths | Est. rent |
|---|---|---|---|
| 2× units | 2 | 2 | $1,756 |
| #1 | 2 | 2 | $878 |
| #2 | 2 | 2 | $878 |
| Total (2 units) | $1,756 | ||
UW: 25.0% down · 7.5% · 30yr · 1.5% tax · 5.0% vac · 8.0% maint · 8.0% mgmt
Financing live
Cash to close
- Down payment
- $21,250
- Closing costs
- $2,550
- Reserves months
- —
- Total cash needed
- —
Loan-product check · same deal, 3 products live
Conventional
25% down · 7.5% · 30yr
- Down + closing
- —
- Monthly P&I
- —
- Monthly cashflow
- —
- DSCR
- —
- Eligible?
- —
Personal DTI + credit; lowest rate.
DSCR
20% down · 8.5% · 30yr
- Down + closing
- —
- Monthly P&I
- —
- Monthly cashflow
- —
- DSCR
- —
- Eligible?
- —
No personal income docs; deal must DSCR.
Hard money
10% down · 12.0% · 12mo
- Down + closing
- —
- Monthly P&I
- —
- Monthly cashflow
- —
- DSCR
- —
- Eligible?
- —
Short-term bridge; refi at stabilization.
Rent comps 39 comps
| Address | Beds | Baths | Sqft | Rent | $/sqft | DOM | Units | Dist |
|---|---|---|---|---|---|---|---|---|
| 685 Longview Ave Akron, OH | 3.0 | 1.0 | 1100 | $1,150 | $1.05 | 45d | 1 | 0.21mi |
| 1313 Manchester Rd Akron, OH | 3.0 | 1.0 | 1221 | $1,200 | $0.98 | 22d | 1 | 0.25mi |
| 1171 La Croix Ave Unit 2 Akron, OH | 2.0 | 1.0 | 1267 | $975 | $0.77 | 45d | 1 | 0.31mi |
| 1161 La Croix Ave Akron, OH | 3.0 | 1.0 | 1452 | $1,200 | $0.83 | 25d | 1 | 0.31mi |
| 783 Leonard St Akron, OH | 3.0 | 1.0 | 1040 | $1,250 | $1.20 | 45d | 1 | 0.47mi |
| 760 Lakewood Blvd Akron, OH | 3.0 | 2.0 | 1398 | $1,150 | $0.82 | 25d | 1 | 0.51mi |
| 991 Diana Ave Akron, OH | 3.0 | 2.0 | 1264 | $1,325 | $1.05 | 45d | 1 | 0.52mi |
| 1069 Fess Ave Akron, OH | 2.0 | 1.0 | 940 | $1,095 | $1.16 | 45d | 1 | 0.54mi |
| 1032 Andrew St Akron, OH | 3.0 | 1.0 | 960 | $1,097 | $1.14 | 45d | 1 | 0.54mi |
| 1494 Diagonal Rd Akron, OH | 3.0 | 1.0 | 1064 | $1,495 | $1.41 | 45d | 1 | 0.67mi |
| 960 Jason Ave Akron, OH | 3.0 | 1.5 | 935 | $1,095 | $1.17 | 22d | 1 | 0.68mi |
| 527 Brady Ave Akron, OH | 3.0 | 1.5 | 1416 | $1,395 | $0.99 | 45d | 1 | 0.78mi |
| 1092 Peerless Ave Akron, OH | 3.0 | 1.0 | 998 | $1,200 | $1.20 | 45d | 1 | 0.81mi |
| 384 W Bartges St Akron, OH | 2.0 | 1.0 | 1024 | $1,100 | $1.07 | 45d | 1 | 0.93mi |
| 875 Harrison Ave Akron, OH | 3.0 | 1.0 | 1157 | $1,150 | $0.99 | 15d | 1 | 0.99mi |
| 730 Noble Ave Akron, OH | 3.0 | 1.0 | 1092 | $1,200 | $1.10 | 25d | 1 | 1.01mi |
| 1127 Victory St Unit 1129 Akron, OH | 3.0 | 1.0 | 1368 | $950 | $0.69 | 45d | 1 | 1.03mi |
| 783 Boulevard St Akron, OH | 4.0 | 1.0 | 1440 | $999 | $0.69 | 25d | 1 | 1.05mi |
| 721 Polk Ave Akron, OH | 3.0 | 1.5 | 1500 | $1,600 | $1.07 | 25d | 1 | 1.07mi |
| 1090 Hartford Ave Akron, OH | 4.0 | 1.0 | 1328 | $1,125 | $0.85 | 45d | 1 | 1.11mi |
| 773 Montana Ave Akron, OH | 3.0 | 1.5 | 1128 | $1,195 | $1.06 | 25d | 1 | 1.14mi |
| 844 Lawton St Akron, OH | 4.0 | 2.0 | 1240 | $1,175 | $0.95 | 45d | 1 | 1.15mi |
| 961 Lawton St Akron, OH | 3.0 | 1.0 | 1144 | $1,450 | $1.27 | 15d | 1 | 1.16mi |
| 1328 Thurston St Unit 1328 Akron, OH | 3.0 | 1.0 | 900 | $925 | $1.03 | 25d | 1 | 1.17mi |
| 1326 Thurston St Unit 1326 Akron, OH | 3.0 | 1.0 | 900 | $925 | $1.03 | 25d | 1 | 1.17mi |
| 931 Trimble Dr Akron, OH | 2.0 | 1.5 | 1448 | $1,495 | $1.03 | 25d | 1 | 1.18mi |
| 1331 Thurston St Unit 1326 Akron, OH | 3.0 | 1.0 | 900 | $925 | $1.03 | 45d | 1 | 1.20mi |
| 2160 12th St SW Akron, OH | 3.0 | 1.0 | 1445 | $1,300 | $0.90 | 45d | 1 | 1.26mi |
| 2139 18th St SW Akron, OH | 2.0 | 1.0 | 992 | $1,100 | $1.11 | 45d | 1 | 1.27mi |
| 2163 13th St SW Akron, OH | 3.0 | 2.5 | 1480 | $1,150 | $0.78 | 45d | 1 | 1.27mi |
| 575 Noble Ave Akron, OH | 3.0 | 1.0 | 1300 | $1,350 | $1.04 | 15d | 1 | 1.30mi |
| 1161 Seward Ave Akron, OH | 3.0 | 1.5 | 1000 | $1,200 | $1.20 | 15d | 1 | 1.33mi |
| 1029 Harpster Ave Akron, OH | 4.0 | 1.0 | 1403 | $1,250 | $0.89 | 15d | 1 | 1.36mi |
| 2222 12th St SW Akron, OH | 3.0 | 1.5 | 1270 | $1,050 | $0.83 | 45d | 1 | 1.38mi |
| 2211 18th St SW Akron, OH | 3.0 | 1.0 | 1332 | $1,250 | $0.94 | 15d | 1 | 1.40mi |
| 2250 11th St SW Akron, OH | 3.0 | 1.0 | 1308 | $1,350 | $1.03 | 15d | 1 | 1.43mi |
| 677 Crossings Ln Akron, OH | 3.0 | 2.5 | 1440 | $1,950 | $1.35 | 25d | 1 | 1.43mi |
| 720 Florida Ave Akron, OH | 4.0 | 1.0 | 1124 | $1,500 | $1.33 | 15d | 1 | 1.45mi |
| 2138 East Ave Akron, OH | 3.0 | 1.0 | 990 | $1,100 | $1.11 | 25d | 1 | 1.47mi |
Listing history 34 events
-
2026-06-13statusdays on market $85,000 Pending 108 DOM
-
2026-06-10days on market $85,000 Contingent 107 DOM
-
2026-06-09days on market $85,000 Contingent 106 DOM
-
2026-06-08days on market $85,000 Contingent 105 DOM
-
2026-06-07days on market $85,000 Contingent 104 DOM
-
2026-06-05days on market $85,000 Contingent 101 DOM
-
2026-06-03days on market $85,000 Contingent 100 DOM
-
2026-06-02days on market $85,000 Contingent 99 DOM
-
2026-06-01days on market $85,000 Contingent 98 DOM
-
2026-05-31days on market $85,000 Contingent 97 DOM
-
2026-05-31days on market $85,000 Contingent 96 DOM
-
2026-05-01price $85,000 430-char remark
Show marketing remark (430 chars)
Investment opportunity! Two units! Bottom unit has been refigured to accommodate a two-bedroom layout. The bathroom subfloor has been replaced, and a new back door to the common basement has been installed. The owner will be responsible for paying all utilities. Seller financing will only be entertained with a much higher purchase price, a significant down payment, and interest. Please allow for 48 hours to schedule showings!
-
2026-02-20$90,000 Active 430-char remark
Show marketing remark (430 chars)
Investment opportunity! Two units! Bottom unit has been refigured to accommodate a two-bedroom layout. The bathroom subfloor has been replaced, and a new back door to the common basement has been installed. The owner will be responsible for paying all utilities. Seller financing will only be entertained with a much higher purchase price, a significant down payment, and interest. Please allow for 48 hours to schedule showings!
-
2025-10-09historical
-
2025-09-15price $114,900
-
2025-08-25$119,000 Active
-
2024-03-25historical
-
2023-12-12price $105,000
-
2023-12-06historical $800
-
2023-11-18$800
-
2023-11-16$115,000 Active
-
2020-11-24soldstatus $41,300 Closed
-
2020-10-15status Pending
-
2020-06-29$48,000 Active
-
2018-01-17historical
-
2017-07-22$48,000 Active
-
2013-08-12historical
-
2013-02-12$50,000
-
1999-10-25soldstatus $245,500
-
1999-09-17$39,900
-
1999-09-07$39,900
-
1999-08-30historical
-
1999-07-12$30,000
-
1986-03-24soldstatus $10,000
ⓘ Source: listings_history table (triggers on properties + properties_extension) + one-shot
backfill from property_details.listing_events for pre-trigger history.
Tax reassessment forecast OH · Partial reset (capped growth)
- Current annual tax
- $1,157 · $96/mo
- Projected year-2 tax
- $1,242 · $103/mo
- Expected delta
- +$84/yr (+$7/mo · 7.3%)
ⓘ Screening estimate from a state-policy table — verify with the county assessor before closing.
Climate risk First Street
- Flood 1/10 Low FEMA zone X (unshaded) · 0% chance over 30 yrs
- Wildfire 1/10 Low
- Heat 3/10 Moderate 7 d/yr ≥96°F today · 16 d/yr by 30 yrs out
- Wind 1/10 Low
- Air quality 2/10 Low 1 unhealthy d/yr today · 2 by 30 yrs out
Nearby sold comps map
Loading sold comps map…
Walkable amenities ~0.75 mi
Loading nearby amenities…
Taxation est. · year 1
- Rental income
- $21,072
- − Mortgage interest
- −$4,761
- − Property taxes
- −$1,157
- − Insurance
- −$425
- − Repairs & maintenance
- −$1,686
- − Management
- −$1,686
- − Depreciation
- −$2,473
- Taxable income
- $8,884
- Est. tax owed @ 24.0%
- −$2,132
- After-tax cash flow
- $7,583/yr
For passive investors: Depreciation is non-cash, so a rental often shows a tax loss while cash-flowing — sheltering income. Rental losses are passive: they offset passive income freely, and up to $25,000/yr can offset ordinary (W-2) income if you actively participate and your MAGI is under $100k (phasing out to $0 by $150k); unused losses carry forward. On sale, claimed depreciation is recaptured at up to 25%, and gains may owe capital-gains tax (a 1031 exchange can defer both). Figures are a year-1 estimate at your 24.0% rate — not tax advice; consult a CPA.
Schools (NCES district)
- District
- Akron City
- NCES district ID
- 3904348
- Math proficiency
- 22% ▼ -17.00%
- Reading proficiency
- 30% ▼ -12.00%
- Median HH income
- $33,811
- Composite
- 21.31/100
- National rank
- #8383
- State rank
- #602 of 656 in OH
Livability — Akron
- Score
- 81/100
- State rank
- #104
- US rank
- #1591
Category grades
Schools grade is shown separately in the Schools card above.
Census & demographics
- Census place
- Akron, OH
- County
- Summit County · 440,783 people
- City population
- 174,375
- Metro
- Akron, OH
- Population (ZIP)
- 6,653
- Household income
- $27,697
- Rent vs Own
- Severe rent burden
- 787.0
Population outlook (Summit County) Hauer SSP2
- Today (2025)
- 546,583 people
- By 2030
- 544,028 · -0.5%
- By 2040
- 531,363 · -2.8%
- By 2050
- 514,923 · -5.8%
- By 2075
- 481,765 · -11.9%
- By 2100
- 432,265 · -20.9%
Race, ethnicity, and origin ACS 2023
- Neighborhood character
- Predominantly Black (73%)
- Race & ethnicity
- Black 73% White 17% Two or more races 5% Hispanic / Latino 5%
- Common ancestry
- Slovak 1% Romanian 1% Iranian 1%
- Foreign-born
- 2% · Canada
- Languages at home
- 98% English-only · Spanish 2% French/Haitian/Cajun 1%
Political lean MEDSL · Summit
- 2024 margin
- Lean D (+7.0) · D 53.0% · R 46.0%
- 2008→2024 swing
- -9.6pp toward R · 2008: 16.6pp · 2024: 7.0pp
- All cycles
- 2024: D+7.0 2020: D+9.6 2016: D+8.2 2012: D+14.8 2008: D+16.6
Not yet ingested
- Civics
- —
Market trends
- HPI YoY
- ▼ -0.20%
- Current HPI
- 81.3728
- Rent YoY
- —
- Metro
- Akron, OH
- State GDP YoY
- ▲ 1.98%
- F500 in state
- 48
Industry mix (Fortune 500 HQ in OH)
| Industry | F500 HQs | Revenue |
|---|---|---|
| Insurance | 3 | $145B |
|
||
| Industrial Machinery | 3 | $49B |
|
||
| Financial Services | 3 | $24B |
|
||
| Consumer Goods | 2 | $93B |
|
||
| Aerospace / Defense | 2 | $47B |
|
||
| Utilities | 2 | $33B |
|
||
Price history
+750.0% since first listed23 events — show timeline
- 2026-05-01 Price Changed $85,000 MLSNOW
- 2026-02-20 Listed $90,000 MLSNOW
- 2025-10-09 Listing Removed — MLSNOW
- 2025-09-15 Price Changed $114,900 MLSNOW
- 2025-08-25 Listed $119,000 MLSNOW
- 2024-03-25 Listing Removed — MLSNOW
- 2023-12-12 Price Changed $105,000 MLSNOW
- 2023-12-06 Rental Removed $800 YESMLS
- 2023-11-18 Listed for Rent $800 YESMLS
- 2023-11-16 Listed $115,000 MLSNOW
- 2020-11-24 Sold (MLS) $41,300 MLSNOW
- 2020-10-15 Pending — MLSNOW
- 2020-06-29 Listed $48,000 MLSNOW
- 2018-01-17 Listing Removed — MLSNOW
- 2017-07-22 Listed $48,000 MLSNOW
- 2013-08-12 Listing Removed — MLSNOW
- 2013-02-12 Listed $50,000 MLSNOW
- 1999-10-25 Sold (Public Records) $245,500 Public Records
- 1999-09-17 Listed $39,900 MLSNOW
- 1999-09-07 Listed $39,900 MLSNOW
- 1999-08-30 Listing Removed — MLSNOW
- 1999-07-12 Listed $30,000 MLSNOW
- 1986-03-24 Sold (Public Records) $10,000 Public Records
Property tax history
+0.4%/yrLatest (2025): $1,157 · +0.1% YoY. Source: county tax records.
Cash-flow waterfall
monthlySold comps — $/sqft
last 12 mo · ≤1 miLoading sold comps…