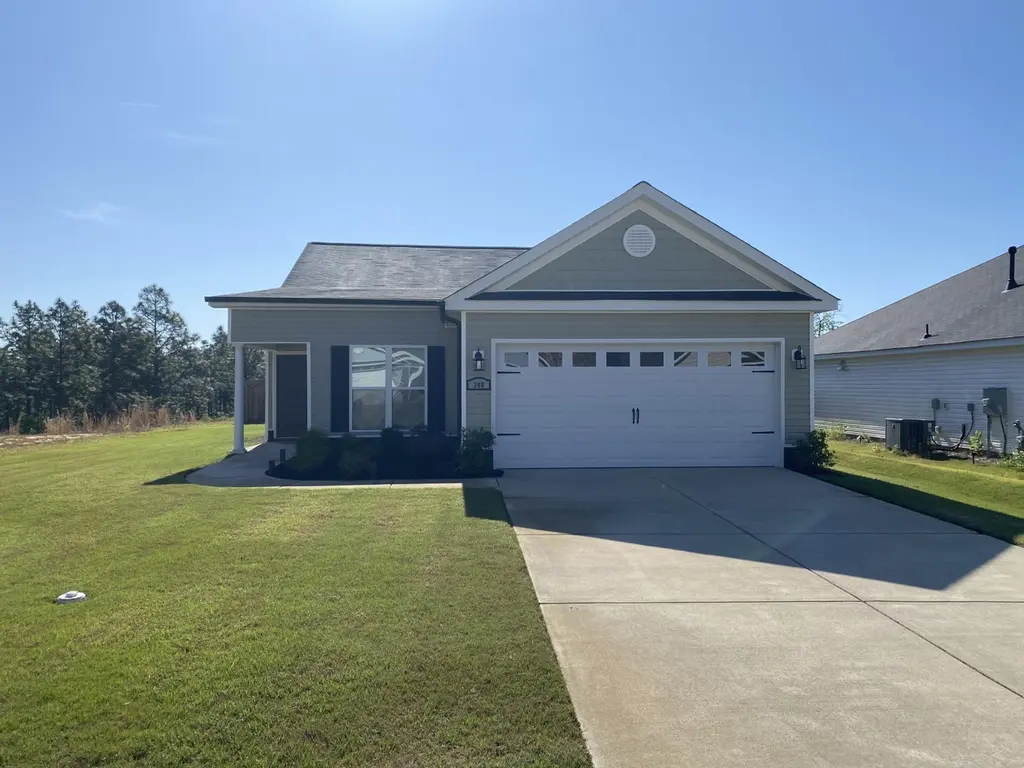
380 Sutton Ct · Burnettown, SC
Flood risk No data
- FEMA flood zone
- —
- Chance of flooding over 30 yrs
- —
- Est. flood insurance / yr
- —
Fire risk No data
- Est. fire insurance / yr
- —
Heat risk No data
- Hot days now (above threshold)
- —
- Hot days in 30 yrs
- —
Wind risk No data
- Chance of severe wind over 30 yrs
- —
Air-quality risk No data
- Unhealthy air days now
- —
- Unhealthy air days in 30 yrs
- —
Risk factors via First Street. Map © Google.
Why this score? — see what drove the C+ grade
The composite is a weighted blend of 9 inputs, each scored 0–100. Each bar is that input's sub-score; the figure is the points it added to the 100-point composite (weight × sub-score).
- Cash flow +20.7/30.0
- ARV discount +11.2/15.0
- Appreciation +9.2/10.0
- DSCR +6.6/10.0
- 1% rule +4.6/10.0
- Schools +3.2/10.0
- Livability +3.2/5.0
- Rent growth +2.5/5.0
- Condition / age +2.5/5.0
$279,888
🖨 Deal sheet 📄 Offer letter ✓ Due diligence
Listing remarks
Another Large Price Adjustment! 25,000 overall! Motivated Seller! MOVE IN READY! Motivated! Great Location! Lived in less than 2 years! Welcome to Greggs Mill and Bill Beazley Homes THORNHILL 4 plan. The front entry hall leads to an open kitchen, dining and great room area. Open kitchen features stylish painted cabinets, granite countertops, a tile backsplash and stainless steel appliances. The island overlooks the dining area and great room. A gas fireplace and ceiling fan are included in the great room along with a door to access the large covered back porch. A hallway next to the kitchen leads to three secondary bedrooms and a laundry room. In a separate area, you will find the pri
Key facts
- Gas fireplace
- Granite counter tops
- Open kitchen
Tags
Property features AI
Finance
- HOA & community: Homeowners association (annual fee $431; approx. $35.92/month); Community pool; Sidewalks and street lights
Exterior
- Parking: Attached garage with 2 spaces; Concrete driveway; Garage door opener
- Security: Smoke detectors; Owned security system
- Utilities: Public water; Public sewer; Cable available
- Home design: Single-family residence; One-level / single-story; Entry level: 1
- Construction: Stone and vinyl siding with frame construction; Slab foundation; Home warranty included
- Exterior features: Covered patio and rear porch; Front porch; Fenced yard; Landscaped yard; Front and rear sprinklers; Composition roof; Has a view
Interior
- Kitchen: Range; Disposal; Dishwasher; Microwave; Tankless water heater
- Bedrooms: Total rooms: 7
- Flooring: Carpet; Other (see remarks)
- Bathrooms: 2 full bathrooms
- Heating & cooling: Central air; Ceiling fan(s); Natural gas heating; Fireplace(s)
- Interior features: Walk-in closets; Kitchen island; Pantry; Eat-in kitchen; Wired for data; Insulated windows
- Laundry & utility: Washer hookup
Neighborhood map
What this means for you Summary
Snapshot
- This is a 4-bed/2.0-bath single-family listed at $280k.
Deal economics
- At list price, monthly cash flow is $378 ($5k/yr) — positive.
- The deal already cash-flows at list — no discount required.
- To meet the 1% rule (rent ≥ 1% of price), the offer needs to be $268k (4.4% below list).
- Recommended offer: $268k (4.4% below list) — sets the bar for 1% rule.
- Cap rate 7.9% vs local median 5.5% in Burnettown — top-decile yield for the area; either an underpriced asset or a hidden risk that comps aren't pricing in. Stress-test before assuming the spread holds.
Location & tenants
- Location reads 64/100 on livability (#159 in SC) — a middle-class / working-renter tenant base. Strengths: crime A+, cost of living A+, housing A+; Watch: amenities F, commute F, employment D-.
- Aiken 01 (suburban): math 31% / reading 44% proficiency, ranked #36 of 80 in SC (top 45%) — families likely to look elsewhere, expect single-tenant / working-renter base with shorter leases.
- Zoned schools: Gloverville Elementary (math 42% / reading 42%, grade F, #256 of 597 statewide, top 45%, 318 students, 100% FRL); Leavelle Mccampbell Middle (math 19% / reading 32%, grade F, #162 of 229 statewide, top 71%, 650 students, 55% FRL); Midland Valley High (math 31% / reading 83%, grade C, #120 of 196 statewide, top 64%, 1,477 students, 62% FRL) — zoned schools average 72% FRL vs 54% district-wide (18 pts higher); higher-poverty schools than district average — tighter screening recommended.
- Market conditions: 299 active listings in the ZIP; 2 comparable units currently listed for rent nearby; solid renter incomes; 2,500 units permitted in Aiken County in 2024 (1,023 in 5+ unit buildings).
- This rent runs 38% of the median local income ($84k/yr) — at the standard rent-burdened threshold; future hikes will face affordability resistance.
Forward outlook
- In year one you build about $25k of equity ($2k loan paydown + $23k appreciation (8.4% local appreciation)).
- Aiken County population projected at +9% by 2050 — modest demand growth; plan on rents tracking national, not racing it.
- At projected returns (8.4% appreciation + 3.0% rent growth), your $78k cash investment doubles in ~3 years — after that, you're playing with house money.
- By year 2, paydown + projected appreciation supports a ~$41k cash-out refi (75% LTV) — recoverable capital for the next deal without selling this one.
Negotiation context
- It's been on market 38 days — a 3% lower offer ($271k) is reasonable based on typical stale-listing flexibility.
- 6 sale attempts since 2y ago; this cycle's ask has dropped $25k (8%) from the opening price — seller is motivated, your offer sets the floor, not the list.
Questions for the listing agent
- It's been on market 38 days. Have you received any prior offers? Is the seller open to a 4% concession, seller financing, or rate buy-down credit?
- What does the HOA fee cover, when was the last increase, and are there any pending special assessments or reserve-fund shortfalls?
- Is there a deadline driving the sale (1031 exchange, divorce, estate, relocation)? That informs how much negotiation room exists.
- Schools are D-rated, which usually means shorter tenancies and higher turnover. Who's the typical renter profile here, and what's been the actual vacancy rate?
- What's the average days-on-market for RENTAL listings here right now (not sales)? A rising rental-DOM trend means longer vacancies and softer asking-rent achievability than the comps imply.
- What's the recent tenant-quality profile in this submarket — average credit score on applications, eviction rate, late-payment / NSF rate, and stable-employment percentage? A property-management company in the area should have these aggregated.
- How much new for-sale + rental construction is in the pipeline within 1–3 miles? Heavy new supply typically softens prices + rents 12–24 months out; constrained supply supports both.
Investment metrics
- 1% rule
- 0.96% ✗
- Cap rate
- 7.91%
- Cash-on-cash
- 5.79%
- DSCR
- 1.26
- GRM
- 8.7
CMA / ARV
- ARV (on-the-fly)
- $305,235
- Comps found
- 12
Show comp detail 12 sales within ~0.75 mi
| Address | Dist | Beds/Ba | Sqft | Sold | Price | $/sf | Match |
|---|---|---|---|---|---|---|---|
| 209 Country Glen Ave | 0.28mi | 3/2.0 (-1) | 1,768 (-1%) | 6mo | $265,000 | $150 | 76 |
| 182 Sutton Ct | 0.21mi | 3/2.0 (-1) | 1,862 (+4%) | 8mo | $300,000 | $161 | 71 |
| 462 Country Glen Ave | 0.52mi | 3/2.0 (-1) | 1,765 (-1%) | 0mo | $277,500 | $157 | 68 |
| 7121 Grayson Dr | 0.37mi | 3/2.0 (-1) | 1,693 (-5%) | 7mo | $289,900 | $171 | 63 |
| 224 Baylor Dr | 0.43mi | 3/2.0 (-1) | 1,672 (-6%) | 2mo | $292,000 | $175 | 63 |
| 235 Baylor Dr | 0.41mi | 3/2.0 (-1) | 1,672 (-6%) | 11mo | $289,000 | $173 | 56 |
| 3145 Camden Way | 0.60mi | 3/2.5 (-1) | 1,880 (+5%) | 2mo | $265,000 | $141 | 54 |
| 651 Broadsword Way | 0.53mi | 3/2.0 (-1) | 1,946 (+9%) | 6mo | $333,534 | $171 | 50 |
| 651 Broadsword Way | 0.53mi | 3/2.0 (-1) | 1,946 (+9%) | 6mo | $333,534 | $171 | 50 |
| 165 Sudlow Lake Rd | 0.63mi | 3/2.0 (-1) | 1,700 (-5%) | 10mo | $286,000 | $168 | 49 |
| 655 Wade Way | 0.47mi | 3/2.0 (-1) | 1,573 (-12%) | 8mo | $271,650 | $173 | 47 |
| 658 Wickham Dr | 0.69mi | 3/2.0 (-1) | 2,046 (+15%) | 7mo | $327,900 | $160 | 32 |
Match score weights: distance 35% · size 25% · config 20% · recency 20%. Top-matched comps best support the ARV.
Projected returns pro-forma
8.38% appreciation · 3.0% rent growth · sell at horizon
- IRR
- 25.2%
- Equity multiple
- 2.86×
- Total profit
- $146,141
- Equity at exit
- $219,916
- IRR
- 22.6%
- Equity multiple
- 6.19×
- Total profit
- $406,381
- Equity at exit
- $443,661
Cash invested: $78,369 (down + closing). Projections, not guarantees.
Landlord ↔ Tenant lean methodology
- Overall (STATE)
- 90 Strongly Landlord-Friendly
- State South Carolina
- 90 Strongly Landlord-Friendly · R+6
- County
- — inherits STATE
- City
- — inherits STATE
ZIP-level market 29829
- Home prices YoY
- 3.0%
- Active inventory
- 299
- Price-to-rent
- 8.7×
Monthly cashflow live
- Estimated rent
- $2,676 medium interval (Pro) →
- Mortgage (P&I)
- −$1,468
- Tax from tax record
- −$115 /mo · $1,386/yr
- Insurance
- −$117
- HOA
- −$36
- Vacancy / Maint / Mgmt
- −$562
- Net cashflow
- $378
Break-even live
UW: 25.0% down · 7.5% · 30yr · 1.5% tax · 5.0% vac · 8.0% maint · 8.0% mgmt
Financing live
Cash to close
- Down payment
- $69,972
- Closing costs
- $8,397
- Reserves months
- —
- Total cash needed
- —
Loan-product check · same deal, 3 products live
Conventional
25% down · 7.5% · 30yr
- Down + closing
- —
- Monthly P&I
- —
- Monthly cashflow
- —
- DSCR
- —
- Eligible?
- —
Personal DTI + credit; lowest rate.
DSCR
20% down · 8.5% · 30yr
- Down + closing
- —
- Monthly P&I
- —
- Monthly cashflow
- —
- DSCR
- —
- Eligible?
- —
No personal income docs; deal must DSCR.
Hard money
10% down · 12.0% · 12mo
- Down + closing
- —
- Monthly P&I
- —
- Monthly cashflow
- —
- DSCR
- —
- Eligible?
- —
Short-term bridge; refi at stabilization.
Rent comps 2 comps
| Address | Beds | Baths | Sqft | Rent | $/sqft | DOM | Units | Dist |
|---|---|---|---|---|---|---|---|---|
| 6279 Whirlaway Rd Graniteville, SC | 3.0 | 2.0 | 1295 | $1,900 | $1.47 | 21d | 1 | 1.36mi |
| 618 Count Fleet Ct Graniteville, SC | 4.0 | 2.5 | 2362 | $2,299 | $0.97 | 21d | 1 | 1.38mi |
HOA detail
- Monthly dues
- $36 · $432/yr
- Likely covers
- gas
Listing history 26 events
-
2026-06-18days on market $279,888 Active 38 DOM
-
2026-06-17days on market $279,888 Active 37 DOM
-
2026-06-16days on market $279,888 Active 36 DOM
-
2026-06-15days on market $279,888 Active 35 DOM
-
2026-06-14days on market $279,888 Active 33 DOM
-
2026-06-13pricedays on market $279,888 Active 32 DOM
-
2026-06-10days on market $284,888 Active 30 DOM
-
2026-06-09days on market $284,888 Active 29 DOM
-
2026-06-08days on market $284,888 Active 28 DOM
-
2026-06-07pricedays on market $284,888 Active 27 DOM
-
2026-06-03days on market $294,888 Active 23 DOM
-
2026-06-02days on market $294,888 Active 22 DOM
-
2026-06-01days on market $294,888 Active 21 DOM
-
2026-05-31days on market $294,888 Active 20 DOM
-
2026-05-30days on market $294,888 Active 19 DOM
-
2026-05-18price $294,888
-
2026-05-11historical
-
2026-04-20$304,888 Active
-
2026-04-20$304,888 Active
-
2024-06-14soldstatus $307,900 Closed
-
2024-05-20status Pending
-
2024-02-22status Active
-
2024-01-05soldstatus $56,500
-
2024-01-03$307,900 Active
-
2024-01-02$307,900
-
2024-01-02$307,900
ⓘ Source: listings_history table (triggers on properties + properties_extension) + one-shot
backfill from property_details.listing_events for pre-trigger history.
Tax reassessment forecast SC · Resets to sale price
- Current annual tax
- $1,386 · $115/mo
- Projected year-2 tax
- $1,595 · $133/mo
- Expected delta
- +$210/yr (+$17/mo · 15.1%)
ⓘ Screening estimate from a state-policy table — verify with the county assessor before closing.
Nearby sold comps map
Loading sold comps map…
Walkable amenities ~0.75 mi
Loading nearby amenities…
Taxation est. · year 1
- Rental income
- $32,111
- − Mortgage interest
- −$15,678
- − Property taxes
- −$1,386
- − Insurance
- −$1,399
- − Repairs & maintenance
- −$2,569
- − Management
- −$2,569
- − HOA
- −$432
- − Depreciation
- −$8,142
- Taxable loss
- −$64
- Est. tax savings @ 24.0%
- +$15
- After-tax cash flow
- $4,553/yr
For passive investors: Depreciation is non-cash, so a rental often shows a tax loss while cash-flowing — sheltering income. Rental losses are passive: they offset passive income freely, and up to $25,000/yr can offset ordinary (W-2) income if you actively participate and your MAGI is under $100k (phasing out to $0 by $150k); unused losses carry forward. On sale, claimed depreciation is recaptured at up to 25%, and gains may owe capital-gains tax (a 1031 exchange can defer both). Figures are a year-1 estimate at your 24.0% rate — not tax advice; consult a CPA.
Schools (NCES district)
- District
- Aiken 01
- NCES district ID
- 4500720
- Math proficiency
- 31% ▼ -11.00%
- Reading proficiency
- 44% ▼ -1.00%
- Median HH income
- $45,081
- Composite
- 31.91/100
- National rank
- #5857
- State rank
- #36 of 80 in SC
Livability — Burnettown
- Score
- 64/100
- State rank
- #159
- US rank
- #14711
Category grades
Schools grade is shown separately in the Schools card above.
Census & demographics
- County
- Aiken County · 116,534 people
- City population
- 931
- Metro
- Augusta-Richmond County, GA-SC
- Population (ZIP)
- 12,385
- Household income
- $84,228
- Rent vs Own
- Severe rent burden
- 213.0
Population outlook (Aiken County) Hauer SSP2
- Today (2025)
- 178,003 people
- By 2030
- 182,876 · +2.7%
- By 2040
- 189,970 · +6.7%
- By 2050
- 193,840 · +8.9%
- By 2075
- 199,453 · +12.1%
- By 2100
- 192,403 · +8.1%
Race, ethnicity, and origin ACS 2023
- Neighborhood character
- Diverse neighborhood (Simpson 0.58)
- Race & ethnicity
- White 59% Black 26% Hispanic / Latino 12% Two or more races 9% Asian 1%
- Hispanic origin (detail)
- Mexican 8% Puerto Rican 1%
- Common ancestry
- Italian 2% Swedish 2% Slovak 1%
- Foreign-born
- 6% · Canada
- Languages at home
- 89% English-only · Spanish 10% Other Indo-European 1%
Political lean MEDSL · Aiken
- 2024 margin
- Strong R (+25.9) · D 36.4% · R 62.2% · Other 1.4%
- 2008→2024 swing
- -1.9pp toward R · 2008: -24.0pp · 2024: -25.9pp
- All cycles
- 2024: R+25.9 2020: R+22.7 2016: R+27.5 2012: R+26.0 2008: R+24.0
Not yet ingested
- Civics
- —
Market trends
- HPI YoY
- ▲ 8.38%
- Current HPI
- 286.4155
- Rent YoY
- —
- Metro
- Augusta-Richmond County, GA-SC
- State GDP YoY
- ▲ 4.51%
- F500 in state
- 2
Industry mix (Fortune 500 HQ in SC)
| Industry | F500 HQs | Revenue |
|---|---|---|
| Packaging | 1 | $7B |
|
||
Price history
-4.2% since first listed11 events — show timeline
- 2026-05-18 Price Changed $294,888 Hive MLS
- 2026-05-11 Listing Removed — Hive MLS
- 2026-04-20 Listed $304,888 Hive MLS
- 2026-04-20 Listed $304,888 Hive MLS
- 2024-06-14 Sold (MLS) $307,900 AMLS
- 2024-05-20 Pending — AMLS
- 2024-02-22 Relisted — AMLS
- 2024-01-05 Sold (Public Records) $56,500 Public Records
- 2024-01-03 Listed $307,900 AMLS
- 2024-01-02 Listed $307,900 Hive MLS
- 2024-01-02 Listed $307,900 Hive MLS
Cash-flow waterfall
monthlySold comps — $/sqft
last 12 mo · ≤1 miLoading sold comps…