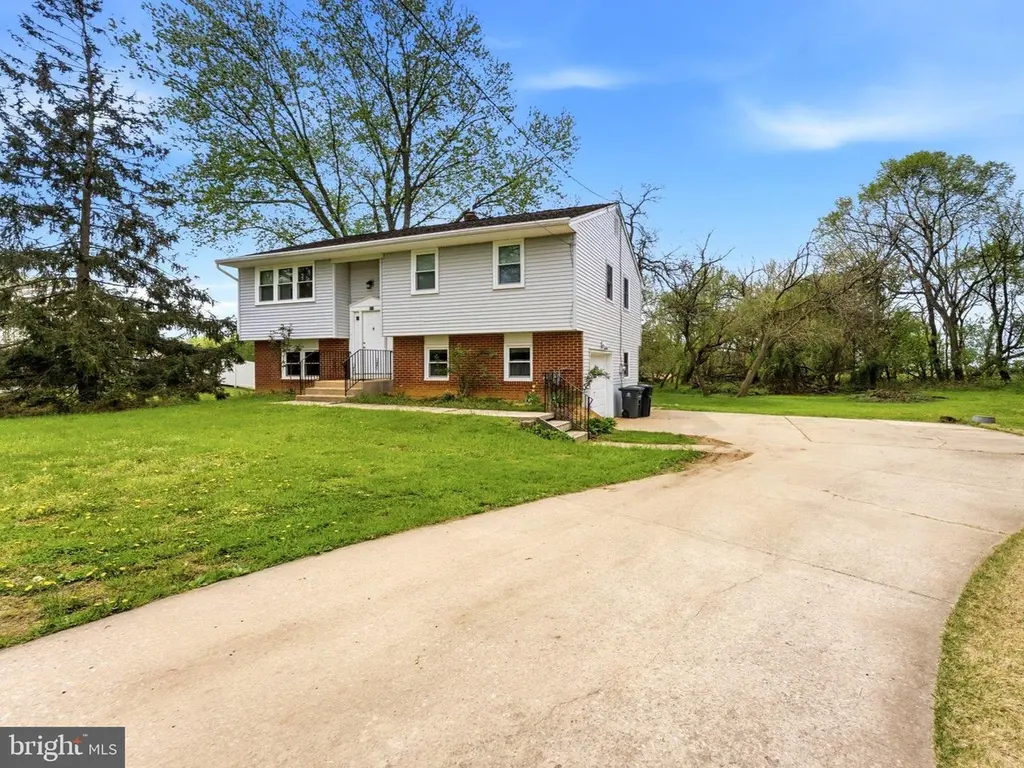
327 Sykesville Rd · Williamstown, NJ
Flood risk 4/10 · Minor
- FEMA flood zone
- X (unshaded)
- Chance of flooding over 30 yrs
- 0.2%
- Est. flood insurance / yr
- $507 – $1,088
Fire risk 3/10 · Minor
- Est. fire insurance / yr
- $526 – $976
Heat risk 6/10 · Moderate
- Hot days now (above 103°F)
- 7 days/yr
- Hot days in 30 yrs
- 15 days/yr
Wind risk 6/10 · Moderate
- Chance of severe wind over 30 yrs
- 66.0%
Air-quality risk 3/10 · Minor
- Unhealthy air days now
- 2 days/yr
- Unhealthy air days in 30 yrs
- 4 days/yr
Risk factors via First Street. Map © Google.
Why this score? — see what drove the D grade
The composite is a weighted blend of 9 inputs, each scored 0–100. Each bar is that input's sub-score; the figure is the points it added to the 100-point composite (weight × sub-score).
- Cash flow +13.0/30.0
- ARV discount +11.3/15.0
- 1% rule +3.9/10.0
- DSCR +3.9/10.0
- Livability +3.5/5.0
- Schools +3.0/10.0
- Rent growth +2.5/5.0
- Condition / age +2.5/5.0
- Appreciation +0.0/10.0
$349,777
🖨 Deal sheet 📄 Offer letter ✓ Due diligence
Listing remarks MLS
Pack Your Bags!Great Area, Near Ballfields, Great Rear Yd, Trane Xl1200super Hi Eff C/A Unit 6 Yrs Young Transferrable Warranty, 4 Yr Old Vinyl Fl In Kit & Din Rm, 4 Yr Old W/ W In Br 2 & 3,Owner Painting T/O New Insul Gar Dr, 1 Yr Wnt Poss:July 21 Has warranty.
Key facts
- Office space
- Open living room
- Relaxing views
Tags
Property features AI
Exterior
- Parking: Attached oversized garage (1 space); Driveway parking
- Utilities: Public water; Public sewer; Electric service
- Home design: Detached property; Shingle roof; Replacement windows
- Construction: Vinyl siding; Built year estimated; Slab foundation
- Exterior features: Not in a federal flood zone; Lot approximately 0.58 acre
Interior
- Bedrooms: 3 bedrooms on the upper level
- Flooring: Carpet; Laminate
- Bathrooms: 1 full bathroom; 1 half bathroom
- Heating & cooling: Forced air heating; Central air conditioning; Electric hot water
- Interior features: Attic/house fan; Ceiling fan(s)
- Laundry & utility: Laundry area present
Neighborhood map
What this means for you Summary
Snapshot
- This is a 3-bed/1.5-bath single-family listed at $350k.
Deal economics
- At list price, monthly cash flow is $-17 ($-209/yr) — negative.
- To cash-flow at today's rent, offer at most $347k (0.9% below list).
- To meet the 1% rule (rent ≥ 1% of price), the offer needs to be $312k (10.9% below list).
- Recommended offer: $312k (10.9% below list) — sets the bar for 1% rule.
- Cap rate 6.2% vs local median 4.9% in Williamstown — meaningfully above typical; check what's discounted (condition, days-on-market, listing class) to confirm the premium yield is real.
Location & tenants
- Location reads 69/100 on livability (#289 in NJ) — a middle-class / working-renter tenant base. Strengths: employment A+, housing A+; Watch: cost of living D+, amenities F, commute F.
- Monroe Township Public School District (suburban): math 20% / reading 45% proficiency, ranked #302 of 472 in NJ (top 64%) — families likely to look elsewhere, expect single-tenant / working-renter base with shorter leases.
- Market conditions: 268 active listings in the ZIP; 5 comparable units currently listed for rent nearby; rentals at typical pace (median 21d on market — plan ~3-4 weeks tenant-placement turnaround); solid renter incomes; 1,047 units permitted in Gloucester County in 2024 (183 in 5+ unit buildings).
- This rent runs 39% of the median local income ($97k/yr) — at the standard rent-burdened threshold; future hikes will face affordability resistance.
Forward outlook
- Local home prices are declining (-3.0%/yr); year-one equity from $2k of loan paydown is wiped out by about $10k of value loss. Plan a longer hold.
- Gloucester County population projected to shrink 5% by 2050 — rents likely to lag national; underwrite the cash flow, not the appreciation.
Negotiation context
- It's been on market 37 days — a 3% lower offer ($339k) is reasonable based on typical stale-listing flexibility.
- 2 sale attempts since 26y ago with the ask held roughly flat each time — persistent listings suggest the price (not the market) is what's stuck; bring a comps-based counter.
- Current owner paid $115k; list at $350k implies a 204% gain — meaningful room to come down on a strong offer.
Risks & watch-outs
- Climate carrying-cost: major wind risk, 66% chance of damaging wind over 30y; extreme-heat days projected 7→15/yr by 2055 (HVAC capex compounding) — expect insurance premiums to compound above CPI over the hold.
Questions for the listing agent
- What do current leases actually rent for vs. the listed asking? Can we see a recent rent roll and the last 12 months of T-12 income?
- It's been on market 37 days. Have you received any prior offers? Is the seller open to a 11% concession, seller financing, or rate buy-down credit?
- Built in 1976 — when were the roof, HVAC, electrical panel, plumbing, and water heater last replaced?
- Is there a deadline driving the sale (1031 exchange, divorce, estate, relocation)? That informs how much negotiation room exists.
- The area grade is low — what's the realistic commute time and amenity access for the typical tenant pool here? Any planned neighborhood developments (good or bad) we should know about?
- What's the average days-on-market for RENTAL listings here right now (not sales)? A rising rental-DOM trend means longer vacancies and softer asking-rent achievability than the comps imply.
- What's the recent tenant-quality profile in this submarket — average credit score on applications, eviction rate, late-payment / NSF rate, and stable-employment percentage? A property-management company in the area should have these aggregated.
- How much new for-sale + rental construction is in the pipeline within 1–3 miles? Heavy new supply typically softens prices + rents 12–24 months out; constrained supply supports both.
Investment metrics
- 1% rule
- 0.89% ✗
- Cap rate
- 6.23%
- Cash-on-cash
- -0.21%
- DSCR
- 0.99
- GRM
- 9.3
CMA / ARV
- ARV (on-the-fly)
- $381,972
- Comps found
- 12
Show comp detail 12 sales within ~0.75 mi
| Address | Dist | Beds/Ba | Sqft | Sold | Price | $/sf | Match |
|---|---|---|---|---|---|---|---|
| 308 Oak St | 0.16mi | 3/2.0 | 1,568 (-6%) | 4mo | $419,000 | $267 | 77 |
| 643 Blue Bell Rd | 0.32mi | 3/2.0 | 1,570 (-6%) | 5mo | $364,900 | $232 | 69 |
| 221 Oak St | 0.20mi | 3/1.0 | 1,440 (-14%) | 3mo | $255,000 | $177 | 63 |
| 30 Tool Ln | 0.20mi | 4/2.5 (+1) | 1,844 (+11%) | 4mo | $345,000 | $187 | 61 |
| 229 Ireland Ter | 0.71mi | 3/2.5 | 1,638 (-2%) | 2mo | $385,000 | $235 | 59 |
| 110 Washington Ave | 0.57mi | 4/2.0 (+1) | 1,559 (-6%) | 1mo | $370,000 | $237 | 55 |
| 432 Madison Ave | 0.56mi | 3/1.5 | 1,464 (-12%) | 1mo | $290,000 | $198 | 52 |
| 921 N Beecham Rd | 0.63mi | 3/2.5 | 1,800 (+8%) | 3mo | $430,000 | $239 | 51 |
| 38 Walnut St | 0.60mi | 3/2.5 | 1,806 (+8%) | 4mo | $360,000 | $199 | 51 |
| 53 Linwood Ave | 0.51mi | 4/2.5 (+1) | 1,832 (+10%) | 1mo | $420,000 | $229 | 50 |
| 109 Poplar St | 0.55mi | 4/2.0 (+1) | 1,496 (-10%) | 4mo | $330,000 | $221 | 47 |
| 255 Washington Ave | 0.70mi | 4/2.5 (+1) | 1,800 (+8%) | 2mo | $410,000 | $228 | 44 |
Match score weights: distance 35% · size 25% · config 20% · recency 20%. Top-matched comps best support the ARV.
Projected returns pro-forma
-3.0% appreciation · 3.0% rent growth · sell at horizon
- IRR
- -16.6%
- Equity multiple
- 0.41×
- Total profit
- $-57,702
- Equity at exit
- $52,153
- IRR
- -8.4%
- Equity multiple
- 0.48×
- Total profit
- $-51,325
- Equity at exit
- $30,242
Cash invested: $97,938 (down + closing). Projections, not guarantees.
Landlord ↔ Tenant lean methodology
- Overall (STATE)
- 21 Tenant-Leaning
- State New Jersey
- 21 Tenant-Leaning · D+6
- County
- — inherits STATE
- City
- — inherits STATE
ZIP-level market 08094
- Active inventory
- 268
- Price-to-rent
- 9.3×
Monthly cashflow live
- Estimated rent
- $3,118 high interval (Pro) →
- Mortgage (P&I)
- −$1,834
- Tax from tax record
- −$500 /mo · $6,004/yr
- Insurance
- −$146
- HOA
- −$0
- Vacancy / Maint / Mgmt
- −$655
- Net cashflow
- $-17
Break-even live
UW: 25.0% down · 7.5% · 30yr · 1.5% tax · 5.0% vac · 8.0% maint · 8.0% mgmt
Financing live
Cash to close
- Down payment
- $87,444
- Closing costs
- $10,493
- Reserves months
- —
- Total cash needed
- —
Loan-product check · same deal, 3 products live
Conventional
25% down · 7.5% · 30yr
- Down + closing
- —
- Monthly P&I
- —
- Monthly cashflow
- —
- DSCR
- —
- Eligible?
- —
Personal DTI + credit; lowest rate.
DSCR
20% down · 8.5% · 30yr
- Down + closing
- —
- Monthly P&I
- —
- Monthly cashflow
- —
- DSCR
- —
- Eligible?
- —
No personal income docs; deal must DSCR.
Hard money
10% down · 12.0% · 12mo
- Down + closing
- —
- Monthly P&I
- —
- Monthly cashflow
- —
- DSCR
- —
- Eligible?
- —
Short-term bridge; refi at stabilization.
Rent comps 5 comps
| Address | Beds | Baths | Sqft | Rent | $/sqft | DOM | Units | Dist |
|---|---|---|---|---|---|---|---|---|
| 62 Washington Ave Williamstown, NJ | 3.0 | 1.5 | 1434 | $2,600 | $1.81 | 7d | 1 | 0.54mi |
| 913 Hampton Way Williamstown, NJ | 4.0 | 2.0 | 2012 | $2,750 | $1.37 | 1d | 1 | 0.60mi |
| 385 N Tuckahoe Rd Unit 969 Williamstown, NJ | 3.0 | 2.5 | 1500 | $2,999 | $2.00 | 24d | 1 | 1.22mi |
| 945 Woodview Ct Williamstown, NJ | 3.0 | 2.5 | 1500 | $2,999 | $2.00 | 22d | 1 | 1.25mi |
| 969 Woodview Ct Williamstown, NJ | 3.0 | 2.5 | 1500 | $2,999 | $2.00 | 20d | 1 | 1.27mi |
Listing history 6 events
-
2026-05-20price $349,777
-
2026-04-17$359,777 Active
-
2000-12-12soldstatus $115,000
-
2000-12-08soldstatus $115,000 271-char remark
Show marketing remark (271 chars)
Pack Your Bags!Great Area, Near Ballfields, Great Rear Yd, Trane Xl1200super Hi Eff C/A Unit 6 Yrs Young Transferrable Warranty, 4 Yr Old Vinyl Fl In Kit & Din Rm, 4 Yr Old W/ W In Br 2 & 3,Owner Painting T/O New Insul Gar Dr, 1 Yr Wnt Poss:July 21 Has warranty.
-
2000-10-09historical 271-char remark
Show marketing remark (271 chars)
Pack Your Bags!Great Area, Near Ballfields, Great Rear Yd, Trane Xl1200super Hi Eff C/A Unit 6 Yrs Young Transferrable Warranty, 4 Yr Old Vinyl Fl In Kit & Din Rm, 4 Yr Old W/ W In Br 2 & 3,Owner Painting T/O New Insul Gar Dr, 1 Yr Wnt Poss:July 21 Has warranty.
-
2000-06-19$115,000 271-char remark
Show marketing remark (271 chars)
Pack Your Bags!Great Area, Near Ballfields, Great Rear Yd, Trane Xl1200super Hi Eff C/A Unit 6 Yrs Young Transferrable Warranty, 4 Yr Old Vinyl Fl In Kit & Din Rm, 4 Yr Old W/ W In Br 2 & 3,Owner Painting T/O New Insul Gar Dr, 1 Yr Wnt Poss:July 21 Has warranty.
ⓘ Source: listings_history table (triggers on properties + properties_extension) + one-shot
backfill from property_details.listing_events for pre-trigger history.
Tax reassessment forecast NJ · Partial reset (capped growth)
- Current annual tax
- $6,004 · $500/mo
- Projected year-2 tax
- $7,357 · $613/mo
- Expected delta
- +$1,353/yr (+$113/mo · 22.5%)
ⓘ Screening estimate from a state-policy table — verify with the county assessor before closing.
Climate risk First Street
- Flood 4/10 Moderate FEMA zone X (unshaded) · 20% chance over 30 yrs
- Wildfire 3/10 Moderate
- Heat 6/10 Major 7 d/yr ≥103°F today · 15 d/yr by 30 yrs out
- Wind 6/10 Major 66% chance of damaging wind over 30 yrs
- Air quality 3/10 Moderate 2 unhealthy d/yr today · 4 by 30 yrs out
Nearby sold comps map
Loading sold comps map…
Walkable amenities ~0.75 mi
Loading nearby amenities…
Taxation est. · year 1
- Rental income
- $37,412
- − Mortgage interest
- −$19,593
- − Property taxes
- −$6,004
- − Insurance
- −$1,749
- − Repairs & maintenance
- −$2,993
- − Management
- −$2,993
- − Depreciation
- −$10,175
- Taxable loss
- −$6,095
- Est. tax savings @ 24.0%
- +$1,463
- After-tax cash flow
- $1,254/yr
For passive investors: Depreciation is non-cash, so a rental often shows a tax loss while cash-flowing — sheltering income. Rental losses are passive: they offset passive income freely, and up to $25,000/yr can offset ordinary (W-2) income if you actively participate and your MAGI is under $100k (phasing out to $0 by $150k); unused losses carry forward. On sale, claimed depreciation is recaptured at up to 25%, and gains may owe capital-gains tax (a 1031 exchange can defer both). Figures are a year-1 estimate at your 24.0% rate — not tax advice; consult a CPA.
Schools (NCES district)
- District
- Monroe Township Public School District
- NCES district ID
- 3410470
- Math proficiency
- 20% ▼ -24.00%
- Reading proficiency
- 45% ▼ -9.00%
- Median HH income
- $71,557
- Composite
- 30.24/100
- National rank
- #6295
- State rank
- #302 of 472 in NJ
Livability — Williamstown
- Score
- 69/100
- State rank
- #289
- US rank
- #8603
Category grades
Schools grade is shown separately in the Schools card above.
Census & demographics
- Census place
- Williamstown, NJ
- County
- Gloucester County · 160,422 people
- City population
- 41,595
- Metro
- Philadelphia-Camden-Wilmington, PA-NJ-DE-MD
- Population (ZIP)
- 41,595
- Household income
- $96,699
- Rent vs Own
- Severe rent burden
- 721.0
Population outlook (Gloucester County) Hauer SSP2
- Today (2025)
- 298,895 people
- By 2030
- 299,031 · +0.0%
- By 2040
- 294,020 · -1.6%
- By 2050
- 284,188 · -4.9%
- By 2075
- 260,720 · -12.8%
- By 2100
- 229,565 · -23.2%
Race, ethnicity, and origin ACS 2023
- Neighborhood character
- Predominantly White (73%)
- Race & ethnicity
- White 73% Hispanic / Latino 11% Black 10% Two or more races 8% Asian 1%
- Hispanic origin (detail)
- Puerto Rican 6% Dominican 1%
- Common ancestry
- Romanian 6% Slovak 2% Lithuanian 1%
- Foreign-born
- 4% · Canada
- Languages at home
- 92% English-only · Spanish 5% Russian/Polish/Slavic 1%
Political lean MEDSL · Gloucester
- 2024 margin
- Toss-up / Even · D 47.8% · R 50.6% · Other 1.6%
- 2008→2024 swing
- -15.0pp toward R · 2008: 12.2pp · 2024: -2.8pp
- All cycles
- 2024: R+2.8 2020: D+1.9 2016: R+0.4 2012: D+10.5 2008: D+12.2
Not yet ingested
- Civics
- —
Market trends
- HPI YoY
- ▼ -213.12%
- Current HPI
- 278.3849
- Rent YoY
- —
- Metro
- Philadelphia-Camden-Wilmington, PA-NJ-DE-MD
- State GDP YoY
- ▲ 2.05%
- F500 in state
- 34
Industry mix (Fortune 500 HQ in NJ)
| Industry | F500 HQs | Revenue |
|---|---|---|
| Consumer Goods | 3 | $31B |
|
||
| Pharmaceuticals | 2 | $153B |
|
||
| Technology | 2 | $21B |
|
||
| Insurance | 2 | $20B |
|
||
| Healthcare | 2 | $19B |
|
||
| Financial Services | 1 | $70B |
|
||
Price history
+204.2% since first listed6 events — show timeline
- 2026-05-20 Price Changed $349,777 BRIGHT MLS
- 2026-04-17 Listed $359,777 BRIGHT MLS
- 2000-12-12 Sold (Public Records) $115,000 Public Records
- 2000-12-08 Sold (MLS) $115,000 BRIGHT MLS
- 2000-10-09 Listing Removed — BRIGHT MLS
- 2000-06-19 Listed $115,000 BRIGHT MLS
Property tax history
+1.5%/yrLatest (2025): $6,004 · +2.9% YoY. Source: county tax records.
Cash-flow waterfall
monthlySold comps — $/sqft
last 12 mo · ≤1 miLoading sold comps…