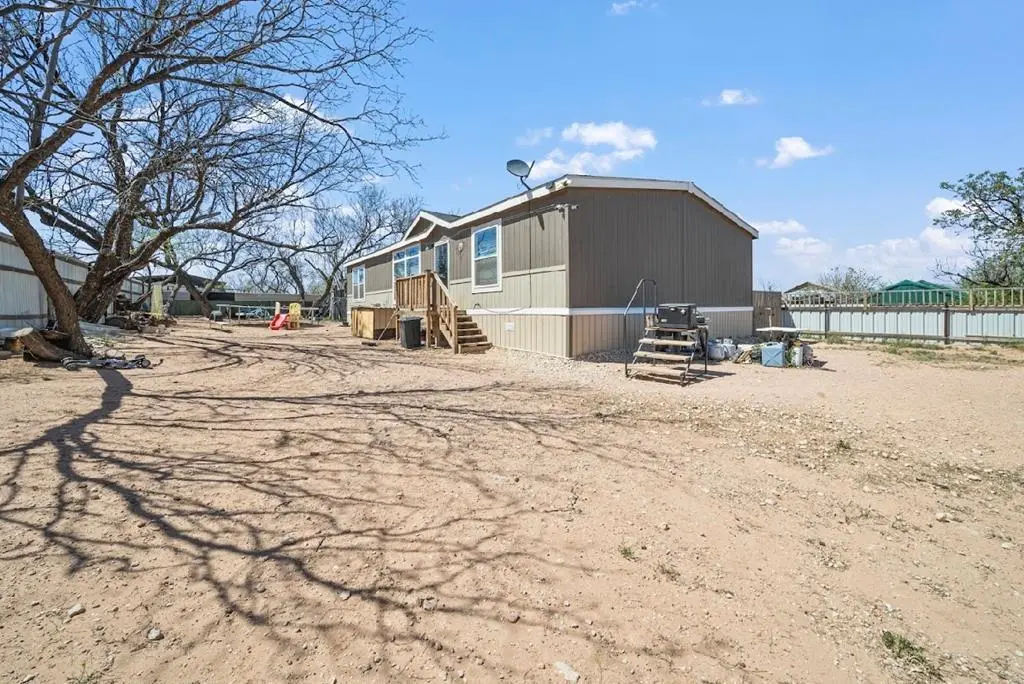
606 San Jacinto St · Big Spring, TX
Flood risk 1/10 · Minimal
- FEMA flood zone
- X (unshaded)
- Chance of flooding over 30 yrs
- 0.0%
- Est. flood insurance / yr
- $507 – $1,088
Fire risk 9/10 · Severe
- Est. fire insurance / yr
- $1,222 – $2,270
Heat risk 6/10 · Moderate
- Hot days now (above 102°F)
- 7 days/yr
- Hot days in 30 yrs
- 23 days/yr
Wind risk 2/10 · Minimal
- Chance of severe wind over 30 yrs
- 4.0%
Air-quality risk 1/10 · Minimal
- Unhealthy air days now
- 0 days/yr
- Unhealthy air days in 30 yrs
- 0 days/yr
Risk factors via First Street. Map © Google.
Why this score? — see what drove the C- grade
The composite is a weighted blend of 9 inputs, each scored 0–100. Each bar is that input's sub-score; the figure is the points it added to the 100-point composite (weight × sub-score).
- Cash flow +21.0/30.0
- ARV discount +7.5/15.0
- DSCR +6.7/10.0
- 1% rule +5.8/10.0
- Livability +3.1/5.0
- Condition / age +2.8/5.0
- Rent growth +2.5/5.0
- Schools +2.5/10.0
- Appreciation +0.0/10.0
$149,000
🖨 Deal sheet (PDF) 📄 Offer letter ✓ Due diligence
Listing remarks MLS
Discover modern comfort in this 2019-built 3-bedroom, 2-bathroom double mobile home in Big Spring, Texas! Featuring 1,792 sq. ft. of open-concept living space on a 0.161-acre lot, this all-electric home is designed for convenience and style. Property includes a utility room, ceiling fans throughout, and a fenced yard. Please note, mineral rights are reserved. Don't wait—schedule your showing today and make this your next home!
Key facts
- Utility room
- Fenced yard
- 7,013 sq ft lot
Tags
Neighborhood map
What this means for you Summary
Snapshot
- This is a 3-bed/2.0-bath manufactured listed at $149k. Condition is rated average.
Deal economics
- At list price, monthly cash flow is $211 ($3k/yr) — positive.
- The deal already cash-flows at list — no discount required.
- Meets the 1% rule at list price ($2k rent vs $149k).
- Recommended offer: $131k (12.0% below list) — sets the bar for market timing.
Location & tenants
- Location reads 62/100 on livability (#948 in TX) — a middle-class / working-renter tenant base. Strengths: cost of living A+, housing A+, health & safety A+; Watch: employment C-, schools F, crime F.
- Big Spring ISD (town): math 29% / reading 30% proficiency, ranked #641 of 826 in TX (top 78%) — low school quality limits family demand, transient renter base, plan for 1-2y turnover; 63% free/reduced lunch — lower-income household profile, screen leases tightly.
- Market conditions: 266 active listings in the ZIP; 1 comparable units currently listed for rent nearby; 69 units permitted in Howard County in 2024 (5 in 5+ unit buildings).
Forward outlook
- Local home prices are declining (-3.0%/yr); year-one equity from $1k of loan paydown is wiped out by about $4k of value loss. Plan a longer hold.
- Howard County population projected at +42% by 2050 — long-run rental-demand tailwind backs the buy-and-hold thesis.
Negotiation context
- It's been on market 352 days — a 12% lower offer ($131k) is reasonable based on typical stale-listing flexibility.
Risks & watch-outs
- Climate carrying-cost: severe wildfire risk; extreme-heat days projected 7→23/yr by 2055 (HVAC capex compounding) — expect insurance premiums to compound above CPI over the hold.
Questions for the listing agent
- It's been on market 352 days. Have you received any prior offers? Is the seller open to a 12% concession, seller financing, or rate buy-down credit?
- Why hasn't it sold? Are there any deal-killer items the seller is aware of (foundation, flood, title, zoning, code violations)?
- Is there a deadline driving the sale (1031 exchange, divorce, estate, relocation)? That informs how much negotiation room exists.
- Schools are F-rated, which usually means shorter tenancies and higher turnover. Who's the typical renter profile here, and what's been the actual vacancy rate?
- Crime grade is F in this area — have there been break-ins, vandalism, or insurance claims at this property in the last 3 years? What carrier currently insures it and at what premium?
- What's the average days-on-market for RENTAL listings here right now (not sales)? A rising rental-DOM trend means longer vacancies and softer asking-rent achievability than the comps imply.
- What's the recent tenant-quality profile in this submarket — average credit score on applications, eviction rate, late-payment / NSF rate, and stable-employment percentage? A property-management company in the area should have these aggregated.
- How much new for-sale + rental construction is in the pipeline within 1–3 miles? Heavy new supply typically softens prices + rents 12–24 months out; constrained supply supports both.
Investment metrics
- 1% rule
- 1.08% ✓
- Cap rate
- 7.99%
- Cash-on-cash
- 6.06%
- DSCR
- 1.27
- GRM
- 7.7
CMA / ARV
No comps found within radius.
Projected returns pro-forma
-3.0% appreciation · 3.0% rent growth · sell at horizon
- IRR
- -6.9%
- Equity multiple
- 0.74×
- Total profit
- $-10,695
- Equity at exit
- $22,216
- IRR
- 2.7%
- Equity multiple
- 1.19×
- Total profit
- $8,116
- Equity at exit
- $12,883
Cash invested: $41,720 (down + closing). Projections, not guarantees.
Landlord ↔ Tenant lean methodology
- Overall (STATE)
- 87 Strongly Landlord-Friendly
- State Texas
- 87 Strongly Landlord-Friendly · R+5
- County
- — inherits STATE
- City
- — inherits STATE
ZIP-level market 79720
- Active inventory
- 266
- Price-to-rent
- 7.7×
Monthly cashflow live
- Estimated rent
- $1,603 medium interval (Pro) →
- Mortgage (P&I)
- −$781
- Tax from tax record
- −$212 /mo · $2,546/yr
- Insurance
- −$62
- HOA
- −$0
- Vacancy / Maint / Mgmt
- −$337
- Net cashflow
- $211
Break-even live
Sensitivity live
| Price | -10% $295 | -5% $253 | +0% $211 | +5% $168 | +10% $126 |
|---|---|---|---|---|---|
| Rent | -10% $84 | -5% $147 | +0% $211 | +5% $274 | +10% $337 |
| Rate | -1.0pp $286 | -0.5pp $248 | base $211 | +0.5pp $172 | +1.0pp $133 |
UW: 25.0% down · 7.5% · 30yr · 1.5% tax · 5.0% vac · 8.0% maint · 8.0% mgmt
Financing live
Cash to close
- Down payment
- $37,250
- Closing costs
- $4,470
- Reserves months
- —
- Total cash needed
- —
Loan-product check · same deal, 3 products live
Conventional
25% down · 7.5% · 30yr
- Down + closing
- —
- Monthly P&I
- —
- Monthly cashflow
- —
- DSCR
- —
- Eligible?
- —
Personal DTI + credit; lowest rate.
DSCR
20% down · 8.5% · 30yr
- Down + closing
- —
- Monthly P&I
- —
- Monthly cashflow
- —
- DSCR
- —
- Eligible?
- —
No personal income docs; deal must DSCR.
Hard money
10% down · 12.0% · 12mo
- Down + closing
- —
- Monthly P&I
- —
- Monthly cashflow
- —
- DSCR
- —
- Eligible?
- —
Short-term bridge; refi at stabilization.
Rent comps 1 comps
| Address | Beds | Baths | Sqft | Rent | $/sqft | DOM | Units | Dist |
|---|---|---|---|---|---|---|---|---|
| 801 W Marcy Dr Big Spring, TX | 2.0 | 2.0 | 1276 | $1,166 | $0.91 | 13d | 1 | 1.31mi |
Listing history 5 events
-
2026-04-24price $149,000 436-char remark
Show marketing remark (436 chars)
Discover modern comfort in this 2019-built 3-bedroom, 2-bathroom double mobile home in Big Spring, Texas! Featuring 1,792 sq. ft. of open-concept living space on a 0.161-acre lot, this all-electric home is designed for convenience and style. Property includes a utility room, ceiling fans throughout, and a fenced yard. Please note, mineral rights are reserved. Don't wait—schedule your showing today and make this your next home!
-
2025-11-13price $165,000 436-char remark
Show marketing remark (436 chars)
Discover modern comfort in this 2019-built 3-bedroom, 2-bathroom double mobile home in Big Spring, Texas! Featuring 1,792 sq. ft. of open-concept living space on a 0.161-acre lot, this all-electric home is designed for convenience and style. Property includes a utility room, ceiling fans throughout, and a fenced yard. Please note, mineral rights are reserved. Don't wait—schedule your showing today and make this your next home!
-
2025-06-09$174,000 Active 436-char remark
Show marketing remark (436 chars)
Discover modern comfort in this 2019-built 3-bedroom, 2-bathroom double mobile home in Big Spring, Texas! Featuring 1,792 sq. ft. of open-concept living space on a 0.161-acre lot, this all-electric home is designed for convenience and style. Property includes a utility room, ceiling fans throughout, and a fenced yard. Please note, mineral rights are reserved. Don't wait—schedule your showing today and make this your next home!
-
2024-07-17price $165,000
-
2024-04-16price $172,000
ⓘ Source: listings_history table (triggers on properties + properties_extension) + one-shot
backfill from property_details.listing_events for pre-trigger history.
Tax reassessment forecast TX · Resets to sale price
- Current annual tax
- $2,546 · $212/mo
- Projected year-2 tax
- $2,727 · $227/mo
- Expected delta
- +$180/yr (+$15/mo · 7.1%)
ⓘ Screening estimate from a state-policy table — verify with the county assessor before closing.
Climate risk First Street
- Flood 1/10 Low FEMA zone X (unshaded) · 0% chance over 30 yrs
- Wildfire 9/10 Extreme
- Heat 6/10 Major 7 d/yr ≥102°F today · 23 d/yr by 30 yrs out
- Wind 2/10 Low 4% chance of damaging wind over 30 yrs
- Air quality 1/10 Low 0 unhealthy d/yr today · 0 by 30 yrs out
Nearby sold comps map
Loading sold comps map…
Walkable amenities ~0.75 mi
Loading nearby amenities…
Taxation est. · year 1
- Rental income
- $19,233
- − Mortgage interest
- −$8,346
- − Property taxes
- −$2,546
- − Insurance
- −$745
- − Repairs & maintenance
- −$1,539
- − Management
- −$1,539
- − Depreciation
- −$4,335
- Taxable income
- $184
- Est. tax owed @ 24.0%
- −$44
- After-tax cash flow
- $2,482/yr
For passive investors: Depreciation is non-cash, so a rental often shows a tax loss while cash-flowing — sheltering income. Rental losses are passive: they offset passive income freely, and up to $25,000/yr can offset ordinary (W-2) income if you actively participate and your MAGI is under $100k (phasing out to $0 by $150k); unused losses carry forward. On sale, claimed depreciation is recaptured at up to 25%, and gains may owe capital-gains tax (a 1031 exchange can defer both). Figures are a year-1 estimate at your 24.0% rate — not tax advice; consult a CPA.
Condition & rehab AI · 12 photos
This 2019-built mobile home in Big Spring, Texas, offers a good starting point for a cosmetic renovation. With minor repairs and updates, it can significantly increase its resale and rental value.
Repairs flagged
- Minor Kitchen cabinets — Worn appearance
- Minor Bathroom fixtures — Dated appearance
- Minor Exterior siding — Weathered appearance
- Minor Hardwood floors — Signs of wear
- Minor Paint — Faded appearance
- Minor Windows — Not new
Value-add opportunities
- Both Painting and updating kitchen cabinets — Enhances curb appeal and interior aesthetics
- Both Landscaping and yard maintenance — Improves curb appeal and enhances property value
- Both New flooring — Enhances interior aesthetics and increases value
- Both New windows — Improves energy efficiency and enhances curb appeal
Renovation cost estimate screening
| Repair item | Severity | Est. cost |
|---|---|---|
| Kitchen cabinets · Worn appearance | Minor | $500–3,000 |
| Bathroom fixtures · Dated appearance | Minor | $500–3,000 |
| Exterior siding · Weathered appearance | Minor | $500–3,000 |
| Hardwood floors · Signs of wear | Minor | $500–3,000 |
| Paint · Faded appearance | Minor | $500–3,000 |
| Windows · Not new | Minor | $500–3,000 |
| Total estimated repair cost · 6 items | $3,000–18,000 |
Value-add ROI direction
- Both Painting and updating kitchen cabinets — Enhances curb appeal and interior aesthetics ↑
- Both Landscaping and yard maintenance — Improves curb appeal and enhances property value ↑
- Both New flooring — Enhances interior aesthetics and increases value ↑
- Both New windows — Improves energy efficiency and enhances curb appeal ↑
ⓘ Cost ranges are severity-bucket heuristics (US national rule-of-thumb). Get contractor quotes + a written scope before underwriting a rehab budget.
Schools (NCES district)
- District
- Big Spring ISD
- NCES district ID
- 4810200
- Math proficiency
- 29% ▼ -1.00%
- Reading proficiency
- 30% ▲ 4.00%
- Median HH income
- $42,916
- Composite
- 25.11/100
- National rank
- #7529
- State rank
- #641 of 826 in TX
Livability — Big Spring
- Score
- 62/100
- State rank
- #948
- US rank
- #16886
Category grades
Schools grade is shown separately in the Schools card above.
Census & demographics
- Census place
- Big Spring, TX
- County
- Howard County · 29,936 people
- City population
- 29,936
- Metro
- Big Spring, TX
- Population (ZIP)
- 29,936
- Household income
- $68,785
- Rent vs Own
- Severe rent burden
- 638.0
Population outlook (Howard County) Hauer SSP2
- Today (2025)
- 43,396 people
- By 2030
- 46,792 · +7.8%
- By 2040
- 54,096 · +24.7%
- By 2050
- 61,707 · +42.2%
- By 2075
- 79,809 · +83.9%
- By 2100
- 87,385 · +101.4%
Race, ethnicity, and origin ACS 2023
- Neighborhood character
- Diverse neighborhood (Simpson 0.59)
- Race & ethnicity
- Hispanic / Latino 45% White 45% Two or more races 17% Black 5% Asian 1%
- Hispanic origin (detail)
- Mexican 37%
- Common ancestry
- Slovak 1% Italian 1% Lithuanian 1%
- Foreign-born
- 10% · Canada
- Languages at home
- 71% English-only · Spanish 28%
Political lean MEDSL · Howard
- 2024 margin
- Solid R (+62.8) · D 18.2% · R 81.1%
- 2008→2024 swing
- -16.6pp toward R · 2008: -46.3pp · 2024: -62.8pp
- All cycles
- 2024: R+62.8 2020: R+58.4 2016: R+56.0 2012: R+58.2 2008: R+46.3
Not yet ingested
- Civics
- —
Market trends
- HPI YoY
- ▼ -207.13%
- Current HPI
- 140.8159
- Rent YoY
- —
- Metro
- Big Spring, TX
- State GDP YoY
- ▲ 3.95%
- F500 in state
- 110
Industry mix (Fortune 500 HQ in TX)
| Industry | F500 HQs | Revenue |
|---|---|---|
| Energy | 16 | $1,198B |
|
||
| Technology | 5 | $198B |
|
||
| Engineering / Construction | 4 | $72B |
|
||
| Energy Services | 3 | $60B |
|
||
| Utilities | 3 | $41B |
|
||
| Healthcare | 2 | $330B |
|
||
Price history
-13.4% since first listed5 events — show timeline
- 2026-04-24 Price Changed $149,000 PBBOR
- 2025-11-13 Price Changed $165,000 PBBOR
- 2025-06-09 Listed $174,000 PBBOR
- 2024-07-17 Price Changed $165,000 PBBOR
- 2024-04-16 Price Changed $172,000 PBBOR
Property tax history
+1.6%/yrLatest (2025): $2,546 · +15.2% YoY. Source: county tax records.
Cash-flow waterfall
monthlySold comps — $/sqft
last 12 mo · ≤1 miLoading sold comps…