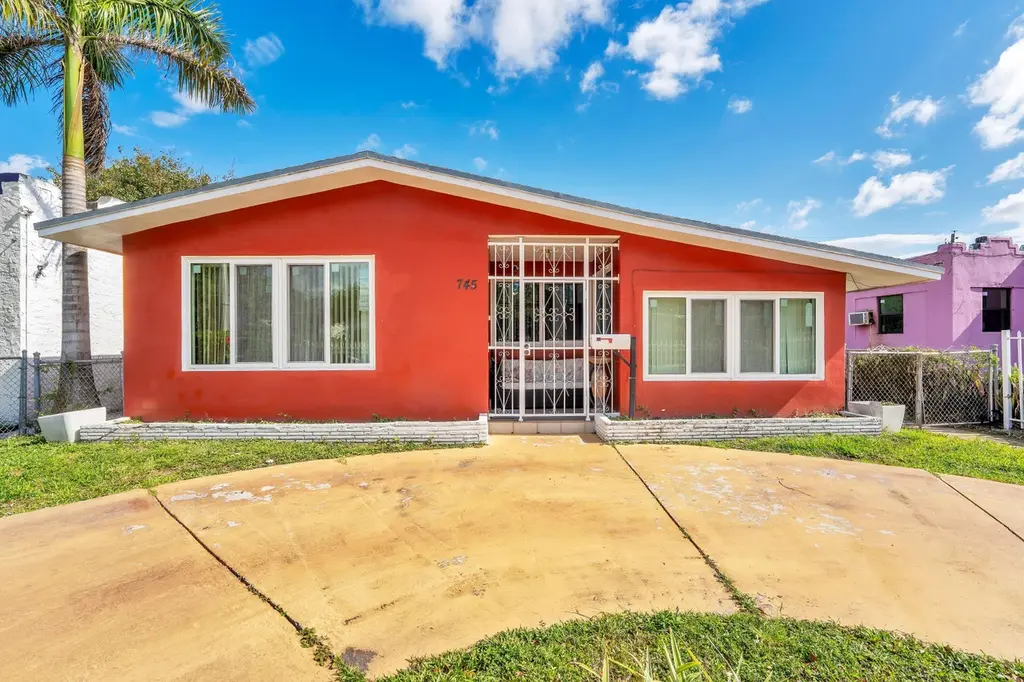
745 NW 46th St · Miami, FL
Flood risk 1/10 · Minimal
- FEMA flood zone
- X (unshaded)
- Chance of flooding over 30 yrs
- 0.0%
- Est. flood insurance / yr
- $507 – $1,088
Fire risk 1/10 · Minimal
- Est. fire insurance / yr
- $947 – $1,759
Heat risk 10/10 · Severe
- Hot days now (above 103°F)
- 7 days/yr
- Hot days in 30 yrs
- 29 days/yr
Wind risk 10/10 · Severe
- Chance of severe wind over 30 yrs
- 99.0%
Air-quality risk 2/10 · Minimal
- Unhealthy air days now
- 1 days/yr
- Unhealthy air days in 30 yrs
- 1 days/yr
Risk factors via First Street. Map © Google.
Why this score? — see what drove the D+ grade
The composite is a weighted blend of 9 inputs, each scored 0–100. Each bar is that input's sub-score; the figure is the points it added to the 100-point composite (weight × sub-score).
- ARV discount +15.0/15.0
- Cash flow +13.4/30.0
- Schools +4.2/10.0
- DSCR +4.0/10.0
- Livability +3.9/5.0
- Rent growth +3.1/5.0
- Condition / age +2.5/5.0
- 1% rule +2.4/10.0
- Appreciation +0.0/10.0
$439,000
🖨 Deal sheet 📄 Offer letter ✓ Due diligence
Key facts
- 5,000 sq ft lot
- 2 parking spots
- Built 1962
Property features AI
Finance
- Other: Pets allowed with no restrictions
Exterior
- Parking: 2 parking spaces; Asphalt driveway; On-street parking
- Utilities: Public water; Public sewer; Cable available; Sewer connected
- Home design: Single family residence; One story; Resale property; Faces south
- Construction: Built with brick, concrete, stucco, and CBS; One-story structure
- Exterior features: Shingle roof; Outbuilding/shed for storage; Fenced front and back yard with gate
Interior
- Kitchen: Electric range; Microwave; Refrigerator; Gas water heater; Water heater (owned)
- Bedrooms: 3 bedrooms on the main level
- Flooring: Tile flooring
- Bathrooms: 2 full bathrooms on the main level
- Heating & cooling: Central heating; Central air conditioning; Ceiling fans; Wall/window unit(s)
- Interior features: Built-in features; Entrance foyer; Stacked bedroom layout
- Laundry & utility: Laundry room inside the unit on the main level; In-unit laundry
Neighborhood map
What this means for you Summary
Snapshot
- This is a 3-bed/1.0-bath single-family listed at $439k.
Deal economics
- At list price, monthly cash flow is $7 ($88/yr) — positive.
- The deal already cash-flows at list — no discount required.
- To meet the 1% rule (rent ≥ 1% of price), the offer needs to be $325k (25.9% below list).
- Recommended offer: $325k (25.9% below list) — sets the bar for 1% rule.
- Cap rate 6.3% vs local median 1.9% in Miami — top-decile yield for the area; either an underpriced asset or a hidden risk that comps aren't pricing in. Stress-test before assuming the spread holds.
Location & tenants
- Location reads 78/100 on livability (#177 in FL, #2,724 nationally) — a middle-class / working-renter tenant base. Strengths: amenities A+, commute A+, health & safety A+; Watch: employment C-, crime F, cost of living F.
- Miami-Dade (suburban): math 45% / reading 54% proficiency, ranked #40 of 73 in FL (top 55%) — families likely to look elsewhere, expect single-tenant / working-renter base with shorter leases; 64% free/reduced lunch — lower-income household profile, screen leases tightly.
- Zoned schools: Lenora Braynon Smith Elementary (math 32% / reading 27%, grade F, #1,896 of 2,144 statewide, top 90%, 344 students, 76% FRL); Georgia Jones Ayers Middle School (math 13% / reading 16%, grade F, #568 of 571 statewide, top 100%, 543 students, 68% FRL); Miami Northwestern Senior High (math 11% / reading 27%, grade F, #565 of 667 statewide, top 85%, 1,429 students, 75% FRL).
- Zoned-school proficiency averages 21% at this address vs 50% district-wide (-28 pts) — the specific schools serving this property underperform the Miami-Dade average; the district grade overstates school quality for this exact location.
- Market conditions: Rents rising (+2.3%/yr); 295 active listings in the ZIP; lower-income renter base — watch delinquency; 10,051 units permitted in Miami-Dade County in 2024 (7,758 in 5+ unit buildings).
- At $3,255/mo this rent would consume 95% of the median local household income ($41k/yr) (locally 2523% of renters already pay >50% of income on rent) — very limited rent-growth headroom before tenants either downsize or default.
Forward outlook
- Local home prices are declining (-3.0%/yr); year-one equity from $3k of loan paydown is wiped out by about $13k of value loss. Plan a longer hold.
- Miami-Dade County population projected at +28% by 2050 — long-run rental-demand tailwind backs the buy-and-hold thesis.
Negotiation context
- Only 7 days on market — expect competitive offers; lowballing is unlikely to land.
- Current owner paid $92k; list at $439k implies a 377% gain — meaningful room to come down on a strong offer.
Risks & watch-outs
- Climate carrying-cost: severe wind risk, 99% chance of damaging wind over 30y; extreme-heat days projected 7→29/yr by 2055 (HVAC capex compounding) — expect insurance premiums to compound above CPI over the hold.
Questions for the listing agent
- Built in 1962 — when were the roof, HVAC, electrical panel, plumbing, and water heater last replaced?
- Is there a deadline driving the sale (1031 exchange, divorce, estate, relocation)? That informs how much negotiation room exists.
- Schools are B-rated — typically a magnet for longer-tenancy family renters. What's the average tenant stay here, and is there a school-zone premium baked into asking?
- Crime grade is F in this area — have there been break-ins, vandalism, or insurance claims at this property in the last 3 years? What carrier currently insures it and at what premium?
- The area grade is low — what's the realistic commute time and amenity access for the typical tenant pool here? Any planned neighborhood developments (good or bad) we should know about?
- What's the average days-on-market for RENTAL listings here right now (not sales)? A rising rental-DOM trend means longer vacancies and softer asking-rent achievability than the comps imply.
- What's the recent tenant-quality profile in this submarket — average credit score on applications, eviction rate, late-payment / NSF rate, and stable-employment percentage? A property-management company in the area should have these aggregated.
- How much new for-sale + rental construction is in the pipeline within 1–3 miles? Heavy new supply typically softens prices + rents 12–24 months out; constrained supply supports both.
Investment metrics
- 1% rule
- 0.74% ✗
- Cap rate
- 6.31%
- Cash-on-cash
- 0.07%
- DSCR
- 1.00
- GRM
- 11.2
CMA / ARV
- ARV (on-the-fly)
- $584,550
- Comps found
- 11
Show comp detail 11 sales within ~0.75 mi
| Address | Dist | Beds/Ba | Sqft | Sold | Price | $/sf | Match |
|---|---|---|---|---|---|---|---|
| 960 NW 50th St | 0.29mi | 3/2.0 | 1,368 (+1%) | 15mo | $640,000 | $468 | 68 |
| 118 NW 44th St | 0.68mi | 2/2.0 (-1) | 1,329 (-2%) | 5mo | $775,000 | $583 | 53 |
| 337 NW 49th St | 0.43mi | 3/2.0 | 1,230 (-9%) | 10mo | $585,000 | $476 | 52 |
| 446 NW 45th St | 0.33mi | 2/2.0 (-1) | 1,169 (-13%) | 1mo | $555,000 | $475 | 52 |
| 1062 NW 41st St | 0.39mi | 4/2.0 (+1) | 1,494 (+11%) | 7mo | $380,000 | $254 | 49 |
| 4900 NW 10th Ave | 0.29mi | 3/2.0 | 1,188 (-12%) | 20mo | $640,000 | $539 | 46 |
| 150 NW 47th St | 0.63mi | 2/1.0 (-1) | 1,400 (+4%) | 17mo | $560,000 | $400 | 45 |
| 1276 NW 42nd St | 0.60mi | 3/2.0 | 1,284 (-5%) | 21mo | $310,000 | $241 | 42 |
| 1185 NW 48th St | 0.45mi | 3/2.0 | 1,506 (+12%) | 17mo | $540,000 | $359 | 42 |
| 1180 NW 50th St | 0.47mi | 2/1.0 (-1) | 1,180 (-13%) | 16mo | $310,000 | $263 | 38 |
| 1360 NW 41st St | 0.72mi | 2/1.0 (-1) | 1,488 (+10%) | 9mo | $645,000 | $433 | 37 |
Match score weights: distance 35% · size 25% · config 20% · recency 20%. Top-matched comps best support the ARV.
Projected returns pro-forma
-3.0% appreciation · 2.26% rent growth · sell at horizon
- IRR
- -17.0%
- Equity multiple
- 0.40×
- Total profit
- $-73,314
- Equity at exit
- $65,456
- IRR
- -10.2%
- Equity multiple
- 0.40×
- Total profit
- $-73,937
- Equity at exit
- $37,957
Cash invested: $122,920 (down + closing). Projections, not guarantees.
Landlord ↔ Tenant lean methodology
- Overall (STATE)
- 87 Strongly Landlord-Friendly
- State Florida
- 87 Strongly Landlord-Friendly · R+3
- County
- — inherits STATE
- City
- — inherits STATE
ZIP-level market 33127
- Home prices YoY
- -30.1%
- Rents YoY
- 2.3%
- Active inventory
- 295
- Price-to-rent
- 11.2×
Monthly cashflow live
- Estimated rent
- $3,255 medium interval (Pro) →
- Mortgage (P&I)
- −$2,302
- Tax from tax record
- −$79 /mo · $944/yr
- Insurance
- −$183
- HOA
- −$0
- Vacancy / Maint / Mgmt
- −$683
- Net cashflow
- $7
Break-even live
UW: 25.0% down · 7.5% · 30yr · 1.5% tax · 5.0% vac · 8.0% maint · 8.0% mgmt
Financing live
Cash to close
- Down payment
- $109,750
- Closing costs
- $13,170
- Reserves months
- —
- Total cash needed
- —
Loan-product check · same deal, 3 products live
Conventional
25% down · 7.5% · 30yr
- Down + closing
- —
- Monthly P&I
- —
- Monthly cashflow
- —
- DSCR
- —
- Eligible?
- —
Personal DTI + credit; lowest rate.
DSCR
20% down · 8.5% · 30yr
- Down + closing
- —
- Monthly P&I
- —
- Monthly cashflow
- —
- DSCR
- —
- Eligible?
- —
No personal income docs; deal must DSCR.
Hard money
10% down · 12.0% · 12mo
- Down + closing
- —
- Monthly P&I
- —
- Monthly cashflow
- —
- DSCR
- —
- Eligible?
- —
Short-term bridge; refi at stabilization.
Listing history 5 events
-
2026-05-14status Pending
-
2026-05-07$439,000 Active
-
2001-10-04soldstatus $92,000
-
1982-07-01soldstatus $1,777,777
-
1979-07-01soldstatus $10,000
ⓘ Source: listings_history table (triggers on properties + properties_extension) + one-shot
backfill from property_details.listing_events for pre-trigger history.
Tax reassessment forecast FL · Resets to sale price
- Current annual tax
- $944 · $79/mo
- Projected year-2 tax
- $3,644 · $304/mo
- Expected delta
- +$2,699/yr (+$225/mo · 285.9%)
ⓘ Screening estimate from a state-policy table — verify with the county assessor before closing.
Climate risk First Street
- Flood 1/10 Low FEMA zone X (unshaded) · 0% chance over 30 yrs
- Wildfire 1/10 Low
- Heat 10/10 Extreme 7 d/yr ≥103°F today · 29 d/yr by 30 yrs out
- Wind 10/10 Extreme 99% chance of damaging wind over 30 yrs
- Air quality 2/10 Low 1 unhealthy d/yr today · 1 by 30 yrs out
Nearby sold comps map
Loading sold comps map…
Walkable amenities ~0.75 mi
Loading nearby amenities…
Taxation est. · year 1
- Rental income
- $39,055
- − Mortgage interest
- −$24,591
- − Property taxes
- −$944
- − Insurance
- −$2,195
- − Repairs & maintenance
- −$3,124
- − Management
- −$3,124
- − Depreciation
- −$12,771
- Taxable loss
- −$7,695
- Est. tax savings @ 24.0%
- +$1,847
- After-tax cash flow
- $1,935/yr
For passive investors: Depreciation is non-cash, so a rental often shows a tax loss while cash-flowing — sheltering income. Rental losses are passive: they offset passive income freely, and up to $25,000/yr can offset ordinary (W-2) income if you actively participate and your MAGI is under $100k (phasing out to $0 by $150k); unused losses carry forward. On sale, claimed depreciation is recaptured at up to 25%, and gains may owe capital-gains tax (a 1031 exchange can defer both). Figures are a year-1 estimate at your 24.0% rate — not tax advice; consult a CPA.
Schools (NCES district)
- District
- Miami-Dade
- NCES district ID
- 1200390
- Math proficiency
- 45% ▼ -16.00%
- Reading proficiency
- 54% ▼ -5.00%
- Median HH income
- $43,928
- Composite
- 41.76/100
- National rank
- #3397
- State rank
- #40 of 73 in FL
Livability — Miami
- Score
- 78/100
- State rank
- #177
- US rank
- #2724
Category grades
Schools grade is shown separately in the Schools card above.
Census & demographics
- Census place
- Miami, FL
- County
- Miami-Dade County · 2,697,751 people
- City population
- 827,308
- Metro
- Miami-Fort Lauderdale-Pompano Beach, FL
- Population (ZIP)
- 26,786
- Household income
- $41,230
- Rent vs Own
- Severe rent burden
- 2523.0
Population outlook (Miami-Dade County) Hauer SSP2
- Today (2025)
- 3,126,439 people
- By 2030
- 3,325,765 · +6.4%
- By 2040
- 3,697,561 · +18.3%
- By 2050
- 4,012,134 · +28.3%
- By 2075
- 4,605,612 · +47.3%
- By 2100
- 4,866,598 · +55.7%
Race, ethnicity, and origin ACS 2023
- Neighborhood character
- Majority Hispanic (55%)
- Race & ethnicity
- Hispanic / Latino 55% Black 39% Two or more races 30% White 4%
- Hispanic origin (detail)
- Mexican 2% Puerto Rican 6% Cuban 9% Dominican 5%
- Common ancestry
- Hispanic 11%
- Foreign-born
- 43% · Canada, Jamaica, Dominican Republic
- Languages at home
- 34% English-only · Spanish 53% French/Haitian/Cajun 12%
Political lean MEDSL · Miami-Dade
- 2024 margin
- R (+11.4) · D 43.9% · R 55.4%
- 2008→2024 swing
- -27.6pp toward R · 2008: 16.1pp · 2024: -11.4pp
- All cycles
- 2024: R+11.4 2020: D+7.3 2016: D+29.6 2012: D+23.7 2008: D+16.1
Not yet ingested
- Civics
- —
Market trends
- HPI YoY
- ▼ -293.00%
- Current HPI
- 680.1845
- Rent YoY
- ▲ 2.26%
- Metro
- Miami-Fort Lauderdale-Pompano Beach, FL
- State GDP YoY
- ▲ 3.28%
- F500 in state
- 36
Industry mix (Fortune 500 HQ in FL)
| Industry | F500 HQs | Revenue |
|---|---|---|
| Industrial Technology | 2 | $29B |
|
||
| Insurance | 2 | $17B |
|
||
| Retail | 1 | $60B |
|
||
| Technology Distribution | 1 | $58B |
|
||
| Homebuilding | 1 | $35B |
|
||
| Technology Manufacturing | 1 | $35B |
|
||
Price history
+4290.0% since first listed5 events — show timeline
- 2026-05-14 Pending — Beaches MLS
- 2026-05-07 Listed $439,000 Beaches MLS
- 2001-10-04 Sold (Public Records) $92,000 Public Records
- 1982-07-01 Sold (Public Records) $1,777,777 Public Records
- 1979-07-01 Sold (Public Records) $10,000 Public Records
Property tax history
-1.1%/yrLatest (2025): $944 · +1.1% YoY. Source: county tax records.
Cash-flow waterfall
monthlySold comps — $/sqft
last 12 mo · ≤1 miLoading sold comps…