10118 Whistling Pne Ct · Jacksonville, FL
Flood risk No data
- FEMA flood zone
- —
- Chance of flooding over 30 yrs
- —
- Est. flood insurance / yr
- —
Fire risk No data
- Est. fire insurance / yr
- —
Heat risk No data
- Hot days now (above threshold)
- —
- Hot days in 30 yrs
- —
Wind risk No data
- Chance of severe wind over 30 yrs
- —
Air-quality risk No data
- Unhealthy air days now
- —
- Unhealthy air days in 30 yrs
- —
Risk factors via First Street. Map © Google.
Why this score? — see what drove the D- grade
The composite is a weighted blend of 9 inputs, each scored 0–100. Each bar is that input's sub-score; the figure is the points it added to the 100-point composite (weight × sub-score).
- Cash flow +11.4/30.0
- ARV discount +5.9/15.0
- Condition / age +4.8/5.0
- Livability +4.2/5.0
- Schools +3.9/10.0
- DSCR +3.3/10.0
- 1% rule +3.1/10.0
- Rent growth +3.0/5.0
- Appreciation +0.0/10.0
$248,000
🖨 Deal sheet 📄 Offer letter ✓ Due diligence
Listing remarks MLS
Contact Sales for Details
Key facts
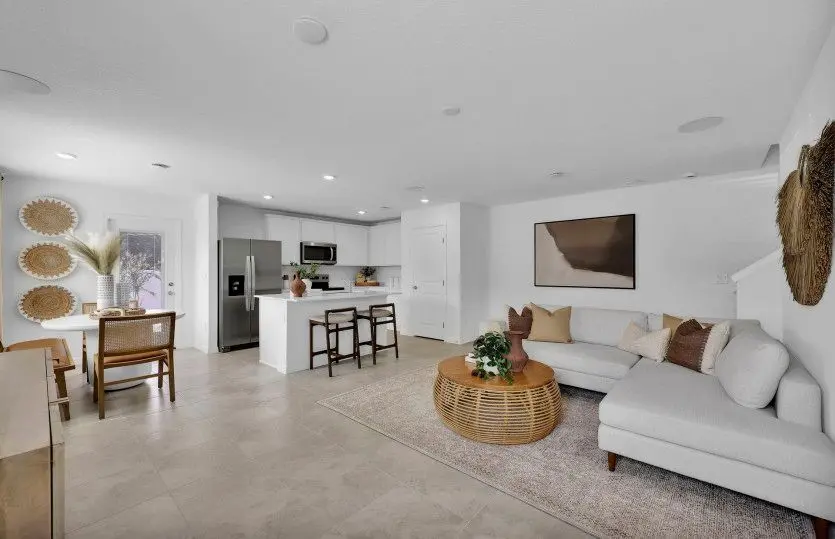
- Quartz countertops
- Private patio
- Large island
Tags
Property features AI
Finance
- HOA & community: Monthly association fee of $195 covering water; Homeowners association present
Exterior
- Parking: 2-car garage with garage door opener; Off-street parking
- Utilities: Underground electric; Public sewer; Water available; Sewer connected; Electricity connected; Cable available
- Home design: Townhouse; Property attached
- Construction: Built with fiber cement and frame construction; Shingle roof
- Exterior features: Patio; City street frontage; Asphalt road surface; Sprinklers in front and rear; Pond/waterfront
Interior
- Kitchen: Dishwasher; Electric oven; Electric range; Microwave; Refrigerator; Electric water heater
- Bedrooms: 3 bedrooms
- Flooring: Carpet; Tile
- Bathrooms: 2 full bathrooms; 1 half bathroom
- Heating & cooling: Heat pump; Electric heating; Central air conditioning; Electric cooling
- Interior features: Two levels; Pond on the property; Sprinklers in front and rear
- Laundry & utility: Washer; Dryer
Neighborhood map
What this means for you Summary
Snapshot
- This is a 3-bed/2.5-bath townhouse listed at $248k. Condition is rated excellent.
Deal economics
- At list price, monthly cash flow is $-85 ($-1k/yr) — negative.
- To cash-flow at today's rent, offer at most $233k (6.0% below list).
- To meet the 1% rule (rent ≥ 1% of price), the offer needs to be $200k (19.4% below list).
- Recommended offer: $200k (19.4% below list) — sets the bar for 1% rule.
- Cap rate 5.9% vs local median 4.0% in Jacksonville — top-decile yield for the area; either an underpriced asset or a hidden risk that comps aren't pricing in. Stress-test before assuming the spread holds.
Location & tenants
- Location reads 83/100 on livability (#50 in FL, #911 nationally) — a professional / high-income tenant draw. Strengths: amenities A+, commute A+, housing A+.
- Duval (urban): math 46% / reading 45% proficiency, ranked #48 of 73 in FL (top 66%) — families likely to look elsewhere, expect single-tenant / working-renter base with shorter leases.
- Zoned schools: Crystal Springs Elementary School (math 51% / reading 41%, grade D-, #1,234 of 2,144 statewide, top 58%, 907 students, 66% FRL); Edward H. White High School (math 31% / reading 25%, grade F, #464 of 667 statewide, top 70%, 1,538 students, 64% FRL) — zoned schools average 65% FRL vs 49% district-wide (16 pts higher); higher-poverty schools than district average — tighter screening recommended.
- Market conditions: Rents rising (+2.1%/yr); 217 active listings in the ZIP; 13 comparable units currently listed for rent nearby; rentals at typical pace (median 16d on market — plan ~3-4 weeks tenant-placement turnaround); solid renter incomes; 6,503 units permitted in Duval County in 2024 (1,131 in 5+ unit buildings).
Forward outlook
- Local home prices are declining (-3.0%/yr); year-one equity from $2k of loan paydown is wiped out by about $7k of value loss. Plan a longer hold.
- Duval County population projected at +19% by 2050 — long-run rental-demand tailwind backs the buy-and-hold thesis.
Negotiation context
- It's been on market 48 days — a 3% lower offer ($241k) is reasonable based on typical stale-listing flexibility.
- 2 sale attempts with the ask held roughly flat each time — persistent listings suggest the price (not the market) is what's stuck; bring a comps-based counter.
Questions for the listing agent
- What do current leases actually rent for vs. the listed asking? Can we see a recent rent roll and the last 12 months of T-12 income?
- It's been on market 48 days. Have you received any prior offers? Is the seller open to a 19% concession, seller financing, or rate buy-down credit?
- What does the HOA fee cover, when was the last increase, and are there any pending special assessments or reserve-fund shortfalls?
- Is there a deadline driving the sale (1031 exchange, divorce, estate, relocation)? That informs how much negotiation room exists.
- Schools are B-rated — typically a magnet for longer-tenancy family renters. What's the average tenant stay here, and is there a school-zone premium baked into asking?
- The area grade is low — what's the realistic commute time and amenity access for the typical tenant pool here? Any planned neighborhood developments (good or bad) we should know about?
- What's the average days-on-market for RENTAL listings here right now (not sales)? A rising rental-DOM trend means longer vacancies and softer asking-rent achievability than the comps imply.
- What's the recent tenant-quality profile in this submarket — average credit score on applications, eviction rate, late-payment / NSF rate, and stable-employment percentage? A property-management company in the area should have these aggregated.
- How much new for-sale + rental construction is in the pipeline within 1–3 miles? Heavy new supply typically softens prices + rents 12–24 months out; constrained supply supports both.
Investment metrics
- 1% rule
- 0.81% ✗
- Cap rate
- 5.88%
- Cash-on-cash
- -1.46%
- DSCR
- 0.93
- GRM
- 10.3
CMA / ARV
- ARV (on-the-fly)
- $239,616
- Comps found
- 12
Show comp detail 12 sales within ~0.75 mi
| Address | Dist | Beds/Ba | Sqft | Sold | Price | $/sf | Match |
|---|---|---|---|---|---|---|---|
| 10124 Whistling Pne Ct | 0.01mi | 3/2.5 | 1,536 (0%) | 1mo | $257,000 | $167 | 98 |
| 10130 Whistling Pne Ct | 0.02mi | 3/2.5 | 1,526 (-1%) | 1mo | $238,390 | $156 | 97 |
| 10126 Whistling Pne Ct | 0.01mi | 3/2.5 | 1,526 (-1%) | 1mo | $242,890 | $159 | 97 |
| 1880 Normandy Pines Ln | 0.05mi | 3/2.5 | 1,526 (-1%) | 1mo | $239,390 | $157 | 96 |
| 1856 Normandy Pines Ln | 0.07mi | 3/2.5 | 1,526 (-1%) | 1mo | $238,390 | $156 | 95 |
| 10129 Treasure Oaks Ct | 0.03mi | 3/2.5 | 1,526 (-1%) | 4mo | $227,890 | $149 | 94 |
| 1876 Normandy Pines Ln | 0.05mi | 3/2.5 | 1,526 (-1%) | 3mo | $231,000 | $151 | 94 |
| 1872 Normandy Pines Ln | 0.05mi | 3/2.5 | 1,526 (-1%) | 3mo | $228,000 | $149 | 94 |
| 10113 Treasure Oaks Ct | 0.02mi | 3/2.5 | 1,526 (-1%) | 4mo | $227,000 | $149 | 94 |
| 1860 Normandy Pines Ln | 0.06mi | 3/2.5 | 1,526 (-1%) | 2mo | $241,390 | $158 | 94 |
| 1874 Normandy Pines Ln | 0.05mi | 3/2.5 | 1,526 (-1%) | 3mo | $232,890 | $153 | 94 |
| 1870 Normandy Pines Ln | 0.05mi | 3/2.5 | 1,526 (-1%) | 5mo | $236,000 | $155 | 93 |
Match score weights: distance 35% · size 25% · config 20% · recency 20%. Top-matched comps best support the ARV.
Projected returns pro-forma
-3.0% appreciation · 2.12% rent growth · sell at horizon
- IRR
- -19.7%
- Equity multiple
- 0.32×
- Total profit
- $-47,337
- Equity at exit
- $36,978
- IRR
- -14.4%
- Equity multiple
- 0.20×
- Total profit
- $-55,243
- Equity at exit
- $21,443
Cash invested: $69,440 (down + closing). Projections, not guarantees.
Landlord ↔ Tenant lean methodology
- Overall (STATE)
- 87 Strongly Landlord-Friendly
- State Florida
- 87 Strongly Landlord-Friendly · R+3
- County
- — inherits STATE
- City
- — inherits STATE
ZIP-level market 32221
- Home prices YoY
- -19.2%
- Rents YoY
- 2.1%
- Active inventory
- 217
- Price-to-rent
- 10.3×
Monthly cashflow live
- Estimated rent
- $1,999 high interval (Pro) →
- Mortgage (P&I)
- −$1,301
- Tax from tax record
- −$65 /mo · $781/yr
- Insurance
- −$103
- HOA
- −$195
- Vacancy / Maint / Mgmt
- −$420
- Net cashflow
- $-85
Break-even live
UW: 25.0% down · 7.5% · 30yr · 1.5% tax · 5.0% vac · 8.0% maint · 8.0% mgmt
Financing live
Cash to close
- Down payment
- $62,000
- Closing costs
- $7,440
- Reserves months
- —
- Total cash needed
- —
Loan-product check · same deal, 3 products live
Conventional
25% down · 7.5% · 30yr
- Down + closing
- —
- Monthly P&I
- —
- Monthly cashflow
- —
- DSCR
- —
- Eligible?
- —
Personal DTI + credit; lowest rate.
DSCR
20% down · 8.5% · 30yr
- Down + closing
- —
- Monthly P&I
- —
- Monthly cashflow
- —
- DSCR
- —
- Eligible?
- —
No personal income docs; deal must DSCR.
Hard money
10% down · 12.0% · 12mo
- Down + closing
- —
- Monthly P&I
- —
- Monthly cashflow
- —
- DSCR
- —
- Eligible?
- —
Short-term bridge; refi at stabilization.
Rent comps 13 comps
| Address | Beds | Baths | Sqft | Rent | $/sqft | DOM | Units | Dist |
|---|---|---|---|---|---|---|---|---|
| 2120 Blair Rd Jacksonville, FL | 3.0 | 2.0 | 1272 | $1,675 | $1.32 | 23d | 1 | 0.36mi |
| 2514 Paris Mill Rd Jacksonville, FL | 3.0 | 2.0 | 1974 | $2,096 | $1.06 | 7d | 1 | 0.62mi |
| 10355 Shelby Creek Rd S Jacksonville, FL | 4.0 | 2.0 | 1917 | $2,100 | $1.10 | 20d | 1 | 0.65mi |
| 9670 Freefall Rd Jacksonville, FL | 3.0 | 2.5 | 2109 | $2,300 | $1.09 | 14d | 1 | 0.74mi |
| 2081 Chaffee Rd S #19 Jacksonville, FL | 3.0 | 2.0 | 1152 | $1,619 | $1.41 | 23d | 1 | 0.81mi |
| 2081 Chaffee Rd S Unit 43 Jacksonville, FL | 4.0 | 2.0 | 1904 | $1,829 | $0.96 | 4d | 1 | 0.82mi |
| 2081 Chaffee Rd S #72 Jacksonville, FL | 2.0 | 2.0 | 1216 | $1,309 | $1.08 | 23d | 1 | 0.82mi |
| 2625 Fox Creek Dr Jacksonville, FL | 4.0 | 2.0 | 2018 | $2,040 | $1.01 | 23d | 1 | 0.89mi |
| 10161 Meadow Pointe Dr Jacksonville, FL | 3.0 | 2.0 | 1810 | $2,035 | $1.12 | 16d | 1 | 1.12mi |
| 2167 Kistlers Ridge Way Jacksonville, FL | 4.0 | 2.0 | 1456 | $1,900 | $1.30 | 14d | 1 | 1.22mi |
| 2210 Kistlers Ridge Way Jacksonville, FL | 4.0 | 2.0 | 1456 | $1,846 | $1.27 | 23d | 1 | 1.27mi |
| 9183 Raptor Dr Jacksonville, FL | 3.0 | 2.0 | 1091 | $1,724 | $1.58 | 4d | 1 | 1.33mi |
| 9101 Normandy Blvd Jacksonville, FL | 2.0–3.0 | 1.0–2.0 | 994 | $1,629 | $1.64 | 3d | 1 | 1.40mi |
HOA detail
- Monthly dues
- $195 · $2,340/yr
Listing history 19 events
-
2026-06-18price $248,000 Active 48 DOM
-
2026-06-18days on market $244,000 Active 48 DOM
-
2026-06-17days on market $244,000 Active 47 DOM
-
2026-06-16days on market $244,000 Active 46 DOM
-
2026-06-15days on market $244,000 Active 45 DOM
-
2026-06-13days on market $244,000 Active 42 DOM
-
2026-06-10days on market $244,000 Active 39 DOM
-
2026-06-08days on market $244,000 Active 38 DOM
-
2026-06-07days on market $244,000 Active 37 DOM
-
2026-06-05days on market $244,000 Active 34 DOM
-
2026-06-03days on market $244,000 Active 33 DOM
-
2026-06-02days on market $244,000 Active 32 DOM
-
2026-06-01days on market $244,000 Active 31 DOM
-
2026-05-31days on market $244,000 Active 30 DOM
-
2026-05-24price $254,000 25-char remark
Show marketing remark (25 chars)
Contact Sales for Details
-
2026-05-20price $254,000
-
2026-05-11$259,290 Active 25-char remark
Show marketing remark (25 chars)
Contact Sales for Details
-
2026-05-07price $259,290
-
2026-05-01$264,290 Active
ⓘ Source: listings_history table (triggers on properties + properties_extension) + one-shot
backfill from property_details.listing_events for pre-trigger history.
Tax reassessment forecast FL · Resets to sale price
- Current annual tax
- $781 · $65/mo
- Projected year-2 tax
- $2,058 · $172/mo
- Expected delta
- +$1,278/yr (+$106/mo · 163.7%)
ⓘ Screening estimate from a state-policy table — verify with the county assessor before closing.
Nearby sold comps map
Loading sold comps map…
Walkable amenities ~0.75 mi
Loading nearby amenities…
Taxation est. · year 1
- Rental income
- $23,988
- − Mortgage interest
- −$13,892
- − Property taxes
- −$781
- − Insurance
- −$1,240
- − Repairs & maintenance
- −$1,919
- − Management
- −$1,919
- − HOA
- −$2,340
- − Depreciation
- −$7,215
- Taxable loss
- −$5,317
- Est. tax savings @ 24.0%
- +$1,276
- After-tax cash flow
- $260/yr
For passive investors: Depreciation is non-cash, so a rental often shows a tax loss while cash-flowing — sheltering income. Rental losses are passive: they offset passive income freely, and up to $25,000/yr can offset ordinary (W-2) income if you actively participate and your MAGI is under $100k (phasing out to $0 by $150k); unused losses carry forward. On sale, claimed depreciation is recaptured at up to 25%, and gains may owe capital-gains tax (a 1031 exchange can defer both). Figures are a year-1 estimate at your 24.0% rate — not tax advice; consult a CPA.
Condition & rehab AI · 12 photos
This brand-new Charter townhome is move-in ready with excellent condition and a timeless design. It offers a spacious layout, modern finishes, and a well-maintained exterior.
Value-add opportunities
- Both Painting the exterior — Enhances curb appeal and value
- Both Landscaping improvements — Enhances curb appeal and value
- Both Add smart home features — Improves convenience and marketability
Renovation cost estimate screening
Value-add ROI direction
- Both Painting the exterior — Enhances curb appeal and value ↑
- Both Landscaping improvements — Enhances curb appeal and value ↑
- Both Add smart home features — Improves convenience and marketability ↑
ⓘ Cost ranges are severity-bucket heuristics (US national rule-of-thumb). Get contractor quotes + a written scope before underwriting a rehab budget.
Schools (NCES district)
- District
- Duval
- NCES district ID
- 1200480
- Math proficiency
- 46% ▼ -11.00%
- Reading proficiency
- 45% ▼ -4.00%
- Median HH income
- $48,987
- Composite
- 38.97/100
- National rank
- #4076
- State rank
- #48 of 73 in FL
Livability — Jacksonville
- Score
- 83/100
- State rank
- #50
- US rank
- #911
Category grades
Schools grade is shown separately in the Schools card above.
Census & demographics
- Census place
- Jacksonville, FL
- County
- Duval County · 1,015,274 people
- City population
- 979,034
- Metro
- Jacksonville, FL
- Population (ZIP)
- 32,833
- Household income
- $82,969
- Rent vs Own
- Severe rent burden
- 516.0
Population outlook (Duval County) Hauer SSP2
- Today (2025)
- 1,013,010 people
- By 2030
- 1,059,228 · +4.6%
- By 2040
- 1,141,439 · +12.7%
- By 2050
- 1,205,258 · +19.0%
- By 2075
- 1,324,282 · +30.7%
- By 2100
- 1,319,620 · +30.3%
Race, ethnicity, and origin ACS 2023
- Neighborhood character
- Diverse neighborhood (Simpson 0.65)
- Race & ethnicity
- White 48% Black 33% Hispanic / Latino 9% Two or more races 6% Asian 4%
- Hispanic origin (detail)
- Mexican 2% Puerto Rican 5%
- Common ancestry
- Italian 3% Slovak 2% Hispanic 1%
- Foreign-born
- 9% · Canada, Vietnam
- Languages at home
- 88% English-only · Spanish 6% French/Haitian/Cajun 2% Vietnamese 2%
Political lean MEDSL · Duval
- 2024 margin
- Toss-up / Even · D 48.7% · R 50.1% · Other 1.2%
- 2008→2024 swing
- +0.4pp no change · 2008: -1.9pp · 2024: -1.5pp
- All cycles
- 2024: R+1.5 2020: D+3.8 2016: R+1.5 2012: R+3.6 2008: R+1.9
Not yet ingested
- Civics
- —
Market trends
- HPI YoY
- ▼ -62.74%
- Current HPI
- 263.7591
- Rent YoY
- ▲ 2.12%
- Metro
- Jacksonville, FL
- State GDP YoY
- ▲ 3.28%
- F500 in state
- 36
Industry mix (Fortune 500 HQ in FL)
| Industry | F500 HQs | Revenue |
|---|---|---|
| Industrial Technology | 2 | $29B |
|
||
| Insurance | 2 | $17B |
|
||
| Retail | 1 | $60B |
|
||
| Technology Distribution | 1 | $58B |
|
||
| Homebuilding | 1 | $35B |
|
||
| Technology Manufacturing | 1 | $35B |
|
||
Price history
-3.9% since first listed5 events — show timeline
- 2026-05-24 Price Changed $254,000 Zillow
- 2026-05-20 Price Changed $254,000 realMLS
- 2026-05-11 Listed $259,290 Zillow
- 2026-05-07 Price Changed $259,290 realMLS
- 2026-05-01 Listed $264,290 realMLS
Cash-flow waterfall
monthlySold comps — $/sqft
last 12 mo · ≤1 miLoading sold comps…