 6-Plex
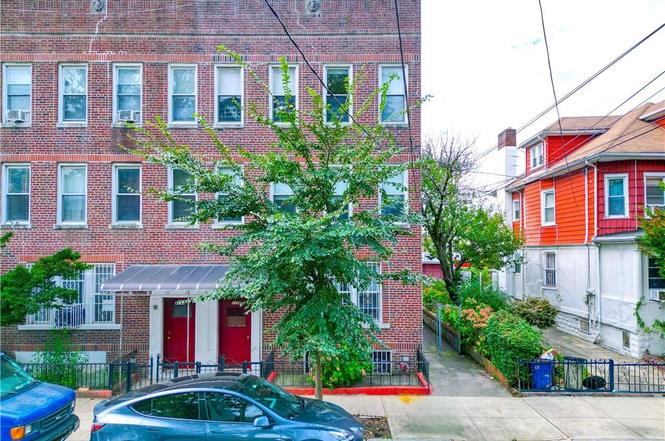
2176 E 13th St · New York, NY
Flood risk 1/10 · Minimal
- FEMA flood zone
- X (unshaded)
- Chance of flooding over 30 yrs
- 0.0%
- Est. flood insurance / yr
- $507 – $1,088
Fire risk 1/10 · Minimal
- Est. fire insurance / yr
- $691 – $1,283
Heat risk 7/10 · Major
- Hot days now (above 97°F)
- 7 days/yr
- Hot days in 30 yrs
- 16 days/yr
Wind risk 6/10 · Moderate
- Chance of severe wind over 30 yrs
- 72.0%
Air-quality risk 4/10 · Minor
- Unhealthy air days now
- 5 days/yr
- Unhealthy air days in 30 yrs
- 7 days/yr
Risk factors via First Street. Map © Google.
Why this score? — see what drove the B grade
The composite is a weighted blend of 9 inputs, each scored 0–100. Each bar is that input's sub-score; the figure is the points it added to the 100-point composite (weight × sub-score).
- Cash flow +30.0/30.0
- 1% rule +10.0/10.0
- DSCR +10.0/10.0
- ARV discount +7.5/15.0
- Rent growth +5.0/5.0
- Schools +5.0/10.0
- Livability +3.8/5.0
- Condition / age +2.5/5.0
- Appreciation +0.0/10.0
$1,299,000
🖨 Deal sheet 📄 Offer letter ✓ Due diligence
Multi-family units
County records classify this as Multi-Family (5+ Unit). Listing-text estimate: 6 units. confirmed
5+ unit building — per-unit beds/baths from public records are typically unavailable; the breakdown below (if shown) is an estimate from the listing text.
Listing remarks
Prime Sheepshead Bay location! This semi-detached 6-family solid brick building offers an excellent investment opportunity. The property features one 1-bedroom/1-bath unit and five 2-bedroom/1-bath units, each with a living room, kitchen, and dining area. There’s also a full basement with a laundry area, providing additional functionality and storage space. Building size: 21 × 80 | Lot size: 28 × 100. Conveniently situated right off the bustling Avenue U shopping district, surrounded by a wide variety of restaurants, shops, supermarkets, and daily conveniences. Just minutes to the Q train station and nearby B3 and B68 buses, ensuring easy access to transportation.
Key facts
- Laundry area
- Solid brick building
- Full basement
Tags
Property features AI
Finance
- Other: Zoning: R5
- Financial info: Property produces reported rent income of $103,200 annually; Units currently occupied month-to-month; Financing options considered: exchange, bank mortgage, or cash
Exterior
- Parking: No parking on site
- Utilities: 110V electric; Gas hot water; Gas heating fuel; Steam/radiator heat
- Home design: Semi-detached residential building; Flat roof; Brick exterior
- Construction: Brick construction; Poured concrete foundation
- Exterior features: Back yard; Storage rooms in the building
Interior
- Kitchen: Kitchens include refrigerator and stove
- Bedrooms: Six residential units: one 1-bedroom unit and five 2-bedroom units; Unit 1 is a 1-bedroom on the 1st floor (month-to-month tenancy); Units 2–6 are 2-bedroom units on floors 1–3 (month-to-month tenancies)
- Flooring: Hardwood floors; Tile floors; Other flooring (see remarks)
- Bathrooms: Six full bathrooms (one in each unit)
- Heating & cooling: Steam/radiator heat; Gas heating fuel; 110V electric service; Gas hot water
- Interior features: Central A/C unit listed (0 AC units reported); Laundry area; Refrigerator; Stove; Other interior features noted
- Laundry & utility: Shared laundry area
Neighborhood map
What this means for you Summary
Snapshot
- This is a 6 × 11-bed/6.0-bath units multifamily listed at $1.30M.
Deal economics
- At list price, monthly cash flow is $10k ($119k/yr) — positive. Per door: $2k/mo.
- The deal already cash-flows at list — no discount required.
- Meets the 1% rule at list price ($24k rent vs $1.30M).
- Recommended offer: $1.18M (9.0% below list) — sets the bar for market timing.
- Cap rate 15.4% vs local median 2.6% in New York — top-decile yield for the area; either an underpriced asset or a hidden risk that comps aren't pricing in. Stress-test before assuming the spread holds.
Location & tenants
- Location reads 75/100 on livability (#268 in NY, #4,188 nationally) — a middle-class / working-renter tenant base. Strengths: amenities A+, commute A+, health & safety A; Watch: crime F, cost of living F.
- Market conditions: Rents rising fast (+15.8%/yr); 355 active listings in the ZIP; 10,063 units permitted in Kings County in 2024 (9,789 in 5+ unit buildings).
- At $23,830/mo this rent would consume 405% of the median local household income ($71k/yr) (locally 4771% of renters already pay >50% of income on rent) — very limited rent-growth headroom before tenants either downsize or default.
Forward outlook
- Local home prices are declining (-3.0%/yr); year-one equity from $9k of loan paydown is wiped out by about $39k of value loss. Plan a longer hold.
- Kings County population projected at +13% by 2050 — modest demand growth; plan on rents tracking national, not racing it.
- At projected returns (-3.0% appreciation + 8.0% rent growth), your $364k cash investment doubles in ~4 years — after that, you're playing with house money.
Negotiation context
- It's been on market 111 days — a 9% lower offer ($1.18M) is reasonable based on typical stale-listing flexibility.
- 2 sale attempts with the ask held roughly flat each time — persistent listings suggest the price (not the market) is what's stuck; bring a comps-based counter.
- Current owner paid $110k; list at $1.30M implies a 1081% gain — meaningful room to come down on a strong offer.
Risks & watch-outs
- Watch-outs: built in 1927 — expect roof / HVAC / electrical / plumbing capex.
- Climate carrying-cost: major wind risk, 72% chance of damaging wind over 30y; extreme-heat days projected 7→16/yr by 2055 (HVAC capex compounding) — expect insurance premiums to compound above CPI over the hold.
Questions for the listing agent
- It's been on market 111 days. Have you received any prior offers? Is the seller open to a 9% concession, seller financing, or rate buy-down credit?
- Can we see the unit-by-unit rent roll, current vacancy, and any below-market leases? What's the average tenancy length?
- What capital expenditures (roof, boiler, parking lot, exteriors) have been made in the last 5 years, and what's planned in the next 2?
- Built in 1927 — when were the roof, HVAC, electrical panel, plumbing, and water heater last replaced?
- Why hasn't it sold? Are there any deal-killer items the seller is aware of (foundation, flood, title, zoning, code violations)?
- Is there a deadline driving the sale (1031 exchange, divorce, estate, relocation)? That informs how much negotiation room exists.
- Schools are B-rated — typically a magnet for longer-tenancy family renters. What's the average tenant stay here, and is there a school-zone premium baked into asking?
- Crime grade is F in this area — have there been break-ins, vandalism, or insurance claims at this property in the last 3 years? What carrier currently insures it and at what premium?
- What's the average days-on-market for RENTAL listings here right now (not sales)? A rising rental-DOM trend means longer vacancies and softer asking-rent achievability than the comps imply.
- What's the recent tenant-quality profile in this submarket — average credit score on applications, eviction rate, late-payment / NSF rate, and stable-employment percentage? A property-management company in the area should have these aggregated.
- How much new apartment / multifamily construction is in the pipeline within 1–3 miles? Heavy new supply (>2% of stock underway) typically softens rents 12–24 months out; light construction supports rent growth.
Investment metrics
- 1% rule
- 1.83% ✓
- Cap rate
- 15.44%
- Cash-on-cash
- 32.68%
- DSCR
- 2.45
- GRM
- 4.5
CMA / ARV
No comps found within radius.
Projected returns pro-forma
-3.0% appreciation · 8.0% rent growth · sell at horizon
- IRR
- 33.3%
- Equity multiple
- 2.50×
- Total profit
- $546,666
- Equity at exit
- $193,685
- IRR
- 42.9%
- Equity multiple
- 6.12×
- Total profit
- $1,862,916
- Equity at exit
- $112,314
Cash invested: $363,720 (down + closing). Projections, not guarantees.
Landlord ↔ Tenant lean methodology
- Overall (CITY)
- 0 Strongly Tenant-Friendly
- State New York
- 15 Strongly Tenant-Friendly · D+10
- County
- — inherits STATE
- City New York
- 0 Strongly Tenant-Friendly · D+34
ZIP-level market 11229
- Rents YoY
- 15.8%
- Active inventory
- 355
- Price-to-rent
- 27.3×
Monthly cashflow live
- Estimated rent
- $23,830 medium interval (Pro) →
- Mortgage (P&I)
- −$6,812
- Tax from tax record
- −$1,567 /mo · $18,800/yr
- Insurance
- −$541
- HOA
- −$0
- Vacancy / Maint / Mgmt
- −$5,004
- Net cashflow
- $9,906
Break-even live
6-unit breakdown (identical units grouped — click to expand)
| Units | Beds | Baths | Est. rent |
|---|---|---|---|
| 6× units | 11 | 6 | $23,832 |
| #1 | 11 | 6 | $3,972 |
| #2 | 11 | 6 | $3,972 |
| #3 | 11 | 6 | $3,972 |
| #4 | 11 | 6 | $3,972 |
| #5 | 11 | 6 | $3,972 |
| #6 | 11 | 6 | $3,972 |
| Total (6 units) | $23,830 | ||
UW: 25.0% down · 7.5% · 30yr · 1.5% tax · 5.0% vac · 8.0% maint · 8.0% mgmt
Financing live
Cash to close
- Down payment
- $324,750
- Closing costs
- $38,970
- Reserves months
- —
- Total cash needed
- —
Loan-product check · same deal, 3 products live
Conventional
25% down · 7.5% · 30yr
- Down + closing
- —
- Monthly P&I
- —
- Monthly cashflow
- —
- DSCR
- —
- Eligible?
- —
Personal DTI + credit; lowest rate.
DSCR
20% down · 8.5% · 30yr
- Down + closing
- —
- Monthly P&I
- —
- Monthly cashflow
- —
- DSCR
- —
- Eligible?
- —
No personal income docs; deal must DSCR.
Hard money
10% down · 12.0% · 12mo
- Down + closing
- —
- Monthly P&I
- —
- Monthly cashflow
- —
- DSCR
- —
- Eligible?
- —
Short-term bridge; refi at stabilization.
Listing history 15 events
-
2026-06-18days on market $1,299,000 Active 111 DOM
-
2026-06-17days on market $1,299,000 Active 110 DOM
-
2026-06-15days on market $1,299,000 Active 108 DOM
-
2026-06-13days on market $1,299,000 Active 106 DOM
-
2026-06-10days on market $1,299,000 Active 102 DOM
-
2026-06-08days on market $1,299,000 Active 101 DOM
-
2026-06-08days on market $1,299,000 Active 100 DOM
-
2026-06-04days on market $1,299,000 Active 97 DOM
-
2026-06-03days on market $1,299,000 Active 96 DOM
-
2026-06-01days on market $1,299,000 Active 94 DOM
-
2026-05-31days on market $1,299,000 Active 93 DOM
-
2026-04-28status Active
-
2026-01-19status Pending
-
2025-11-20$1,299,000 Active
-
1983-11-01soldstatus $110,000
ⓘ Source: listings_history table (triggers on properties + properties_extension) + one-shot
backfill from property_details.listing_events for pre-trigger history.
Tax reassessment forecast NY · Partial reset (capped growth)
- Current annual tax
- $18,800 · $1,567/mo
- Projected year-2 tax
- $20,376 · $1,698/mo
- Expected delta
- +$1,577/yr (+$131/mo · 8.4%)
ⓘ Screening estimate from a state-policy table — verify with the county assessor before closing.
Climate risk First Street
- Flood 1/10 Low FEMA zone X (unshaded) · 0% chance over 30 yrs
- Wildfire 1/10 Low
- Heat 7/10 Severe 7 d/yr ≥97°F today · 16 d/yr by 30 yrs out
- Wind 6/10 Major 72% chance of damaging wind over 30 yrs
- Air quality 4/10 Moderate 5 unhealthy d/yr today · 7 by 30 yrs out
Nearby sold comps map
Loading sold comps map…
Walkable amenities ~0.75 mi
Loading nearby amenities…
Taxation est. · year 1
- Rental income
- $285,960
- − Mortgage interest
- −$72,764
- − Property taxes
- −$18,800
- − Insurance
- −$6,495
- − Repairs & maintenance
- −$22,877
- − Management
- −$22,877
- − Depreciation
- −$37,789
- Taxable income
- $104,358
- Est. tax owed @ 24.0%
- −$25,046
- After-tax cash flow
- $93,822/yr
For passive investors: Depreciation is non-cash, so a rental often shows a tax loss while cash-flowing — sheltering income. Rental losses are passive: they offset passive income freely, and up to $25,000/yr can offset ordinary (W-2) income if you actively participate and your MAGI is under $100k (phasing out to $0 by $150k); unused losses carry forward. On sale, claimed depreciation is recaptured at up to 25%, and gains may owe capital-gains tax (a 1031 exchange can defer both). Figures are a year-1 estimate at your 24.0% rate — not tax advice; consult a CPA.
Schools (NCES district)
No district data.
Livability — New York
- Score
- 75/100
- State rank
- #268
- US rank
- #4188
Category grades
Schools grade is shown separately in the Schools card above.
Census & demographics
- Census place
- New York, NY
- County
- Kings County · 2,614,986 people
- City population
- 7,731,280
- Metro
- New York-Newark-Jersey City, NY-NJ-PA
- Population (ZIP)
- 78,377
- Household income
- $70,603
- Rent vs Own
- Severe rent burden
- 4771.0
Population outlook (Kings County) Hauer SSP2
- Today (2025)
- 2,847,441 people
- By 2030
- 2,937,006 · +3.1%
- By 2040
- 3,095,491 · +8.7%
- By 2050
- 3,228,968 · +13.4%
- By 2075
- 3,321,723 · +16.7%
- By 2100
- 3,111,387 · +9.3%
Race, ethnicity, and origin ACS 2023
- Neighborhood character
- Diverse neighborhood (Simpson 0.60)
- Race & ethnicity
- White 59% Asian 22% Hispanic / Latino 9% Black 6% Two or more races 6%
- Hispanic origin (detail)
- Mexican 2% Puerto Rican 3%
- Common ancestry
- Scotch-Irish 6% Subsaharan African 6% Romanian 1%
- Foreign-born
- 47% · China, Canada, Vietnam
- Languages at home
- 40% English-only · Russian/Polish/Slavic 22% Chinese 16% Spanish 6%
Political lean MEDSL · Kings
- 2024 margin
- Solid D (+44.0) · D 72.0% · R 28.0%
- 2008→2024 swing
- -15.5pp toward R · 2008: 59.4pp · 2024: 44.0pp
- All cycles
- 2024: D+44.0 2020: D+54.8 2016: D+61.8 2012: D+63.9 2008: D+59.4
Not yet ingested
- Civics
- —
Market trends
- HPI YoY
- ▼ -761.52%
- Current HPI
- 361.7011
- Rent YoY
- ▲ 15.81%
- Metro
- New York-Newark-Jersey City, NY-NJ-PA
- State GDP YoY
- ▲ 2.60%
- F500 in state
- 92
Industry mix (Fortune 500 HQ in NY)
| Industry | F500 HQs | Revenue |
|---|---|---|
| Financial Services | 10 | $950B |
|
||
| Consumer Goods | 9 | $162B |
|
||
| Insurance | 4 | $225B |
|
||
| Telecommunications | 2 | $144B |
|
||
| Pharmaceuticals | 2 | $112B |
|
||
| Media / Entertainment | 2 | $69B |
|
||
Price history
+1080.9% since first listed4 events — show timeline
- 2026-04-28 Relisted — BNYMLS
- 2026-01-19 Pending — BNYMLS
- 2025-11-20 Listed $1,299,000 BNYMLS
- 1983-11-01 Sold (Public Records) $110,000 Public Records
Property tax history
+5.5%/yrLatest (2025): $18,800 · +7.0% YoY. Source: county tax records.
Cash-flow waterfall
monthlySold comps — $/sqft
last 12 mo · ≤1 miLoading sold comps…