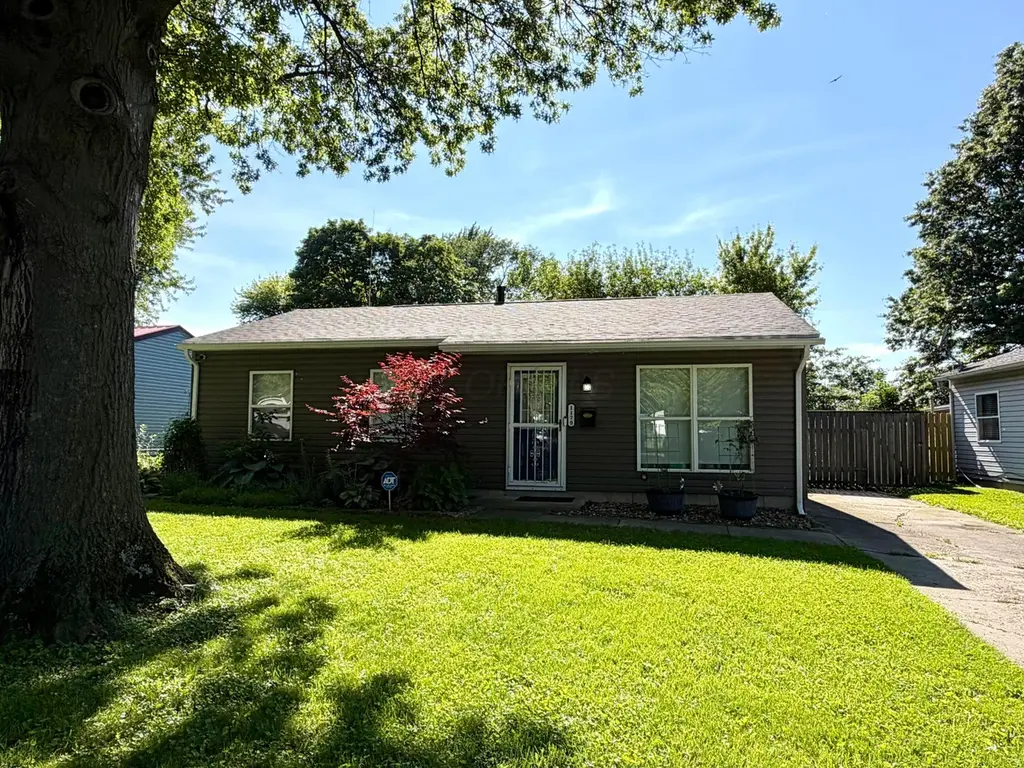
1179 Bermuda Dr · Marion, OH
Flood risk 1/10 · Minimal
- FEMA flood zone
- X (unshaded)
- Chance of flooding over 30 yrs
- 0.0%
- Est. flood insurance / yr
- $507 – $1,088
Fire risk 1/10 · Minimal
- Est. fire insurance / yr
- $713 – $1,323
Heat risk 3/10 · Minor
- Hot days now (above 98°F)
- 7 days/yr
- Hot days in 30 yrs
- 17 days/yr
Wind risk 2/10 · Minimal
- Chance of severe wind over 30 yrs
- 0.0%
Air-quality risk 2/10 · Minimal
- Unhealthy air days now
- 1 days/yr
- Unhealthy air days in 30 yrs
- 1 days/yr
Risk factors via First Street. Map © Google.
Why this score? — see what drove the D- grade
The composite is a weighted blend of 9 inputs, each scored 0–100. Each bar is that input's sub-score; the figure is the points it added to the 100-point composite (weight × sub-score).
- Cash flow +16.1/30.0
- DSCR +5.0/10.0
- 1% rule +3.4/10.0
- ARV discount +3.4/15.0
- Livability +3.2/5.0
- Rent growth +2.5/5.0
- Condition / age +2.5/5.0
- Schools +2.2/10.0
- Appreciation +0.0/10.0
$164,900
🖨 Deal sheet (PDF) 📄 Offer letter ✓ Due diligence
Listing remarks MLS
Price Reduced! Take a look at this newly remodeled 3 bedroom ranch with fenced-in yard, storage building, all new carpet and paint. The refrigerator, range, washer and window air conditioner is included in the sale of the home. Move-in condition! Owner/Agent; null
Key facts
- 6,098 sq ft lot
- Built 1974
- Listed 16 days
Property features AI
Exterior
- Utilities: Public water; Public sewer
- Home design: Single-family residence; One story; Built in 1974; No shared/common walls
- Construction: Slab foundation
- Exterior features: Fenced yard; Storage shed
Interior
- Bedrooms: Three main-level bedrooms
- Flooring: Carpet; Ceramic/Porcelain
- Bathrooms: One full bathroom
- Heating & cooling: Central air conditioning; Forced air heating
- Interior features: Insulated windows throughout
Neighborhood map
What this means for you Summary
Snapshot
- This is a 3-bed/1.0-bath single-family listed at $165k.
Deal economics
- At list price, monthly cash flow is $85 ($1k/yr) — positive.
- The deal already cash-flows at list — no discount required.
- To meet the 1% rule (rent ≥ 1% of price), the offer needs to be $139k (15.7% below list).
- Recommended offer: $139k (15.7% below list) — sets the bar for 1% rule.
Location & tenants
- Location reads 65/100 on livability (#704 in OH) — a middle-class / working-renter tenant base. Strengths: cost of living A+, housing A+; Watch: crime D+, amenities F, commute F.
- Marion City (town): math 22% / reading 31% proficiency, ranked #600 of 656 in OH (top 92%) — low school quality limits family demand, transient renter base, plan for 1-2y turnover; 67% free/reduced lunch — lower-income household profile, screen leases tightly.
- Zoned schools: William H. Taft Elementary School (math 17% / reading 31%, grade F, #1,231 of 1,584 statewide, top 78%, 394 students, 0% FRL); Ulysses S. Grant Middle School (math 22% / reading 25%, grade F, #597 of 654 statewide, top 92%, 998 students, 0% FRL); Harding High School (math 16% / reading 36%, grade F, #636 of 781 statewide, top 82%, 1,050 students, 0% FRL) — zoned schools average 0% FRL vs 67% district-wide (67 pts lower); this property's tenant base skews higher-income than the district average.
- Market conditions: 208 active listings in the ZIP; 53 units permitted in Marion County in 2024 (0 in 5+ unit buildings).
- This rent runs 30% of the median local income ($55k/yr) — at the standard rent-burdened threshold; future hikes will face affordability resistance.
Forward outlook
- Local home prices are declining (-3.0%/yr); year-one equity from $1k of loan paydown is wiped out by about $5k of value loss. Plan a longer hold.
- Marion County population projected at -18% by 2050 — secular population decline; favor cash flow + early exit over multi-decade hold.
Negotiation context
- It's been on market 16 days — a 2% lower offer ($162k) is reasonable based on typical stale-listing flexibility.
- 2 sale attempts since 20y ago; this cycle's ask is 126% above the opening price — seller raised mid-cycle; expect resistance to lowballs.
- Current owner paid $74k; list at $165k implies a 121% gain — meaningful room to come down on a strong offer.
Questions for the listing agent
- Built in 1974 — when were the roof, HVAC, electrical panel, plumbing, and water heater last replaced?
- Is there a deadline driving the sale (1031 exchange, divorce, estate, relocation)? That informs how much negotiation room exists.
- Schools are D-rated, which usually means shorter tenancies and higher turnover. Who's the typical renter profile here, and what's been the actual vacancy rate?
- Crime grade is D in this area — have there been break-ins, vandalism, or insurance claims at this property in the last 3 years? What carrier currently insures it and at what premium?
- The area grade is low — what's the realistic commute time and amenity access for the typical tenant pool here? Any planned neighborhood developments (good or bad) we should know about?
- What's the average days-on-market for RENTAL listings here right now (not sales)? A rising rental-DOM trend means longer vacancies and softer asking-rent achievability than the comps imply.
- What's the recent tenant-quality profile in this submarket — average credit score on applications, eviction rate, late-payment / NSF rate, and stable-employment percentage? A property-management company in the area should have these aggregated.
- How much new for-sale + rental construction is in the pipeline within 1–3 miles? Heavy new supply typically softens prices + rents 12–24 months out; constrained supply supports both.
Investment metrics
- 1% rule
- 0.84% ✗
- Cap rate
- 6.91%
- Cash-on-cash
- 2.21%
- DSCR
- 1.10
- GRM
- 9.9
CMA / ARV
- ARV (on-the-fly)
- $151,200
- Comps found
- 12
Show comp detail 12 sales within ~0.75 mi
| Address | Dist | Beds/Ba | Sqft | Sold | Price | $/sf | Match |
|---|---|---|---|---|---|---|---|
| 668 Easy St | 0.04mi | 3/1.0 | 900 (0%) | 2mo | $125,000 | $139 | 97 |
| 607 Easy St | 0.15mi | 3/1.0 | 900 (0%) | 2mo | $144,900 | $161 | 91 |
| 1109 Barbados Ave | 0.19mi | 3/1.0 | 925 (+3%) | 4mo | $100,000 | $108 | 83 |
| 954 Bermuda Dr | 0.33mi | 3/1.0 | 900 (0%) | 6mo | $142,500 | $158 | 80 |
| 485 Bahama Cir | 0.34mi | 3/1.0 | 900 (0%) | 7mo | $158,000 | $176 | 78 |
| 1205 Fairwood Ave | 0.48mi | 3/1.0 | 900 (0%) | 3mo | $159,900 | $178 | 75 |
| 1048 Fairwood Ave | 0.45mi | 4/1.0 (+1) | 900 (0%) | 4mo | $175,000 | $194 | 70 |
| 935 Richmond Ave | 0.52mi | 3/1.0 | 925 (+3%) | 6mo | $129,900 | $140 | 66 |
| 966 Bikini Dr | 0.42mi | 3/1.0 | 952 (+6%) | 7mo | $172,000 | $181 | 65 |
| 537 Fair Park Ave | 0.64mi | 2/1.0 (-1) | 864 (-4%) | 2mo | $120,000 | $139 | 57 |
| 721 Robinson St | 0.73mi | 3/1.0 | 864 (-4%) | 4mo | $159,900 | $185 | 56 |
| 396 Lynn Dr | 0.69mi | 3/1.0 | 952 (+6%) | 5mo | $159,900 | $168 | 54 |
Match score weights: distance 35% · size 25% · config 20% · recency 20%. Top-matched comps best support the ARV.
Projected returns pro-forma
-3.0% appreciation · 3.0% rent growth · sell at horizon
- IRR
- -12.8%
- Equity multiple
- 0.54×
- Total profit
- $-21,371
- Equity at exit
- $24,587
- IRR
- -3.9%
- Equity multiple
- 0.74×
- Total profit
- $-11,876
- Equity at exit
- $14,258
Cash invested: $46,172 (down + closing). Projections, not guarantees.
Landlord ↔ Tenant lean methodology
- Overall (STATE)
- 73 Landlord-Friendly
- State Ohio
- 73 Landlord-Friendly · R+6
- County
- — inherits STATE
- City
- — inherits STATE
ZIP-level market 43302
- Home prices YoY
- -33.9%
- Active inventory
- 208
- Price-to-rent
- 9.9×
Monthly cashflow live
- Estimated rent
- $1,391 medium interval (Pro) →
- Mortgage (P&I)
- −$865
- Tax from tax record
- −$80 /mo · $963/yr
- Insurance
- −$69
- HOA
- −$0
- Vacancy / Maint / Mgmt
- −$292
- Net cashflow
- $85
Break-even live
Sensitivity live
| Price | -10% $178 | -5% $132 | +0% $85 | +5% $38 | +10% $-8 |
|---|---|---|---|---|---|
| Rent | -10% $-25 | -5% $30 | +0% $85 | +5% $140 | +10% $195 |
| Rate | -1.0pp $168 | -0.5pp $127 | base $85 | +0.5pp $42 | +1.0pp $-1 |
UW: 25.0% down · 7.5% · 30yr · 1.5% tax · 5.0% vac · 8.0% maint · 8.0% mgmt
Financing live
Cash to close
- Down payment
- $41,225
- Closing costs
- $4,947
- Reserves months
- —
- Total cash needed
- —
Loan-product check · same deal, 3 products live
Conventional
25% down · 7.5% · 30yr
- Down + closing
- —
- Monthly P&I
- —
- Monthly cashflow
- —
- DSCR
- —
- Eligible?
- —
Personal DTI + credit; lowest rate.
DSCR
20% down · 8.5% · 30yr
- Down + closing
- —
- Monthly P&I
- —
- Monthly cashflow
- —
- DSCR
- —
- Eligible?
- —
No personal income docs; deal must DSCR.
Hard money
10% down · 12.0% · 12mo
- Down + closing
- —
- Monthly P&I
- —
- Monthly cashflow
- —
- DSCR
- —
- Eligible?
- —
Short-term bridge; refi at stabilization.
Listing history 16 events
-
2026-06-21days on market $164,900 Active 16 DOM
-
2026-06-19days on market $164,900 Active 14 DOM
-
2026-06-18days on market $164,900 Active 13 DOM
-
2026-06-17days on market $164,900 Active 12 DOM
-
2026-06-16days on market $164,900 Active 11 DOM
-
2026-06-15days on market $164,900 Active 10 DOM
-
2026-06-14days on market $164,900 Active 8 DOM
-
2026-06-12days on market $164,900 Active 7 DOM
-
2026-06-09days on market $164,900 Active 4 DOM
-
2026-06-08days on market $164,900 Active 3 DOM
-
2026-06-07statusdays on market $164,900 Active 2 DOM
-
2026-06-05days on market $164,900 Coming Soon 5 DOM
-
2026-06-03days on market $164,900 Coming Soon 4 DOM
-
2026-06-02days on market $164,900 Coming Soon 3 DOM
-
2026-06-01days on market $164,900 Coming Soon 2 DOM
-
2026-05-30$164,900 Coming Soon 1 DOM
ⓘ Source: listings_history table (triggers on properties + properties_extension) + one-shot
backfill from property_details.listing_events for pre-trigger history.
Tax reassessment forecast OH · Partial reset (capped growth)
- Current annual tax
- $963 · $80/mo
- Projected year-2 tax
- $1,768 · $147/mo
- Expected delta
- +$805/yr (+$67/mo · 83.5%)
ⓘ Screening estimate from a state-policy table — verify with the county assessor before closing.
Climate risk First Street
- Flood 1/10 Low FEMA zone X (unshaded) · 0% chance over 30 yrs
- Wildfire 1/10 Low
- Heat 3/10 Moderate 7 d/yr ≥98°F today · 17 d/yr by 30 yrs out
- Wind 2/10 Low 0% chance of damaging wind over 30 yrs
- Air quality 2/10 Low 1 unhealthy d/yr today · 1 by 30 yrs out
Nearby sold comps map
Loading sold comps map…
Walkable amenities ~0.75 mi
Loading nearby amenities…
Taxation est. · year 1
- Rental income
- $16,688
- − Mortgage interest
- −$9,237
- − Property taxes
- −$963
- − Insurance
- −$824
- − Repairs & maintenance
- −$1,335
- − Management
- −$1,335
- − Depreciation
- −$4,797
- Taxable loss
- −$1,804
- Est. tax savings @ 24.0%
- +$433
- After-tax cash flow
- $1,452/yr
For passive investors: Depreciation is non-cash, so a rental often shows a tax loss while cash-flowing — sheltering income. Rental losses are passive: they offset passive income freely, and up to $25,000/yr can offset ordinary (W-2) income if you actively participate and your MAGI is under $100k (phasing out to $0 by $150k); unused losses carry forward. On sale, claimed depreciation is recaptured at up to 25%, and gains may owe capital-gains tax (a 1031 exchange can defer both). Figures are a year-1 estimate at your 24.0% rate — not tax advice; consult a CPA.
Schools (NCES district)
- District
- Marion City
- NCES district ID
- 3904433
- Math proficiency
- 22% ▼ -17.00%
- Reading proficiency
- 31% ▼ -8.00%
- Median HH income
- $32,327
- Composite
- 21.58/100
- National rank
- #8306
- State rank
- #600 of 656 in OH
Livability — Marion
- Score
- 65/100
- State rank
- #704
- US rank
- #12605
Category grades
Schools grade is shown separately in the Schools card above.
Census & demographics
- Census place
- Marion, OH
- County
- Marion County · 53,702 people
- City population
- 53,702
- Metro
- Marion, OH
- Population (ZIP)
- 53,702
- Household income
- $55,057
- Rent vs Own
- Severe rent burden
- 1554.0
Population outlook (Marion County) Hauer SSP2
- Today (2025)
- 62,078 people
- By 2030
- 60,049 · -3.3%
- By 2040
- 55,413 · -10.7%
- By 2050
- 50,604 · -18.5%
- By 2075
- 40,162 · -35.3%
- By 2100
- 29,105 · -53.1%
Race, ethnicity, and origin ACS 2023
- Neighborhood character
- Predominantly White (85%)
- Race & ethnicity
- White 85% Black 6% Two or more races 6% Hispanic / Latino 3%
- Common ancestry
- Slovak 2% Romanian 2% Lithuanian 2%
- Foreign-born
- 2% · Canada
- Languages at home
- 96% English-only · Spanish 2% Arabic 1%
Political lean MEDSL · Marion
- 2024 margin
- Solid R (+41.4) · D 28.9% · R 70.3%
- 2008→2024 swing
- -32.5pp toward R · 2008: -8.9pp · 2024: -41.4pp
- All cycles
- 2024: R+41.4 2020: R+38.6 2016: R+34.4 2012: R+7.6 2008: R+8.9
Not yet ingested
- Civics
- —
Market trends
- HPI YoY
- ▼ -114.52%
- Current HPI
- 223.5344
- Rent YoY
- —
- Metro
- Marion, OH
- State GDP YoY
- ▲ 1.98%
- F500 in state
- 48
Industry mix (Fortune 500 HQ in OH)
| Industry | F500 HQs | Revenue |
|---|---|---|
| Insurance | 3 | $145B |
|
||
| Industrial Machinery | 3 | $49B |
|
||
| Financial Services | 3 | $24B |
|
||
| Consumer Goods | 2 | $93B |
|
||
| Aerospace / Defense | 2 | $47B |
|
||
| Utilities | 2 | $33B |
|
||
Price history
+199.8% since first listed9 events — show timeline
- 2026-05-30 Coming Soon $164,900 CBRMLS
- 2019-12-19 Sold (Public Records) $74,500 Public Records
- 2019-12-12 Sold (MLS) $74,500 CBRMLS
- 2019-12-12 Listing Removed — CBRMLS
- 2019-10-17 Listed $73,000 CBRMLS
- 2006-10-01 Listing Removed — CBRMLS
- 2006-08-15 Listed $69,900 CBRMLS
- 2002-07-08 Sold (Public Records) $55,000 Public Records
- 2002-07-08 Sold (Public Records) $55,000 Public Records
Property tax history
+4.5%/yrLatest (2025): $963 · +0.0% YoY. Source: county tax records.
Cash-flow waterfall
monthlySold comps — $/sqft
last 12 mo · ≤1 miLoading sold comps…