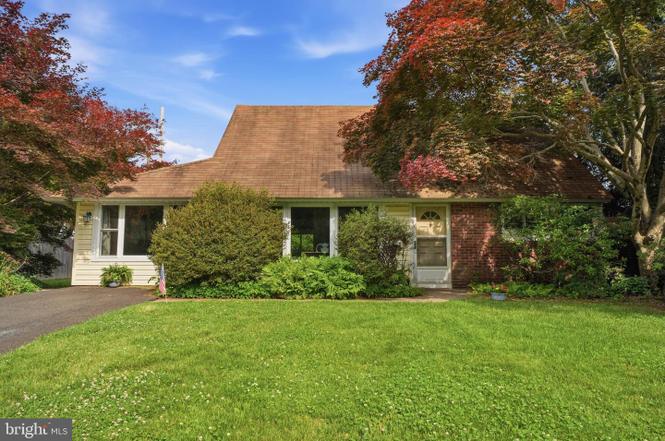
58 Trail Rd · Fairless Hills, PA
Flood risk 1/10 · Minimal
- FEMA flood zone
- X (unshaded)
- Chance of flooding over 30 yrs
- 0.0%
- Est. flood insurance / yr
- $507 – $1,088
Fire risk 1/10 · Minimal
- Est. fire insurance / yr
- $511 – $949
Heat risk 6/10 · Moderate
- Hot days now (above 102°F)
- 7 days/yr
- Hot days in 30 yrs
- 15 days/yr
Wind risk 6/10 · Moderate
- Chance of severe wind over 30 yrs
- 27.0%
Air-quality risk 5/10 · Moderate
- Unhealthy air days now
- 7 days/yr
- Unhealthy air days in 30 yrs
- 8 days/yr
Risk factors via First Street. Map © Google.
Why this score? — see what drove the C grade
The composite is a weighted blend of 9 inputs, each scored 0–100. Each bar is that input's sub-score; the figure is the points it added to the 100-point composite (weight × sub-score).
- Cash flow +18.4/30.0
- ARV discount +15.0/15.0
- DSCR +5.8/10.0
- 1% rule +4.8/10.0
- Schools +4.5/10.0
- Livability +4.0/5.0
- Rent growth +2.5/5.0
- Condition / age +2.5/5.0
- Appreciation +0.0/10.0
$350,000
🖨 Deal sheet 📄 Offer letter ✓ Due diligence
Listing remarks
Welcome to this light-filled, beautifully expanded home, where classic open plan design meets modern family needs. Step inside to a bright and airy living room featuring a newer picture window that fills the space with natural light and offers a panoramic view of the front yard. As an added bonus, an open green space located directly across the street provides an enhanced sense of privacy and a scenic outlook. The living room opens to the kitchen and dining area for your convenience. The original garage has been professionally converted into a bright and versatile family room, creating the perfect space for relaxing, entertaining, working from home, o
Key facts
- Panoramic view
- Newer picture window
- High ceilings
Tags
Property features AI
Exterior
- Parking: Driveway with two parking spaces; On-street parking available; Two total garage and parking spaces
- Utilities: Public water; Public sewer; Municipal trash service; Above-ground utilities; S/W changeover hot water
- Home design: Detached structure; Shingle roof; Frame construction; Slab foundation
- Construction: Built year per assessor; Frame construction; Shingle roof; Slab foundation
- Exterior features: Lot approximately 70 x 100; Ground rent paid annually; Above-grade and below-grade structures noted
Interior
- Bedrooms: Two bedrooms on the main level; Two bedrooms on the first upper level
- Bathrooms: One full bathroom on the main level; One full bathroom on the first upper level; Two full bathrooms total
- Heating & cooling: Baseboard hot water heating (oil fuel); Central air conditioning (electric)
- Interior features: Living room; Dining room; Family room; Screened porch; Property not in a federal flood zone; No basement
Neighborhood map
What this means for you Summary
Snapshot
- This is a 4-bed/2.0-bath single-family listed at $350k.
Deal economics
- At list price, monthly cash flow is $326 ($4k/yr) — positive.
- The deal already cash-flows at list — no discount required.
- To meet the 1% rule (rent ≥ 1% of price), the offer needs to be $345k (1.5% below list).
- Recommended offer: $345k (1.5% below list) — sets the bar for 1% rule.
- Cap rate 7.4% vs local median 4.5% in Fairless Hills — top-decile yield for the area; either an underpriced asset or a hidden risk that comps aren't pricing in. Stress-test before assuming the spread holds.
Location & tenants
- Location reads 80/100 on livability (#205 in PA, #1,823 nationally) — a professional / high-income tenant draw. Strengths: housing A+, health & safety A+, crime A; Watch: amenities F, commute F.
- Neshaminy SD (suburban): math 41% / reading 57% proficiency, ranked #150 of 539 in PA (top 28%) — families likely to look elsewhere, expect single-tenant / working-renter base with shorter leases; only 19% free/reduced lunch — higher-income household profile.
- Market conditions: 31 active listings in the ZIP; 3 comparable units currently listed for rent nearby; rentals leasing fast (median 1d on market — plan ~1-2 weeks tenant-placement turnaround); high-income renter base; 663 units permitted in Bucks County in 2024 (106 in 5+ unit buildings).
- This rent runs 37% of the median local income ($112k/yr) — at the standard rent-burdened threshold; future hikes will face affordability resistance.
Forward outlook
- Local home prices are declining (-3.0%/yr); year-one equity from $2k of loan paydown is wiped out by about $10k of value loss. Plan a longer hold.
- Bucks County population projected to shrink 7% by 2050 — rents likely to lag national; underwrite the cash flow, not the appreciation.
Negotiation context
- Only 2 days on market — expect competitive offers; lowballing is unlikely to land.
Risks & watch-outs
- Watch-outs: built in 1958 — expect roof / HVAC / electrical / plumbing capex.
- Climate carrying-cost: major wind risk, 27% chance of damaging wind over 30y; extreme-heat days projected 7→15/yr by 2055 (HVAC capex compounding) — expect insurance premiums to compound above CPI over the hold.
Questions for the listing agent
- Built in 1958 — when were the roof, HVAC, electrical panel, plumbing, and water heater last replaced?
- Is there a deadline driving the sale (1031 exchange, divorce, estate, relocation)? That informs how much negotiation room exists.
- Schools are B-rated — typically a magnet for longer-tenancy family renters. What's the average tenant stay here, and is there a school-zone premium baked into asking?
- What's the average days-on-market for RENTAL listings here right now (not sales)? A rising rental-DOM trend means longer vacancies and softer asking-rent achievability than the comps imply.
- What's the recent tenant-quality profile in this submarket — average credit score on applications, eviction rate, late-payment / NSF rate, and stable-employment percentage? A property-management company in the area should have these aggregated.
- How much new for-sale + rental construction is in the pipeline within 1–3 miles? Heavy new supply typically softens prices + rents 12–24 months out; constrained supply supports both.
Investment metrics
- 1% rule
- 0.98% ✗
- Cap rate
- 7.41%
- Cash-on-cash
- 3.99%
- DSCR
- 1.18
- GRM
- 8.5
CMA / ARV
- ARV (on-the-fly)
- $451,050
- Comps found
- 12
Show comp detail 12 sales within ~0.75 mi
| Address | Dist | Beds/Ba | Sqft | Sold | Price | $/sf | Match |
|---|---|---|---|---|---|---|---|
| 46 Trail Rd | 0.04mi | 4/2.0 | 1,550 (0%) | 0mo | $350,000 | $226 | 98 |
| 17 Tulip Tree Rd | 0.34mi | 4/2.0 | 1,597 (+3%) | 3mo | $250,000 | $157 | 77 |
| 12 Tulip Tree Rd | 0.30mi | 4/2.0 | 1,569 (+1%) | 9mo | $465,000 | $296 | 76 |
| 43 Tweed Rd | 0.18mi | 3/2.5 (-1) | 1,632 (+5%) | 3mo | $475,000 | $291 | 74 |
| 55 Terrace Rd | 0.34mi | 3/2.5 (-1) | 1,564 (+1%) | 9mo | $465,000 | $297 | 68 |
| 109 Blough Rd | 0.49mi | 3/2.0 (-1) | 1,692 (+9%) | 2mo | $481,000 | $284 | 55 |
| 127 Hedge Rd | 0.50mi | 5/2.0 (+1) | 1,730 (+12%) | 1mo | $383,000 | $221 | 51 |
| 215 Blough Ct | 0.61mi | 3/1.0 (-1) | 1,680 (+8%) | 3mo | $390,000 | $232 | 46 |
| 429 Stanford Rd | 0.71mi | 4/2.5 | 1,645 (+6%) | 10mo | $490,000 | $298 | 46 |
| 204 Suffolk Rd | 0.55mi | 3/1.0 (-1) | 1,416 (-9%) | 12mo | $415,000 | $293 | 41 |
| 89 Harrow Rd | 0.65mi | 4/2.0 | 1,350 (-13%) | 11mo | $471,000 | $349 | 40 |
| 402 Stanford Rd | 0.71mi | 3/2.5 (-1) | 1,762 (+14%) | 8mo | $475,000 | $270 | 30 |
Match score weights: distance 35% · size 25% · config 20% · recency 20%. Top-matched comps best support the ARV.
Projected returns pro-forma
-3.0% appreciation · 3.0% rent growth · sell at horizon
- IRR
- -10.0%
- Equity multiple
- 0.63×
- Total profit
- $-35,921
- Equity at exit
- $52,186
- IRR
- -0.6%
- Equity multiple
- 0.96×
- Total profit
- $-4,396
- Equity at exit
- $30,262
Cash invested: $98,000 (down + closing). Projections, not guarantees.
Landlord ↔ Tenant lean methodology
- Overall (STATE)
- 62 Landlord-Friendly
- State Pennsylvania
- 62 Landlord-Friendly · EVEN
- County
- — inherits STATE
- City
- — inherits STATE
ZIP-level market 19056
- Active inventory
- 31
- Price-to-rent
- 8.5×
Monthly cashflow live
- Estimated rent
- $3,447 medium interval (Pro) →
- Mortgage (P&I)
- −$1,835
- Tax from tax record
- −$416 /mo · $4,987/yr
- Insurance
- −$146
- HOA
- −$0
- Vacancy / Maint / Mgmt
- −$724
- Net cashflow
- $326
Break-even live
UW: 25.0% down · 7.5% · 30yr · 1.5% tax · 5.0% vac · 8.0% maint · 8.0% mgmt
Financing live
Cash to close
- Down payment
- $87,500
- Closing costs
- $10,500
- Reserves months
- —
- Total cash needed
- —
Loan-product check · same deal, 3 products live
Conventional
25% down · 7.5% · 30yr
- Down + closing
- —
- Monthly P&I
- —
- Monthly cashflow
- —
- DSCR
- —
- Eligible?
- —
Personal DTI + credit; lowest rate.
DSCR
20% down · 8.5% · 30yr
- Down + closing
- —
- Monthly P&I
- —
- Monthly cashflow
- —
- DSCR
- —
- Eligible?
- —
No personal income docs; deal must DSCR.
Hard money
10% down · 12.0% · 12mo
- Down + closing
- —
- Monthly P&I
- —
- Monthly cashflow
- —
- DSCR
- —
- Eligible?
- —
Short-term bridge; refi at stabilization.
Rent comps 3 comps
| Address | Beds | Baths | Sqft | Rent | $/sqft | DOM | Units | Dist |
|---|---|---|---|---|---|---|---|---|
| 200 Middletown Blvd Langhorne, PA | 1.0–3.0 | 1.0–2.0 | 1077 | $4,059 | $3.77 | 1d | 84 | 0.70mi |
| 153 Mercer Ct Fairless Hills, PA | 3.0 | 2.5 | 1848 | $3,500 | $1.89 | 1d | 1 | 0.86mi |
| 100 Harpers Xing Langhorne, PA | 1.0–3.0 | 1.0–2.0 | 1071 | $3,295 | $3.08 | 1d | 29 | 1.45mi |
Listing history 6 events
-
2026-06-18days on market $350,000 Active 2 DOM
-
2026-06-17statusdays on market $350,000 Active 1 DOM
-
2026-06-16days on market $350,000 Coming Soon 5 DOM
-
2026-06-15days on market $350,000 Coming Soon 4 DOM
-
2026-06-13remarks 669-char remark
-
2026-06-13$350,000 Coming Soon 2 DOM
ⓘ Source: listings_history table (triggers on properties + properties_extension) + one-shot
backfill from property_details.listing_events for pre-trigger history.
Tax reassessment forecast PA · Partial reset (capped growth)
- Current annual tax
- $4,987 · $416/mo
- Projected year-2 tax
- $5,259 · $438/mo
- Expected delta
- +$271/yr (+$23/mo · 5.4%)
ⓘ Screening estimate from a state-policy table — verify with the county assessor before closing.
Climate risk First Street
- Flood 1/10 Low FEMA zone X (unshaded) · 0% chance over 30 yrs
- Wildfire 1/10 Low
- Heat 6/10 Major 7 d/yr ≥102°F today · 15 d/yr by 30 yrs out
- Wind 6/10 Major 27% chance of damaging wind over 30 yrs
- Air quality 5/10 Major 7 unhealthy d/yr today · 8 by 30 yrs out
Nearby sold comps map
Loading sold comps map…
Walkable amenities ~0.75 mi
Loading nearby amenities…
Taxation est. · year 1
- Rental income
- $41,358
- − Mortgage interest
- −$19,605
- − Property taxes
- −$4,987
- − Insurance
- −$1,750
- − Repairs & maintenance
- −$3,309
- − Management
- −$3,309
- − Depreciation
- −$10,182
- Taxable loss
- −$1,783
- Est. tax savings @ 24.0%
- +$428
- After-tax cash flow
- $4,339/yr
For passive investors: Depreciation is non-cash, so a rental often shows a tax loss while cash-flowing — sheltering income. Rental losses are passive: they offset passive income freely, and up to $25,000/yr can offset ordinary (W-2) income if you actively participate and your MAGI is under $100k (phasing out to $0 by $150k); unused losses carry forward. On sale, claimed depreciation is recaptured at up to 25%, and gains may owe capital-gains tax (a 1031 exchange can defer both). Figures are a year-1 estimate at your 24.0% rate — not tax advice; consult a CPA.
Schools (NCES district)
- District
- Neshaminy SD
- NCES district ID
- 4216410
- Math proficiency
- 41% ▼ -10.00%
- Reading proficiency
- 57% ▼ -14.00%
- Median HH income
- $78,072
- Composite
- 44.58/100
- National rank
- #2782
- State rank
- #150 of 539 in PA
Livability — Fairless Hills
- Score
- 80/100
- State rank
- #205
- US rank
- #1823
Category grades
Schools grade is shown separately in the Schools card above.
Census & demographics
- County
- Bucks County · 506,477 people
- City population
- 12,305
- Metro
- Philadelphia-Camden-Wilmington, PA-NJ-DE-MD
- Population (ZIP)
- 15,960
- Household income
- $111,594
- Rent vs Own
- Severe rent burden
- 406.0
Population outlook (Bucks County) Hauer SSP2
- Today (2025)
- 630,973 people
- By 2030
- 627,093 · -0.6%
- By 2040
- 609,680 · -3.4%
- By 2050
- 584,225 · -7.4%
- By 2075
- 539,840 · -14.4%
- By 2100
- 483,970 · -23.3%
Race, ethnicity, and origin ACS 2023
- Neighborhood character
- Predominantly White (75%)
- Race & ethnicity
- White 75% Hispanic / Latino 10% Two or more races 8% Black 7% Asian 3%
- Hispanic origin (detail)
- Mexican 3% Puerto Rican 5%
- Common ancestry
- Romanian 7% Scotch-Irish 2% Swiss 1%
- Foreign-born
- 6% · Canada
- Languages at home
- 89% English-only · Spanish 4% Other Asian/Pacific 2% Other Indo-European 2%
Political lean MEDSL · Bucks
- 2024 margin
- Toss-up / Even · D 49.5% · R 49.5%
- 2008→2024 swing
- -8.7pp toward R · 2008: 8.7pp · 2024: -0.1pp
- All cycles
- 2024: R+0.1 2020: D+4.4 2016: D+0.6 2012: D+1.2 2008: D+8.7
Not yet ingested
- Civics
- —
Market trends
- HPI YoY
- ▼ -208.54%
- Current HPI
- 309.3854
- Rent YoY
- —
- Metro
- Philadelphia-Camden-Wilmington, PA-NJ-DE-MD
- State GDP YoY
- ▲ 1.68%
- F500 in state
- 34
Industry mix (Fortune 500 HQ in PA)
| Industry | F500 HQs | Revenue |
|---|---|---|
| Healthcare | 2 | $309B |
|
||
| Insurance | 2 | $27B |
|
||
| Telecommunications / Media | 1 | $124B |
|
||
| Industrial Distribution | 1 | $22B |
|
||
| Financial Services | 1 | $20B |
|
||
| Chemicals / Materials | 1 | $18B |
|
||
Price history
1 event — show timeline
- 2026-06-11 Coming Soon $350,000 BRIGHT MLS
Property tax history
+1.5%/yrLatest (2026): $4,987 · +7.2% YoY. Source: county tax records.
Cash-flow waterfall
monthlySold comps — $/sqft
last 12 mo · ≤1 miLoading sold comps…