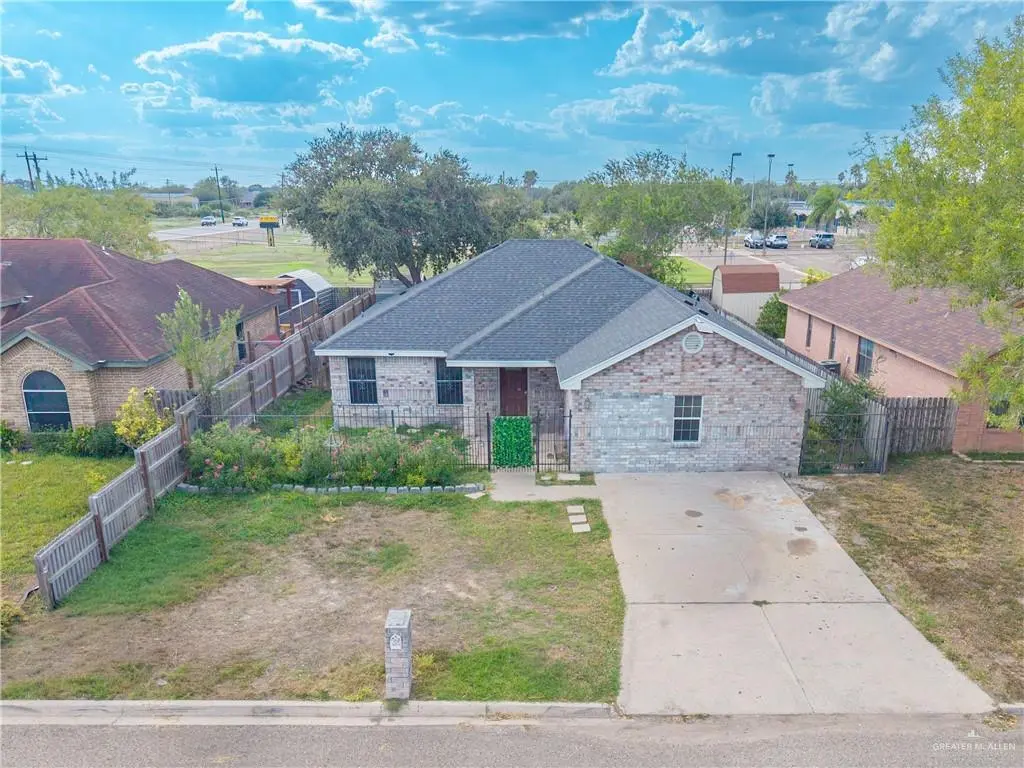
2811 N Edison Rd · Edinburg, TX
Flood risk 1/10 · Minimal
- FEMA flood zone
- X (shaded)
- Chance of flooding over 30 yrs
- 0.0%
- Est. flood insurance / yr
- $507 – $1,088
Fire risk 7/10 · Major
- Est. fire insurance / yr
- $1,222 – $2,270
Heat risk 9/10 · Severe
- Hot days now (above 112°F)
- 7 days/yr
- Hot days in 30 yrs
- 22 days/yr
Wind risk 8/10 · Major
- Chance of severe wind over 30 yrs
- 99.0%
Air-quality risk 2/10 · Minimal
- Unhealthy air days now
- 0 days/yr
- Unhealthy air days in 30 yrs
- 1 days/yr
Risk factors via First Street. Map © Google.
Why this score? — see what drove the D+ grade
The composite is a weighted blend of 9 inputs, each scored 0–100. Each bar is that input's sub-score; the figure is the points it added to the 100-point composite (weight × sub-score).
- ARV discount +14.8/15.0
- Cash flow +11.0/30.0
- 1% rule +5.1/10.0
- DSCR +3.2/10.0
- Livability +3.2/5.0
- Rent growth +3.0/5.0
- Condition / age +2.5/5.0
- Schools +2.2/10.0
- Appreciation +0.0/10.0
$175,000
🖨 Deal sheet (PDF) 📄 Offer letter ✓ Due diligence
Listing remarks MLS
Welcome to this wonderful detached 4 bedroom, 2 bathroom home offering 1,880 square feet of flexible living space. This is a great starter home, perfect for those looking to put their personal touch on a property with lots of potential. Located close to excellent schools and just a few miles from the university, it's ideal for families and students alike. Enjoy easy commutes with the expressway nearby, making your daily travel a breeze. With some TLC, this house can become your dream home. Don’t miss out on this fantastic opportunity!
Key facts
- 7,204 sq ft lot
- Built 2003
- Listed 244 days
Neighborhood map
What this means for you Summary
Snapshot
- This is a 3-bed/2.0-bath single-family listed at $175k.
Deal economics
- At list price, monthly cash flow is $-73 ($-877/yr) — negative.
- To cash-flow at today's rent, offer at most $162k (7.4% below list).
- Meets the 1% rule at list price ($2k rent vs $175k).
- Recommended offer: $154k (12.0% below list) — sets the bar for market timing.
- Cap rate 5.8% vs local median 2.4% in Edinburg — top-decile yield for the area; either an underpriced asset or a hidden risk that comps aren't pricing in. Stress-test before assuming the spread holds.
Location & tenants
- Location reads 64/100 on livability (#784 in TX) — a middle-class / working-renter tenant base. Strengths: cost of living A+, housing A+; Watch: schools D+, employment D, amenities F.
- Edinburg CISD (urban): math 20% / reading 34% proficiency, ranked #699 of 826 in TX (top 85%) — low school quality limits family demand, transient renter base, plan for 1-2y turnover; 62% free/reduced lunch — lower-income household profile, screen leases tightly.
- Market conditions: Rents rising (+2.0%/yr); 523 active listings in the ZIP; 10 comparable units currently listed for rent nearby; rentals lingering (median 45d on market — plan ~5-8 weeks vacancy on turnover, expect pricing pressure); 60% of comp listings sitting > 30 days — soft ceiling on asking rent; 7,378 units permitted in Hidalgo County in 2024 (641 in 5+ unit buildings).
- This rent runs 40% of the median local income ($53k/yr) — at the standard rent-burdened threshold; future hikes will face affordability resistance.
Forward outlook
- Local home prices are declining (-3.0%/yr); year-one equity from $1k of loan paydown is wiped out by about $5k of value loss. Plan a longer hold.
- Hidalgo County population projected at +28% by 2050 — long-run rental-demand tailwind backs the buy-and-hold thesis.
Negotiation context
- It's been on market 245 days — a 12% lower offer ($154k) is reasonable based on typical stale-listing flexibility.
Risks & watch-outs
- Watch-outs: property tax is 3.3% of price.
- Climate carrying-cost: severe wind risk, 99% chance of damaging wind over 30y; major wildfire risk; extreme-heat days projected 7→22/yr by 2055 (HVAC capex compounding) — expect insurance premiums to compound above CPI over the hold.
Questions for the listing agent
- What do current leases actually rent for vs. the listed asking? Can we see a recent rent roll and the last 12 months of T-12 income?
- It's been on market 245 days. Have you received any prior offers? Is the seller open to a 12% concession, seller financing, or rate buy-down credit?
- Property tax is high relative to price — has the assessment been appealed recently, and will the sale trigger a re-assessment?
- Why hasn't it sold? Are there any deal-killer items the seller is aware of (foundation, flood, title, zoning, code violations)?
- Is there a deadline driving the sale (1031 exchange, divorce, estate, relocation)? That informs how much negotiation room exists.
- Schools are D-rated, which usually means shorter tenancies and higher turnover. Who's the typical renter profile here, and what's been the actual vacancy rate?
- The area grade is low — what's the realistic commute time and amenity access for the typical tenant pool here? Any planned neighborhood developments (good or bad) we should know about?
- What's the average days-on-market for RENTAL listings here right now (not sales)? A rising rental-DOM trend means longer vacancies and softer asking-rent achievability than the comps imply.
- What's the recent tenant-quality profile in this submarket — average credit score on applications, eviction rate, late-payment / NSF rate, and stable-employment percentage? A property-management company in the area should have these aggregated.
- How much new for-sale + rental construction is in the pipeline within 1–3 miles? Heavy new supply typically softens prices + rents 12–24 months out; constrained supply supports both.
Investment metrics
- 1% rule
- 1.01% ✓
- Cap rate
- 5.79%
- Cash-on-cash
- -1.79%
- DSCR
- 0.92
- GRM
- 8.3
CMA / ARV
- ARV (median comp)
- $208,709
- List price
- $175,000
- Delta
- -16.15%
- Verdict
- UNDERPRICED
- Comps
- 20 within 1.0 mi
Show comp detail 12 sales within ~0.75 mi
| Address | Dist | Beds/Ba | Sqft | Sold | Price | $/sf | Match |
|---|---|---|---|---|---|---|---|
| 2811 N Edison Rd | 0.00mi | 4/2.0 (+1) | 1,880 (0%) | 1mo | $175,000 | $93 | 94 |
| 938 W Star Flower St | 0.28mi | 3/2.5 | 1,859 (-1%) | 9mo | $313,990 | $169 | 76 |
| 2804 N Alyna Ave | 0.42mi | 3/2.5 | 1,847 (-2%) | 7mo | $315,000 | $171 | 70 |
| 2921 Alyna Ave | 0.46mi | 3/2.5 | 1,880 (0%) | 10mo | $320,000 | $170 | 68 |
| 1306 Denver St | 0.54mi | 3/2.0 | 1,830 (-3%) | 9mo | $214,000 | $117 | 63 |
| 1024 W Star Flower St | 0.45mi | 3/2.5 | 1,693 (-10%) | 3mo | $297,990 | $176 | 58 |
| 3100 N Alyna Ave | 0.44mi | 4/2.5 (+1) | 1,966 (+5%) | 8mo | $299,000 | $152 | 58 |
| 1028 W Ramses Ln | 0.56mi | 3/2.5 | 2,005 (+7%) | 7mo | $335,000 | $167 | 55 |
| 323 Glasscock Ave | 0.55mi | 3/2.5 | 1,600 (-15%) | 8mo | $289,000 | $181 | 41 |
| 318 Central Park St | 0.74mi | 4/2.0 (+1) | 1,673 (-11%) | 4mo | $285,000 | $170 | 39 |
| 2201 N Woody St | 0.63mi | 3/3.0 | 1,628 (-13%) | 7mo | $339,000 | $208 | 38 |
| 313 Olympic St | 0.69mi | 4/2.0 (+1) | 1,657 (-12%) | 10mo | $305,000 | $184 | 35 |
Match score weights: distance 35% · size 25% · config 20% · recency 20%. Top-matched comps best support the ARV.
Projected returns pro-forma
-3.0% appreciation · 2.01% rent growth · sell at horizon
- IRR
- -20.5%
- Equity multiple
- 0.29×
- Total profit
- $-34,570
- Equity at exit
- $26,093
- IRR
- -16.3%
- Equity multiple
- 0.14×
- Total profit
- $-42,353
- Equity at exit
- $15,131
Cash invested: $49,000 (down + closing). Projections, not guarantees.
Landlord ↔ Tenant lean methodology
- Overall (STATE)
- 87 Strongly Landlord-Friendly
- State Texas
- 87 Strongly Landlord-Friendly · R+5
- County
- — inherits STATE
- City
- — inherits STATE
ZIP-level market 78541
- Home prices YoY
- -7.6%
- Rents YoY
- 2.0%
- Active inventory
- 523
- Price-to-rent
- 8.3×
Monthly cashflow live
- Estimated rent
- $1,767 high interval (Pro) →
- Mortgage (P&I)
- −$918
- Tax from tax record
- −$478 /mo · $5,739/yr
- Insurance
- −$73
- HOA
- −$0
- Vacancy / Maint / Mgmt
- −$371
- Net cashflow
- $-73
Break-even live
Sensitivity live
| Price | -10% $26 | -5% $-24 | +0% $-73 | +5% $-123 | +10% $-172 |
|---|---|---|---|---|---|
| Rent | -10% $-213 | -5% $-143 | +0% $-73 | +5% $-3 | +10% $66 |
| Rate | -1.0pp $15 | -0.5pp $-29 | base $-73 | +0.5pp $-118 | +1.0pp $-165 |
UW: 25.0% down · 7.5% · 30yr · 1.5% tax · 5.0% vac · 8.0% maint · 8.0% mgmt
Financing live
Cash to close
- Down payment
- $43,750
- Closing costs
- $5,250
- Reserves months
- —
- Total cash needed
- —
Loan-product check · same deal, 3 products live
Conventional
25% down · 7.5% · 30yr
- Down + closing
- —
- Monthly P&I
- —
- Monthly cashflow
- —
- DSCR
- —
- Eligible?
- —
Personal DTI + credit; lowest rate.
DSCR
20% down · 8.5% · 30yr
- Down + closing
- —
- Monthly P&I
- —
- Monthly cashflow
- —
- DSCR
- —
- Eligible?
- —
No personal income docs; deal must DSCR.
Hard money
10% down · 12.0% · 12mo
- Down + closing
- —
- Monthly P&I
- —
- Monthly cashflow
- —
- DSCR
- —
- Eligible?
- —
Short-term bridge; refi at stabilization.
Rent comps 10 comps
| Address | Beds | Baths | Sqft | Rent | $/sqft | DOM | Units | Dist |
|---|---|---|---|---|---|---|---|---|
| 2603 N Rocky Rose Ave Edinburg, TX | 4.0 | 1.5 | 2219 | $2,500 | $1.13 | 45d | 1 | 0.40mi |
| 2409 Antelope Canyon St Edinburg, TX | 4.0 | 2.5 | 2529 | $2,500 | $0.99 | 15d | 1 | 0.64mi |
| 2205 Antelope Canyon St Edinburg, TX | 4.0 | 2.0 | 1657 | $2,000 | $1.21 | 45d | 1 | 0.70mi |
| 405 Olympic St Edinburg, TX | 4.0 | 2.5 | 2488 | $2,300 | $0.92 | 25d | 1 | 0.71mi |
| 3508 Silver Nugget Dr Edinburg, TX | 3.0 | 2.0 | 1586 | $1,750 | $1.10 | 15d | 1 | 0.87mi |
| 1818 W Mile 17 1/2 Rd Edinburg, TX | 2.0 | 2.5 | 1500 | $1,100 | $0.73 | 25d | 1 | 1.00mi |
| 1315 Bodark Dr Unit 4 Edinburg, TX | 2.0 | 2.5 | 1456 | $1,050 | $0.72 | 45d | 1 | 1.07mi |
| 1311 Bodark Dr Unit 4 Edinburg, TX | 3.0 | 3.0 | 1453 | $1,395 | $0.96 | 45d | 1 | 1.09mi |
| 1221 Upas Dr Unit 3 Edinburg, TX | 3.0 | 3.0 | 1300 | $1,300 | $1.00 | 45d | 1 | 1.17mi |
| 1212 White Oak Dr Unit 2 Edinburg, TX | 3.0 | 2.0 | 1250 | $1,100 | $0.88 | 45d | 1 | 1.20mi |
Listing history 7 events
-
2026-06-02days on market $175,000 Active 245 DOM
-
2026-06-01days on market $175,000 Active 244 DOM
-
2026-05-31days on market $175,000 Active 243 DOM
-
2026-05-31days on market $175,000 Active 242 DOM
-
2026-04-30price $175,000 546-char remark
Show marketing remark (546 chars)
Welcome to this wonderful detached 4 bedroom, 2 bathroom home offering 1,880 square feet of flexible living space. This is a great starter home, perfect for those looking to put their personal touch on a property with lots of potential. Located close to excellent schools and just a few miles from the university, it's ideal for families and students alike. Enjoy easy commutes with the expressway nearby, making your daily travel a breeze. With some TLC, this house can become your dream home. Don’t miss out on this fantastic opportunity!
-
2025-12-26price $195,000 546-char remark
Show marketing remark (546 chars)
Welcome to this wonderful detached 4 bedroom, 2 bathroom home offering 1,880 square feet of flexible living space. This is a great starter home, perfect for those looking to put their personal touch on a property with lots of potential. Located close to excellent schools and just a few miles from the university, it's ideal for families and students alike. Enjoy easy commutes with the expressway nearby, making your daily travel a breeze. With some TLC, this house can become your dream home. Don’t miss out on this fantastic opportunity!
-
2025-09-29$205,000 Active 546-char remark
Show marketing remark (546 chars)
Welcome to this wonderful detached 4 bedroom, 2 bathroom home offering 1,880 square feet of flexible living space. This is a great starter home, perfect for those looking to put their personal touch on a property with lots of potential. Located close to excellent schools and just a few miles from the university, it's ideal for families and students alike. Enjoy easy commutes with the expressway nearby, making your daily travel a breeze. With some TLC, this house can become your dream home. Don’t miss out on this fantastic opportunity!
ⓘ Source: listings_history table (triggers on properties + properties_extension) + one-shot
backfill from property_details.listing_events for pre-trigger history.
Tax reassessment forecast TX · Resets to sale price
- Current annual tax
- $5,739 · $478/mo
- Projected year-2 tax
- $5,739 · $478/mo
- Expected delta
- $0/yr ($0/mo · 0.0%)
ⓘ Screening estimate from a state-policy table — verify with the county assessor before closing.
Climate risk First Street
- Flood 1/10 Low FEMA zone X (shaded) · 0% chance over 30 yrs
- Wildfire 7/10 Severe
- Heat 9/10 Extreme 7 d/yr ≥112°F today · 22 d/yr by 30 yrs out
- Wind 8/10 Severe 99% chance of damaging wind over 30 yrs
- Air quality 2/10 Low 0 unhealthy d/yr today · 1 by 30 yrs out
Nearby sold comps map
Loading sold comps map…
Walkable amenities ~0.75 mi
Loading nearby amenities…
Taxation est. · year 1
- Rental income
- $21,202
- − Mortgage interest
- −$9,803
- − Property taxes
- −$5,739
- − Insurance
- −$875
- − Repairs & maintenance
- −$1,696
- − Management
- −$1,696
- − Depreciation
- −$5,091
- Taxable loss
- −$3,698
- Est. tax savings @ 24.0%
- +$888
- After-tax cash flow
- $10/yr
For passive investors: Depreciation is non-cash, so a rental often shows a tax loss while cash-flowing — sheltering income. Rental losses are passive: they offset passive income freely, and up to $25,000/yr can offset ordinary (W-2) income if you actively participate and your MAGI is under $100k (phasing out to $0 by $150k); unused losses carry forward. On sale, claimed depreciation is recaptured at up to 25%, and gains may owe capital-gains tax (a 1031 exchange can defer both). Figures are a year-1 estimate at your 24.0% rate — not tax advice; consult a CPA.
Schools (NCES district)
- District
- Edinburg CISD
- NCES district ID
- 4818180
- Math proficiency
- 20% ▼ -34.00%
- Reading proficiency
- 34% ▼ -11.00%
- Median HH income
- $36,985
- Composite
- 22.42/100
- National rank
- #8114
- State rank
- #699 of 826 in TX
Livability — Edinburg
- Score
- 64/100
- State rank
- #784
- US rank
- #14319
Category grades
Schools grade is shown separately in the Schools card above.
Census & demographics
- Census place
- Edinburg, TX
- County
- Hidalgo County · 623,128 people
- City population
- 178,279
- Metro
- McAllen-Edinburg-Mission, TX
- Population (ZIP)
- 51,710
- Household income
- $52,863
- Rent vs Own
- Severe rent burden
- 1963.0
Population outlook (Hidalgo County) Hauer SSP2
- Today (2025)
- 955,232 people
- By 2030
- 1,009,774 · +5.7%
- By 2040
- 1,120,332 · +17.3%
- By 2050
- 1,225,036 · +28.2%
- By 2075
- 1,439,189 · +50.7%
- By 2100
- 1,533,429 · +60.5%
Race, ethnicity, and origin ACS 2023
- Neighborhood character
- Predominantly Hispanic (88%)
- Race & ethnicity
- Hispanic / Latino 88% Two or more races 49% White 8% Black 2% Asian 2%
- Hispanic origin (detail)
- Mexican 83%
- Foreign-born
- 22% · Canada, South Korea, Jamaica
- Languages at home
- 24% English-only · Spanish 73% Other Indo-European 1% Korean 1%
Political lean MEDSL · Hidalgo
- 2024 margin
- Toss-up / Even · D 48.1% · R 51.0%
- 2008→2024 swing
- -41.6pp toward R · 2008: 38.7pp · 2024: -2.9pp
- All cycles
- 2024: R+2.9 2020: D+17.1 2016: D+40.5 2012: D+41.8 2008: D+38.7
Not yet ingested
- Civics
- —
Market trends
- HPI YoY
- ▼ -17.63%
- Current HPI
- 215.1057
- Rent YoY
- ▲ 2.01%
- Metro
- McAllen-Edinburg-Mission, TX
- State GDP YoY
- ▲ 3.95%
- F500 in state
- 110
Industry mix (Fortune 500 HQ in TX)
| Industry | F500 HQs | Revenue |
|---|---|---|
| Energy | 16 | $1,198B |
|
||
| Technology | 5 | $198B |
|
||
| Engineering / Construction | 4 | $72B |
|
||
| Energy Services | 3 | $60B |
|
||
| Utilities | 3 | $41B |
|
||
| Healthcare | 2 | $330B |
|
||
Price history
-14.6% since first listed3 events — show timeline
- 2026-04-30 Price Changed $175,000 MCALLENMLS
- 2025-12-26 Price Changed $195,000 MCALLENMLS
- 2025-09-29 Listed $205,000 MCALLENMLS
Property tax history
+7.0%/yrLatest (2025): $5,739 · +7.1% YoY. Source: county tax records.
Cash-flow waterfall
monthlySold comps — $/sqft
last 12 mo · ≤1 miLoading sold comps…