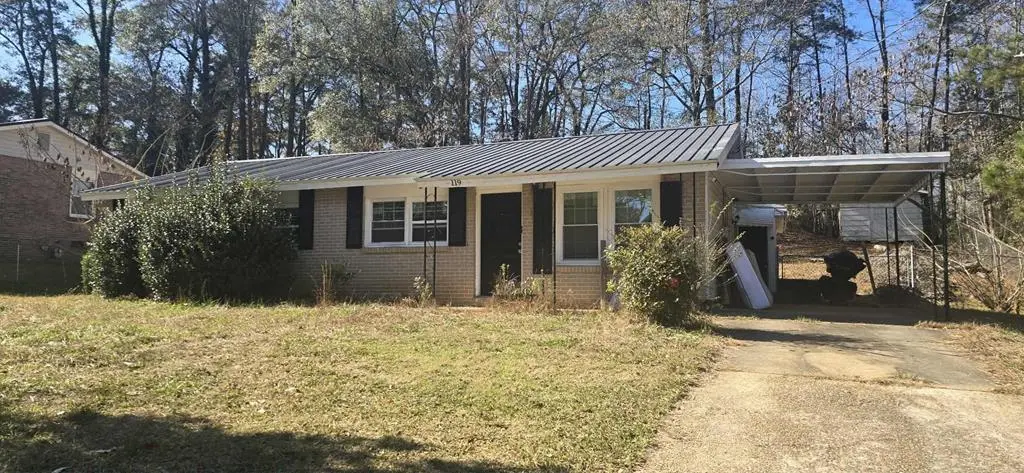
119 Sir Lancelot St · LaGrange, GA
Flood risk 1/10 · Minimal
- FEMA flood zone
- X (unshaded)
- Chance of flooding over 30 yrs
- 0.0%
- Est. flood insurance / yr
- $507 – $1,088
Fire risk 3/10 · Minor
- Est. fire insurance / yr
- $963 – $1,789
Heat risk 6/10 · Moderate
- Hot days now (above 105°F)
- 7 days/yr
- Hot days in 30 yrs
- 19 days/yr
Wind risk 6/10 · Moderate
- Chance of severe wind over 30 yrs
- 51.0%
Air-quality risk 4/10 · Minor
- Unhealthy air days now
- 4 days/yr
- Unhealthy air days in 30 yrs
- 5 days/yr
Risk factors via First Street. Map © Google.
Why this score? — see what drove the D grade
The composite is a weighted blend of 9 inputs, each scored 0–100. Each bar is that input's sub-score; the figure is the points it added to the 100-point composite (weight × sub-score).
- Cash flow +17.3/30.0
- DSCR +5.4/10.0
- 1% rule +4.1/10.0
- Rent growth +3.7/5.0
- ARV discount +3.0/15.0
- Livability +3.0/5.0
- Condition / age +2.5/5.0
- Schools +2.3/10.0
- Appreciation +0.0/10.0
$222,900
🖨 Deal sheet 📄 Offer letter ✓ Due diligence
Listing remarks MLS
Charming 4-bedroom, 1.5-bath home featuring two spacious living areas and a large backyard—perfect for relaxing or entertaining. Metal Roof! Enjoy the convenience of a 1-car carport and a location close to shopping, schools, and everyday amenities.
Key facts
- 1-car carport
- Metal roof
- Large backyard
Tags
Neighborhood map
What this means for you Summary
Snapshot
- This is a 4-bed/1.5-bath single-family listed at $223k.
Deal economics
- At list price, monthly cash flow is $165 ($2k/yr) — positive.
- The deal already cash-flows at list — no discount required.
- To meet the 1% rule (rent ≥ 1% of price), the offer needs to be $203k (8.9% below list).
- Recommended offer: $203k (9.0% below list) — sets the bar for market timing.
- Cap rate 7.2% vs local median 3.4% in LaGrange — top-decile yield for the area; either an underpriced asset or a hidden risk that comps aren't pricing in. Stress-test before assuming the spread holds.
Location & tenants
- Location reads 60/100 on livability (#393 in GA) — a middle-class / working-renter tenant base. Strengths: cost of living A+, housing A; Watch: schools D-, crime F, amenities F.
- Troup County (rural): math 26% / reading 29% proficiency, ranked #109 of 174 in GA (top 63%) — low school quality limits family demand, transient renter base, plan for 1-2y turnover.
- Market conditions: Rents rising fast (+5.0%/yr); 269 active listings in the ZIP; 6 comparable units currently listed for rent nearby; rentals lingering (median 44d on market — plan ~5-8 weeks vacancy on turnover, expect pricing pressure); 50% of comp listings sitting > 30 days — soft ceiling on asking rent; 474 units permitted in Troup County in 2024 (87 in 5+ unit buildings).
- At $2,031/mo this rent would consume 50% of the median local household income ($49k/yr) (locally 1383% of renters already pay >50% of income on rent) — very limited rent-growth headroom before tenants either downsize or default.
Forward outlook
- Local home prices are declining (-3.0%/yr); year-one equity from $2k of loan paydown is wiped out by about $7k of value loss. Plan a longer hold.
- Troup County population projected at +15% by 2050 — long-run rental-demand tailwind backs the buy-and-hold thesis.
Negotiation context
- It's been on market 112 days — a 9% lower offer ($203k) is reasonable based on typical stale-listing flexibility.
- 4 sale attempts since 7y ago with the ask held roughly flat each time — persistent listings suggest the price (not the market) is what's stuck; bring a comps-based counter.
- Current owner paid $191k; 16% above their basis — modest negotiation headroom, anchor on the comps not their cost.
Risks & watch-outs
- Climate carrying-cost: major wind risk, 51% chance of damaging wind over 30y; extreme-heat days projected 7→19/yr by 2055 (HVAC capex compounding) — expect insurance premiums to compound above CPI over the hold.
Questions for the listing agent
- It's been on market 112 days. Have you received any prior offers? Is the seller open to a 9% concession, seller financing, or rate buy-down credit?
- Built in 1972 — when were the roof, HVAC, electrical panel, plumbing, and water heater last replaced?
- Why hasn't it sold? Are there any deal-killer items the seller is aware of (foundation, flood, title, zoning, code violations)?
- Is there a deadline driving the sale (1031 exchange, divorce, estate, relocation)? That informs how much negotiation room exists.
- Schools are D-rated, which usually means shorter tenancies and higher turnover. Who's the typical renter profile here, and what's been the actual vacancy rate?
- Crime grade is F in this area — have there been break-ins, vandalism, or insurance claims at this property in the last 3 years? What carrier currently insures it and at what premium?
- The area grade is low — what's the realistic commute time and amenity access for the typical tenant pool here? Any planned neighborhood developments (good or bad) we should know about?
- What's the average days-on-market for RENTAL listings here right now (not sales)? A rising rental-DOM trend means longer vacancies and softer asking-rent achievability than the comps imply.
- What's the recent tenant-quality profile in this submarket — average credit score on applications, eviction rate, late-payment / NSF rate, and stable-employment percentage? A property-management company in the area should have these aggregated.
- How much new for-sale + rental construction is in the pipeline within 1–3 miles? Heavy new supply typically softens prices + rents 12–24 months out; constrained supply supports both.
Investment metrics
- 1% rule
- 0.91% ✗
- Cap rate
- 7.18%
- Cash-on-cash
- 3.17%
- DSCR
- 1.14
- GRM
- 9.1
CMA / ARV
- ARV (median comp)
- $202,506
- List price
- $222,900
- Delta
- 10.07%
- Verdict
- OVERPRICED
- Comps
- 20 within 1.0 mi
Show comp detail 12 sales within ~0.75 mi
| Address | Dist | Beds/Ba | Sqft | Sold | Price | $/sf | Match |
|---|---|---|---|---|---|---|---|
| 102 King Arthur Dr | 0.21mi | 4/2.0 | 1,766 (+4%) | 9mo | $98,500 | $56 | 73 |
| 227 River Meadow Dr | 0.67mi | 3/2.5 (-1) | 1,700 (+0%) | 4mo | $285,000 | $168 | 56 |
| 242 River Meadow Dr | 0.61mi | 3/2.0 (-1) | 1,607 (-5%) | 2mo | $245,900 | $153 | 54 |
| 109 Sarah Ln | 0.57mi | 3/2.5 (-1) | 1,600 (-5%) | 2mo | $230,000 | $144 | 54 |
| 113 Woodridge Cir | 0.45mi | 3/2.0 (-1) | 1,450 (-14%) | 5mo | $224,900 | $155 | 44 |
| 240 River Meadow Dr | 0.61mi | 3/2.0 (-1) | 1,484 (-12%) | 1mo | $228,000 | $154 | 43 |
| 249 River Meadow Dr | 0.62mi | 3/2.0 (-1) | 1,484 (-12%) | 2mo | $228,000 | $154 | 42 |
| 239 River Meadow Dr | 0.66mi | 3/2.0 (-1) | 1,545 (-9%) | 9mo | $242,500 | $157 | 40 |
| 125 Ridgefield Cir | 0.62mi | 3/2.0 (-1) | 1,483 (-12%) | 5mo | $209,000 | $141 | 39 |
| 300 Old Pond Rd | 0.75mi | 3/2.5 (-1) | 1,844 (+9%) | 3mo | $242,000 | $131 | 39 |
| 726 Windstream Dr Unit A10 | 0.51mi | 3/2.0 (-1) | 1,455 (-14%) | 12mo | $289,990 | $199 | 36 |
| 250 Old Pond Rd | 0.70mi | 3/2.5 (-1) | 1,882 (+11%) | 5mo | $274,000 | $146 | 35 |
Match score weights: distance 35% · size 25% · config 20% · recency 20%. Top-matched comps best support the ARV.
Projected returns pro-forma
-3.0% appreciation · 4.95% rent growth · sell at horizon
- IRR
- -9.3%
- Equity multiple
- 0.65×
- Total profit
- $-21,584
- Equity at exit
- $33,235
- IRR
- 2.5%
- Equity multiple
- 1.19×
- Total profit
- $11,951
- Equity at exit
- $19,272
Cash invested: $62,412 (down + closing). Projections, not guarantees.
Landlord ↔ Tenant lean methodology
- Overall (STATE)
- 90 Strongly Landlord-Friendly
- State Georgia
- 90 Strongly Landlord-Friendly · R+3
- County
- — inherits STATE
- City
- — inherits STATE
ZIP-level market 30241
- Home prices YoY
- -3.6%
- Rents YoY
- 5.0%
- Active inventory
- 269
- Price-to-rent
- 9.1×
Monthly cashflow live
- Estimated rent
- $2,031 high interval (Pro) →
- Mortgage (P&I)
- −$1,169
- Tax from tax record
- −$178 /mo · $2,133/yr
- Insurance
- −$93
- HOA
- −$0
- Vacancy / Maint / Mgmt
- −$426
- Net cashflow
- $165
Break-even live
UW: 25.0% down · 7.5% · 30yr · 1.5% tax · 5.0% vac · 8.0% maint · 8.0% mgmt
Financing live
Cash to close
- Down payment
- $55,725
- Closing costs
- $6,687
- Reserves months
- —
- Total cash needed
- —
Loan-product check · same deal, 3 products live
Conventional
25% down · 7.5% · 30yr
- Down + closing
- —
- Monthly P&I
- —
- Monthly cashflow
- —
- DSCR
- —
- Eligible?
- —
Personal DTI + credit; lowest rate.
DSCR
20% down · 8.5% · 30yr
- Down + closing
- —
- Monthly P&I
- —
- Monthly cashflow
- —
- DSCR
- —
- Eligible?
- —
No personal income docs; deal must DSCR.
Hard money
10% down · 12.0% · 12mo
- Down + closing
- —
- Monthly P&I
- —
- Monthly cashflow
- —
- DSCR
- —
- Eligible?
- —
Short-term bridge; refi at stabilization.
Rent comps 6 comps
| Address | Beds | Baths | Sqft | Rent | $/sqft | DOM | Units | Dist |
|---|---|---|---|---|---|---|---|---|
| 1235 Hogansville Rd LaGrange, GA | 3.0 | 2.0 | 1263 | $1,555 | $1.23 | 43d | 1 | 0.55mi |
| 151 S Davis Rd LaGrange, GA | 3.0 | 1.0–2.0 | 940 | $1,887 | $2.01 | 3d | 31 | 0.60mi |
| 139 Shenandoah Ln LaGrange, GA | 4.0 | 2.5 | 1896 | $2,180 | $1.15 | 43d | 1 | 0.61mi |
| 140 Shenandoah Ln LaGrange, GA | 4.0 | 2.5 | 2156 | $2,280 | $1.06 | 43d | 1 | 0.61mi |
| 140 N Davis Rd LaGrange, GA | 1.0–3.0 | 1.0–2.0 | 983 | $1,719 | $1.75 | 2d | 14 | 0.62mi |
| 1 Canopy Crest WAY LaGrange, GA | 2.0–4.0 | 2.5–3.0 | 1442 | $2,685 | $1.86 | 3d | 9 | 0.89mi |
Listing history 30 events
-
2026-06-19days on market $222,900 Active 112 DOM
-
2026-06-18days on market $222,900 Active 111 DOM
-
2026-06-17days on market $222,900 Active 110 DOM
-
2026-06-16days on market $222,900 Active 109 DOM
-
2026-06-15days on market $222,900 Active 108 DOM
-
2026-06-14days on market $222,900 Active 106 DOM
-
2026-06-12days on market $222,900 Active 105 DOM
-
2026-06-09days on market $222,900 Active 102 DOM
-
2026-06-08days on market $222,900 Active 101 DOM
-
2026-06-07days on market $222,900 Active 100 DOM
-
2026-06-05days on market $222,900 Active 97 DOM
-
2026-06-02days on market $222,900 Active 95 DOM
-
2026-06-01days on market $222,900 Active 94 DOM
-
2026-05-31days on market $222,900 Active 93 DOM
-
2026-05-30days on market $222,900 Active 92 DOM
-
2026-02-27$222,900 Active 255-char remark
Show marketing remark (255 chars)
Charming 4-bedroom, 1.5-bath home featuring two spacious living areas and a large backyard—perfect for relaxing or entertaining. Metal Roof! Enjoy the convenience of a 1-car carport and a location close to shopping, schools, and everyday amenities.
-
2026-01-10price $222,900
-
2023-11-03soldstatus $191,400
-
2023-11-02soldstatus $191,400 Sold
-
2023-10-06status Under Contract
-
2023-09-29price $192,000
-
2023-09-11status Back On Market
-
2023-08-31status Under Contract
-
2023-08-10price $179,900
-
2023-07-17$189,900 New
-
2020-08-05soldstatus $70,000
-
2019-08-31historical
-
2019-08-16price $59,800
-
2019-08-07price $59,900
-
2019-07-30$66,900 New
ⓘ Source: listings_history table (triggers on properties + properties_extension) + one-shot
backfill from property_details.listing_events for pre-trigger history.
Tax reassessment forecast GA · Resets to sale price
- Current annual tax
- $2,133 · $178/mo
- Projected year-2 tax
- $2,133 · $178/mo
- Expected delta
- $0/yr ($0/mo · 0.0%)
ⓘ Screening estimate from a state-policy table — verify with the county assessor before closing.
Climate risk First Street
- Flood 1/10 Low FEMA zone X (unshaded) · 0% chance over 30 yrs
- Wildfire 3/10 Moderate
- Heat 6/10 Major 7 d/yr ≥105°F today · 19 d/yr by 30 yrs out
- Wind 6/10 Major 51% chance of damaging wind over 30 yrs
- Air quality 4/10 Moderate 4 unhealthy d/yr today · 5 by 30 yrs out
Nearby sold comps map
Loading sold comps map…
Walkable amenities ~0.75 mi
Loading nearby amenities…
Taxation est. · year 1
- Rental income
- $24,371
- − Mortgage interest
- −$12,486
- − Property taxes
- −$2,133
- − Insurance
- −$1,114
- − Repairs & maintenance
- −$1,950
- − Management
- −$1,950
- − Depreciation
- −$6,484
- Taxable loss
- −$1,745
- Est. tax savings @ 24.0%
- +$419
- After-tax cash flow
- $2,398/yr
For passive investors: Depreciation is non-cash, so a rental often shows a tax loss while cash-flowing — sheltering income. Rental losses are passive: they offset passive income freely, and up to $25,000/yr can offset ordinary (W-2) income if you actively participate and your MAGI is under $100k (phasing out to $0 by $150k); unused losses carry forward. On sale, claimed depreciation is recaptured at up to 25%, and gains may owe capital-gains tax (a 1031 exchange can defer both). Figures are a year-1 estimate at your 24.0% rate — not tax advice; consult a CPA.
Schools (NCES district)
- District
- Troup County
- NCES district ID
- 1300001
- Math proficiency
- 26% ▼ -10.00%
- Reading proficiency
- 29% ▼ -4.00%
- Median HH income
- $41,354
- Composite
- 23.3/100
- National rank
- #7920
- State rank
- #109 of 174 in GA
Livability — LaGrange
- Score
- 60/100
- State rank
- #393
- US rank
- #19555
Category grades
Schools grade is shown separately in the Schools card above.
Census & demographics
- Census place
- LaGrange, GA
- County
- Troup County · 57,111 people
- City population
- 57,111
- Metro
- LaGrange, GA-AL
- Population (ZIP)
- 25,840
- Household income
- $49,053
- Rent vs Own
- Severe rent burden
- 1383.0
Population outlook (Troup County) Hauer SSP2
- Today (2025)
- 75,537 people
- By 2030
- 78,250 · +3.6%
- By 2040
- 83,184 · +10.1%
- By 2050
- 87,167 · +15.4%
- By 2075
- 95,643 · +26.6%
- By 2100
- 94,234 · +24.8%
Race, ethnicity, and origin ACS 2023
- Neighborhood character
- Diverse neighborhood (Simpson 0.58)
- Race & ethnicity
- Black 46% White 46% Hispanic / Latino 3% Asian 3% Two or more races 2%
- Common ancestry
- Lithuanian 1% Hispanic 1% Italian 1%
- Foreign-born
- 4% · South Korea, Canada
- Languages at home
- 93% English-only · Spanish 3% Korean 2% Other Indo-European 1%
Political lean MEDSL · Troup
- 2024 margin
- Strong R (+24.4) · D 37.6% · R 62.0%
- 2008→2024 swing
- -5.4pp toward R · 2008: -19.0pp · 2024: -24.4pp
- All cycles
- 2024: R+24.4 2020: R+21.9 2016: R+23.4 2012: R+17.8 2008: R+19.0
Not yet ingested
- Civics
- —
Market trends
- HPI YoY
- ▼ -10.51%
- Current HPI
- 277.9099
- Rent YoY
- ▲ 4.95%
- Metro
- LaGrange, GA-AL
- State GDP YoY
- ▲ 2.66%
- F500 in state
- 28
Industry mix (Fortune 500 HQ in GA)
| Industry | F500 HQs | Revenue |
|---|---|---|
| Paper / Packaging | 2 | $29B |
|
||
| Retail | 1 | $160B |
|
||
| Transportation / Logistics | 1 | $91B |
|
||
| Airlines | 1 | $62B |
|
||
| Consumer Goods | 1 | $47B |
|
||
| Utilities | 1 | $25B |
|
||
Price history
+233.2% since first listed15 events — show timeline
- 2026-02-27 Listed $222,900 CBOR
- 2026-01-10 Price Changed $222,900 CBOR
- 2023-11-03 Sold (Public Records) $191,400 Public Records
- 2023-11-02 Sold (MLS) $191,400 GAMLS
- 2023-10-06 Pending — GAMLS
- 2023-09-29 Price Changed $192,000 GAMLS
- 2023-09-11 Relisted — GAMLS
- 2023-08-31 Pending — GAMLS
- 2023-08-10 Price Changed $179,900 GAMLS
- 2023-07-17 Listed $189,900 GAMLS
- 2020-08-05 Sold (Public Records) $70,000 Public Records
- 2019-08-31 Listing Removed — GAMLS
- 2019-08-16 Price Changed $59,800 GAMLS
- 2019-08-07 Price Changed $59,900 GAMLS
- 2019-07-30 Listed $66,900 GAMLS
Property tax history
+5.8%/yrLatest (2025): $2,133 · +9.0% YoY. Source: county tax records.
Cash-flow waterfall
monthlySold comps — $/sqft
last 12 mo · ≤1 miLoading sold comps…